Statistics Project: Analysis of Sales and Order Quantity Data

Verified

Added on  2020/10/23

|27
|863
|144
Project
AI Summary
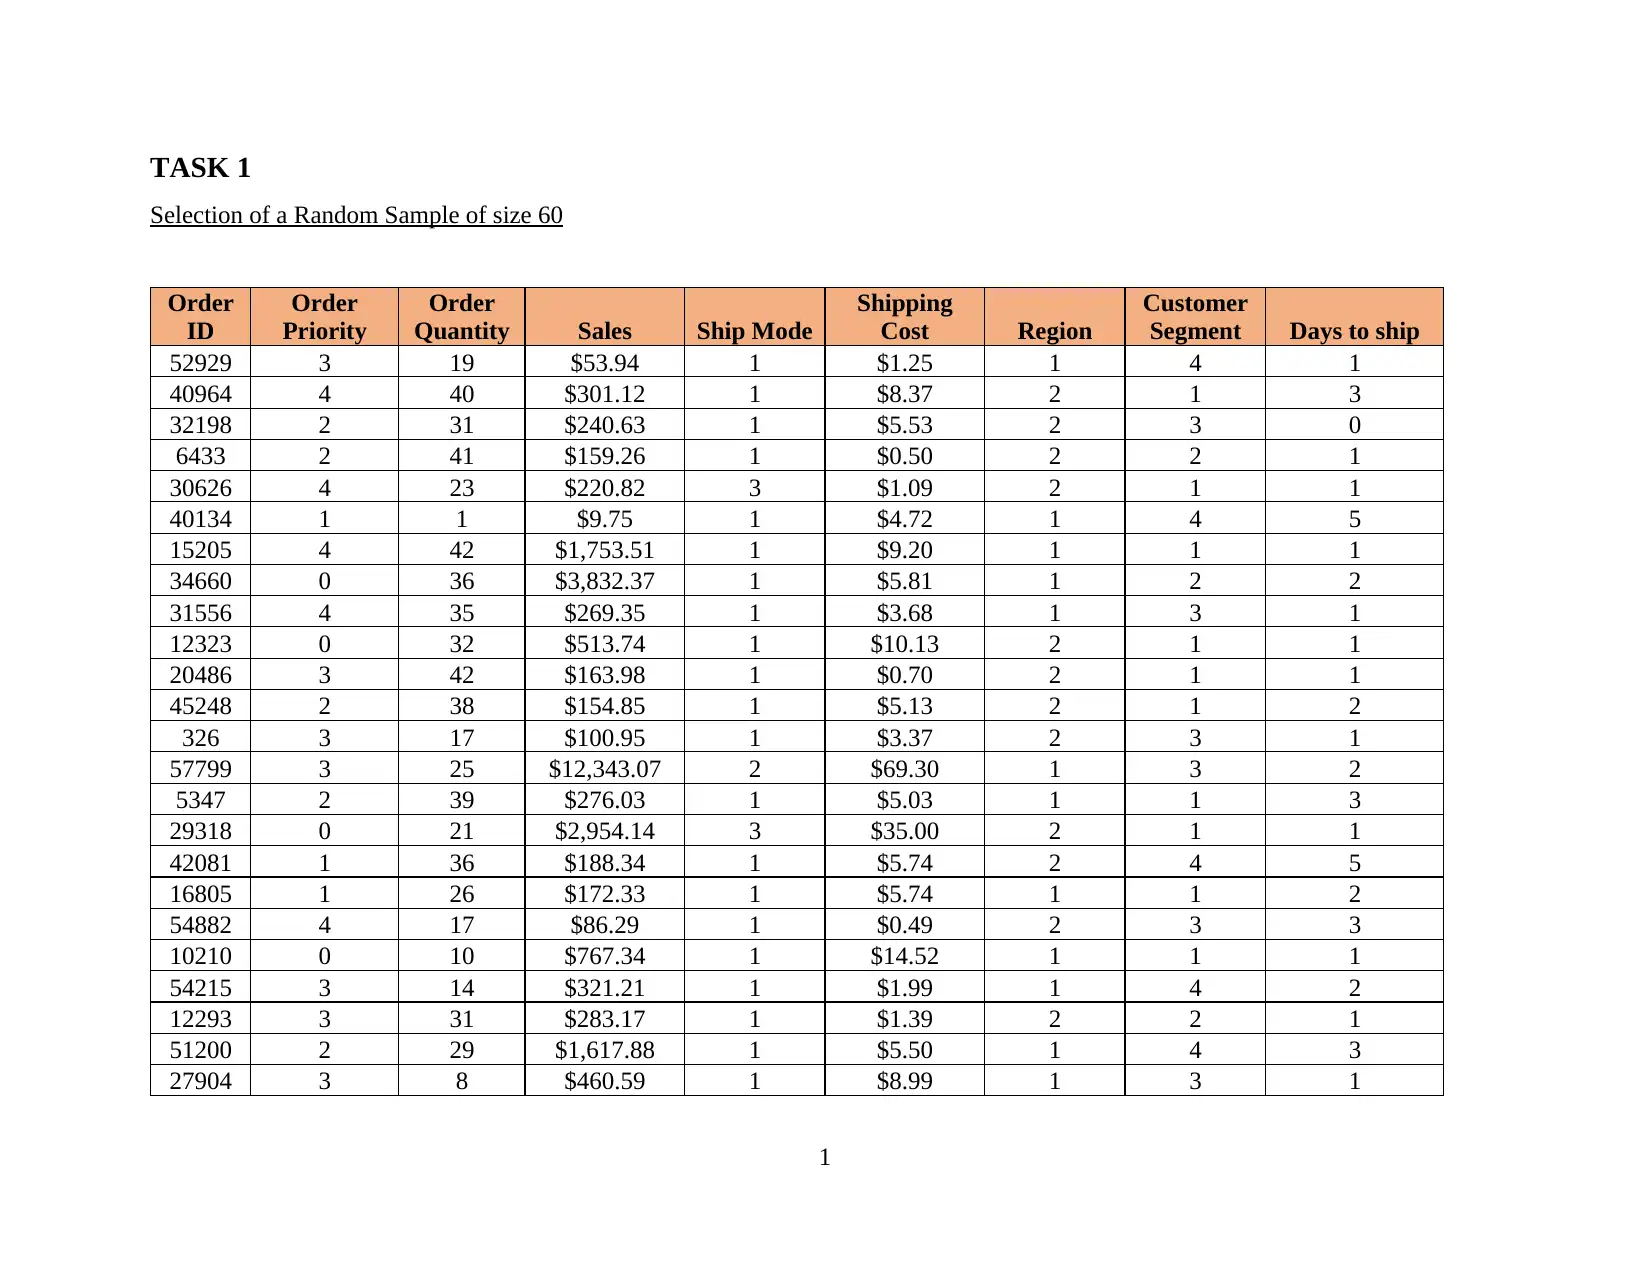
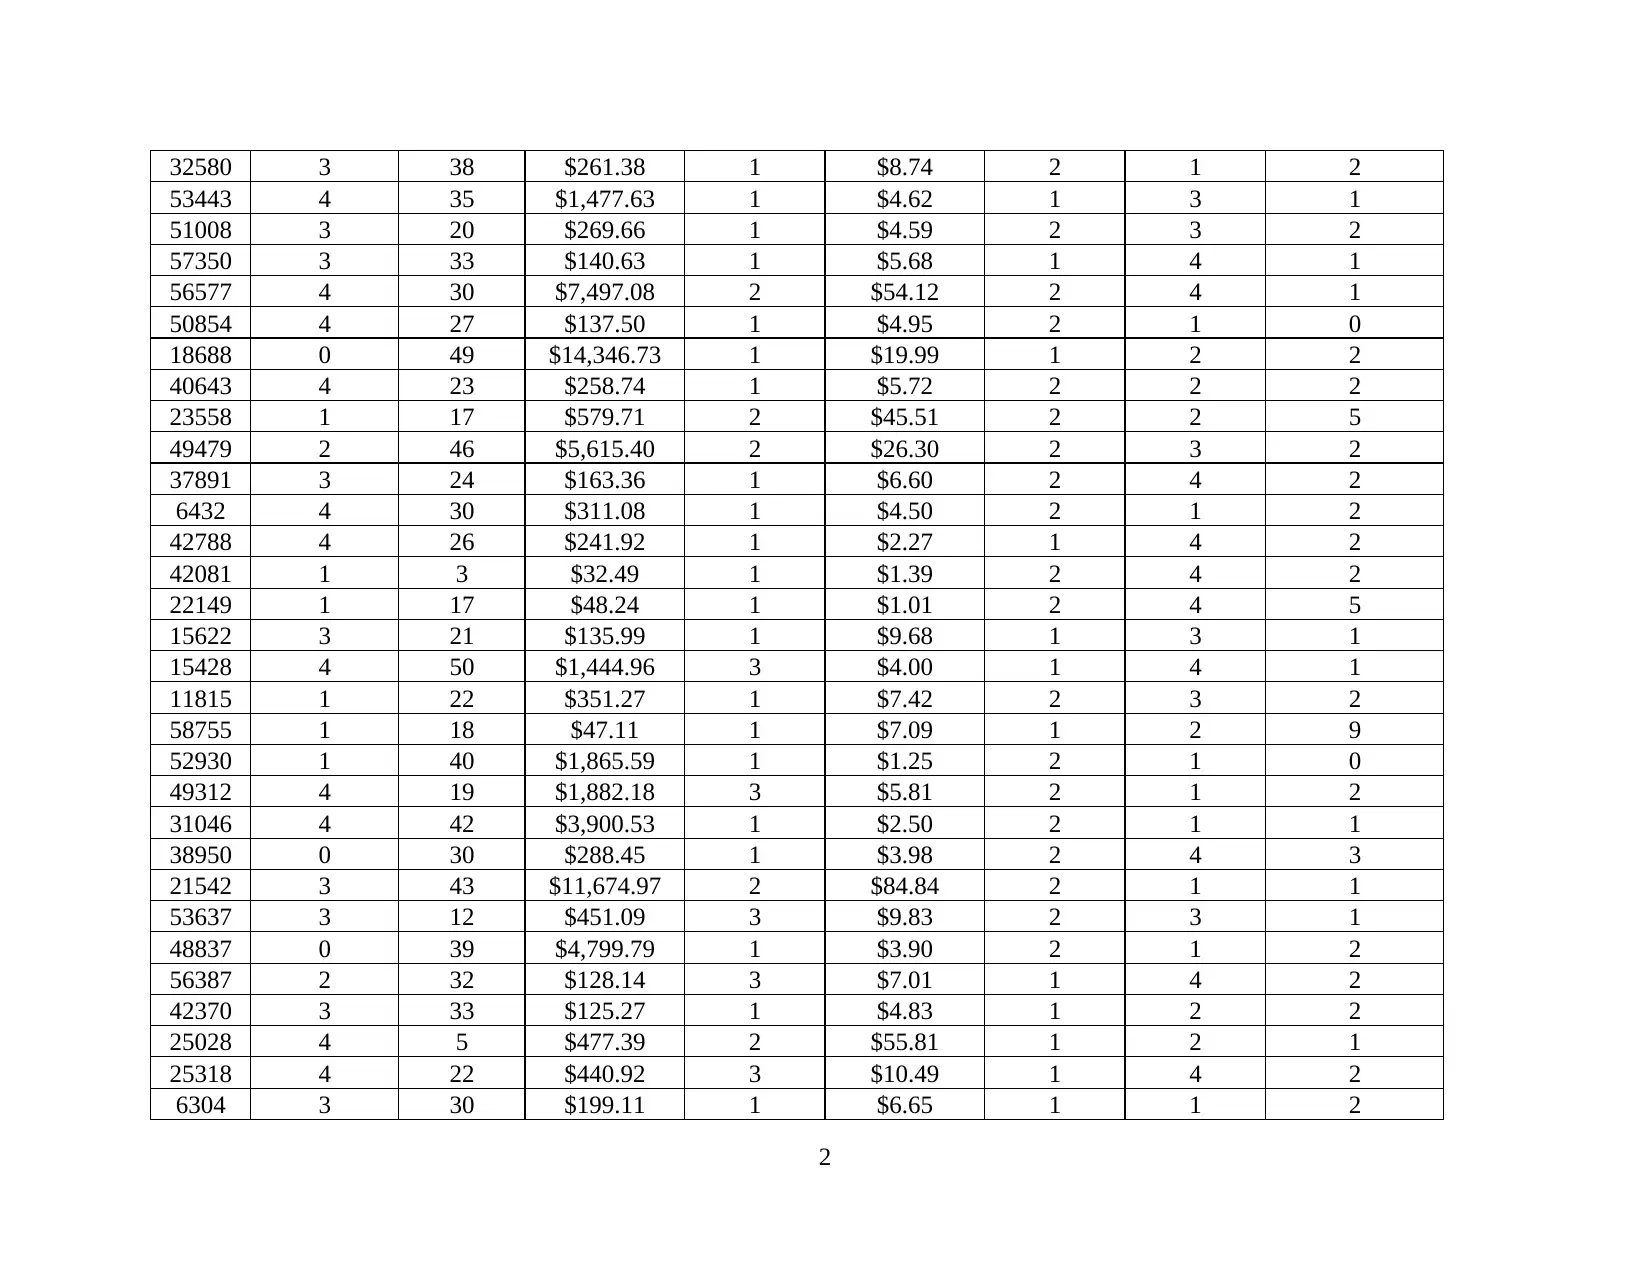
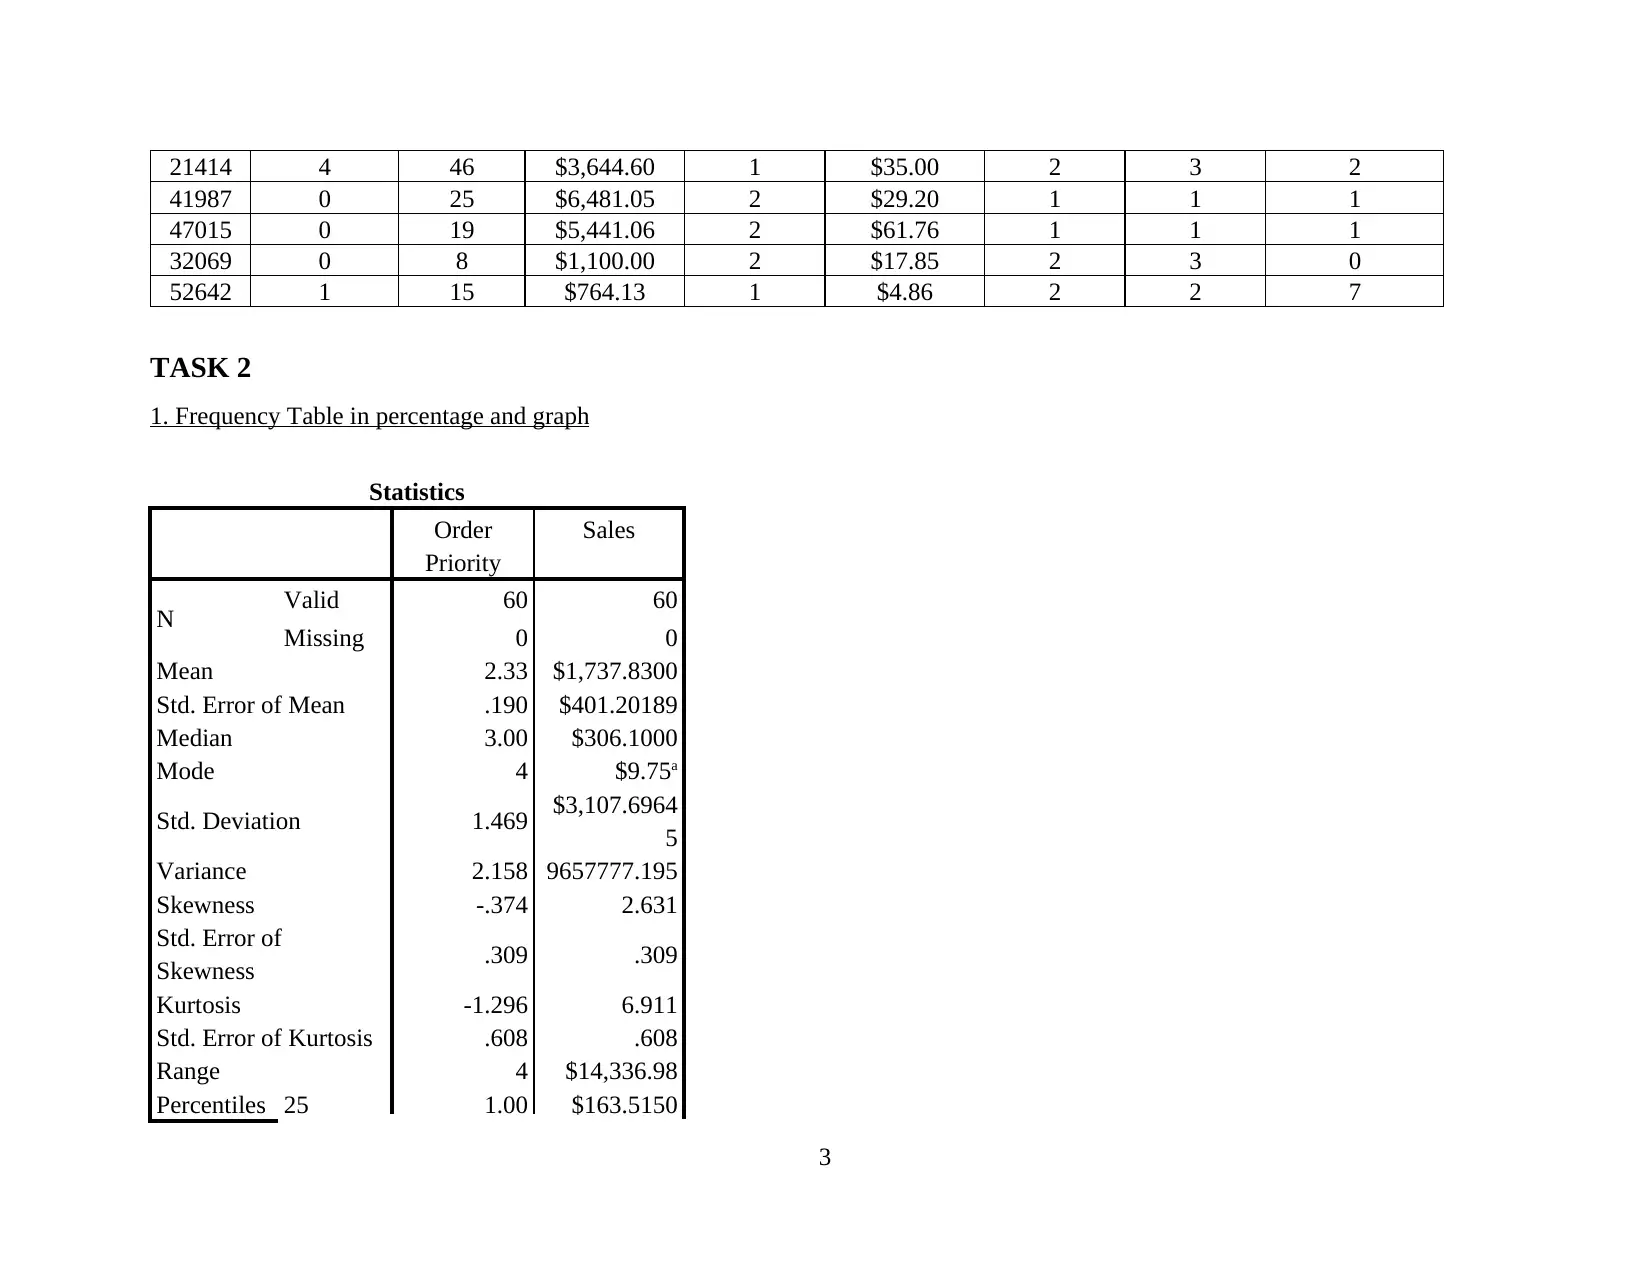
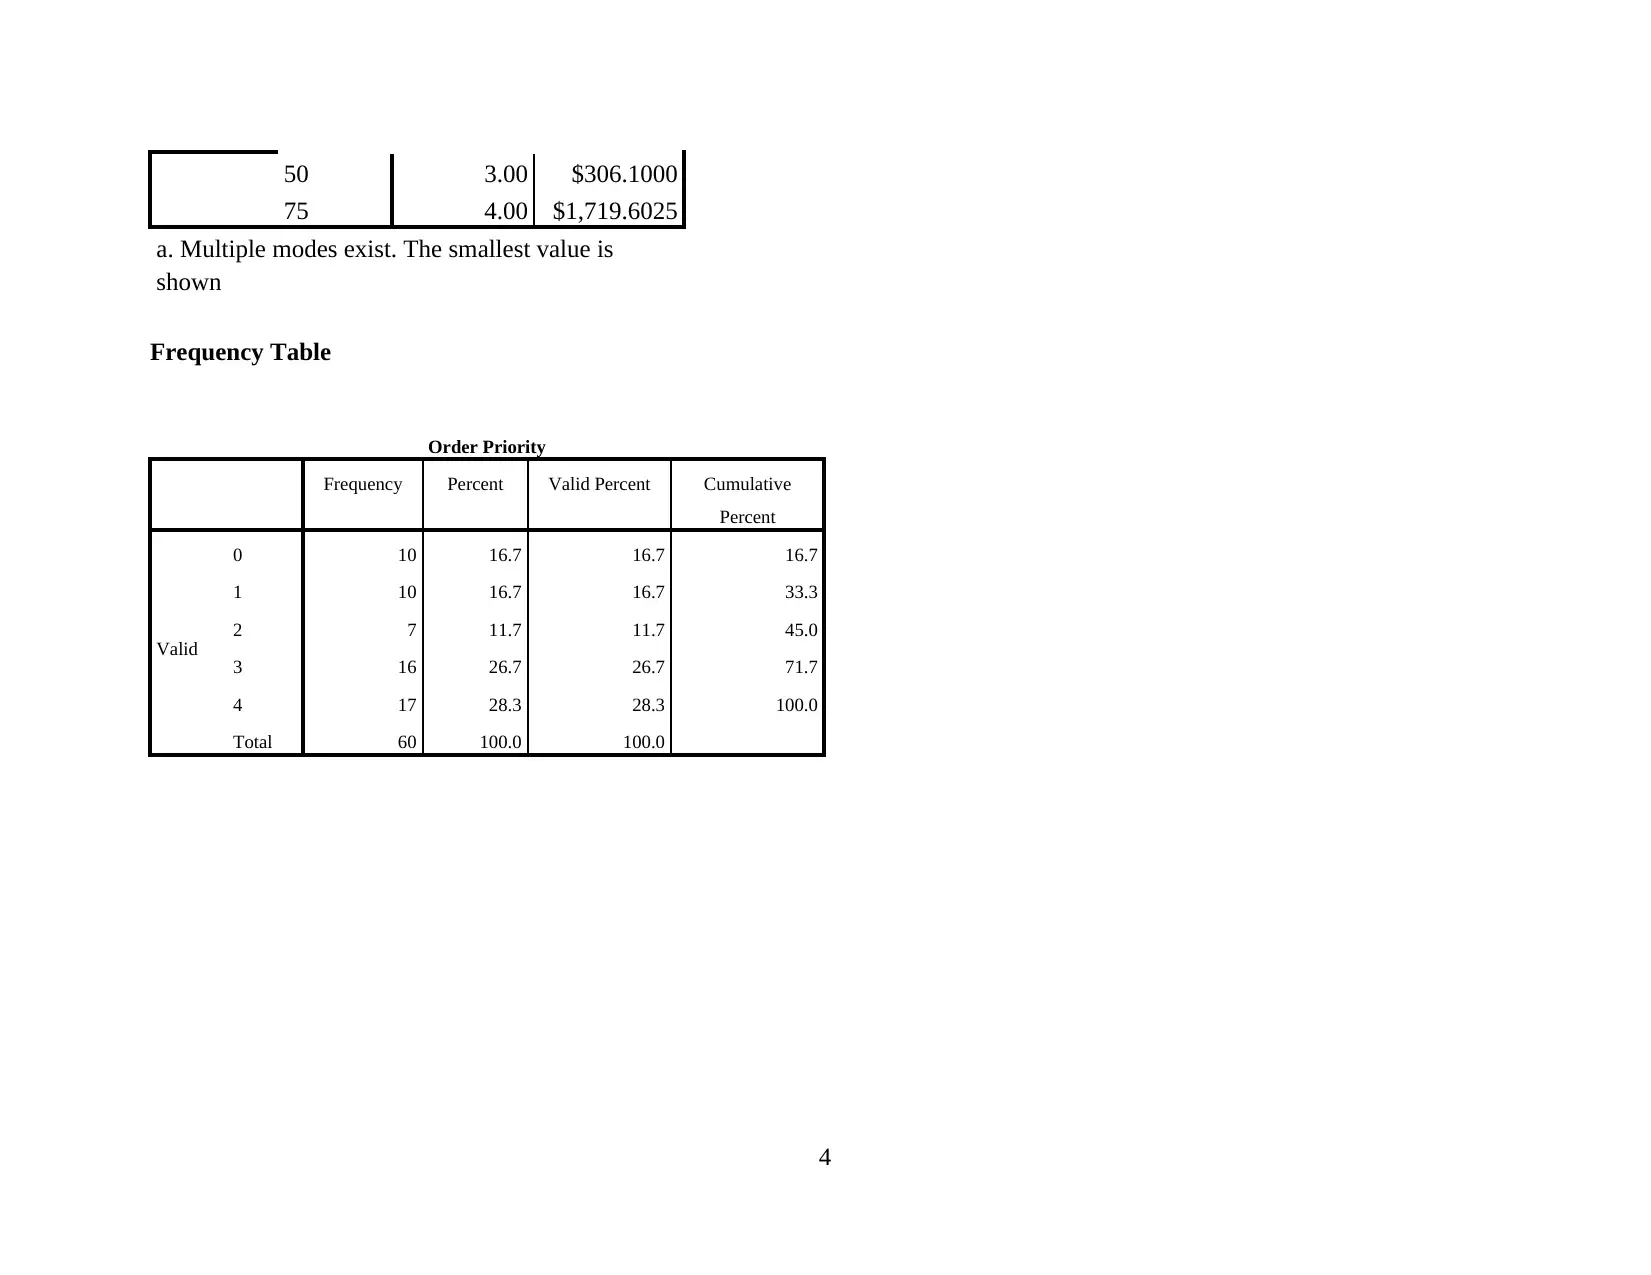
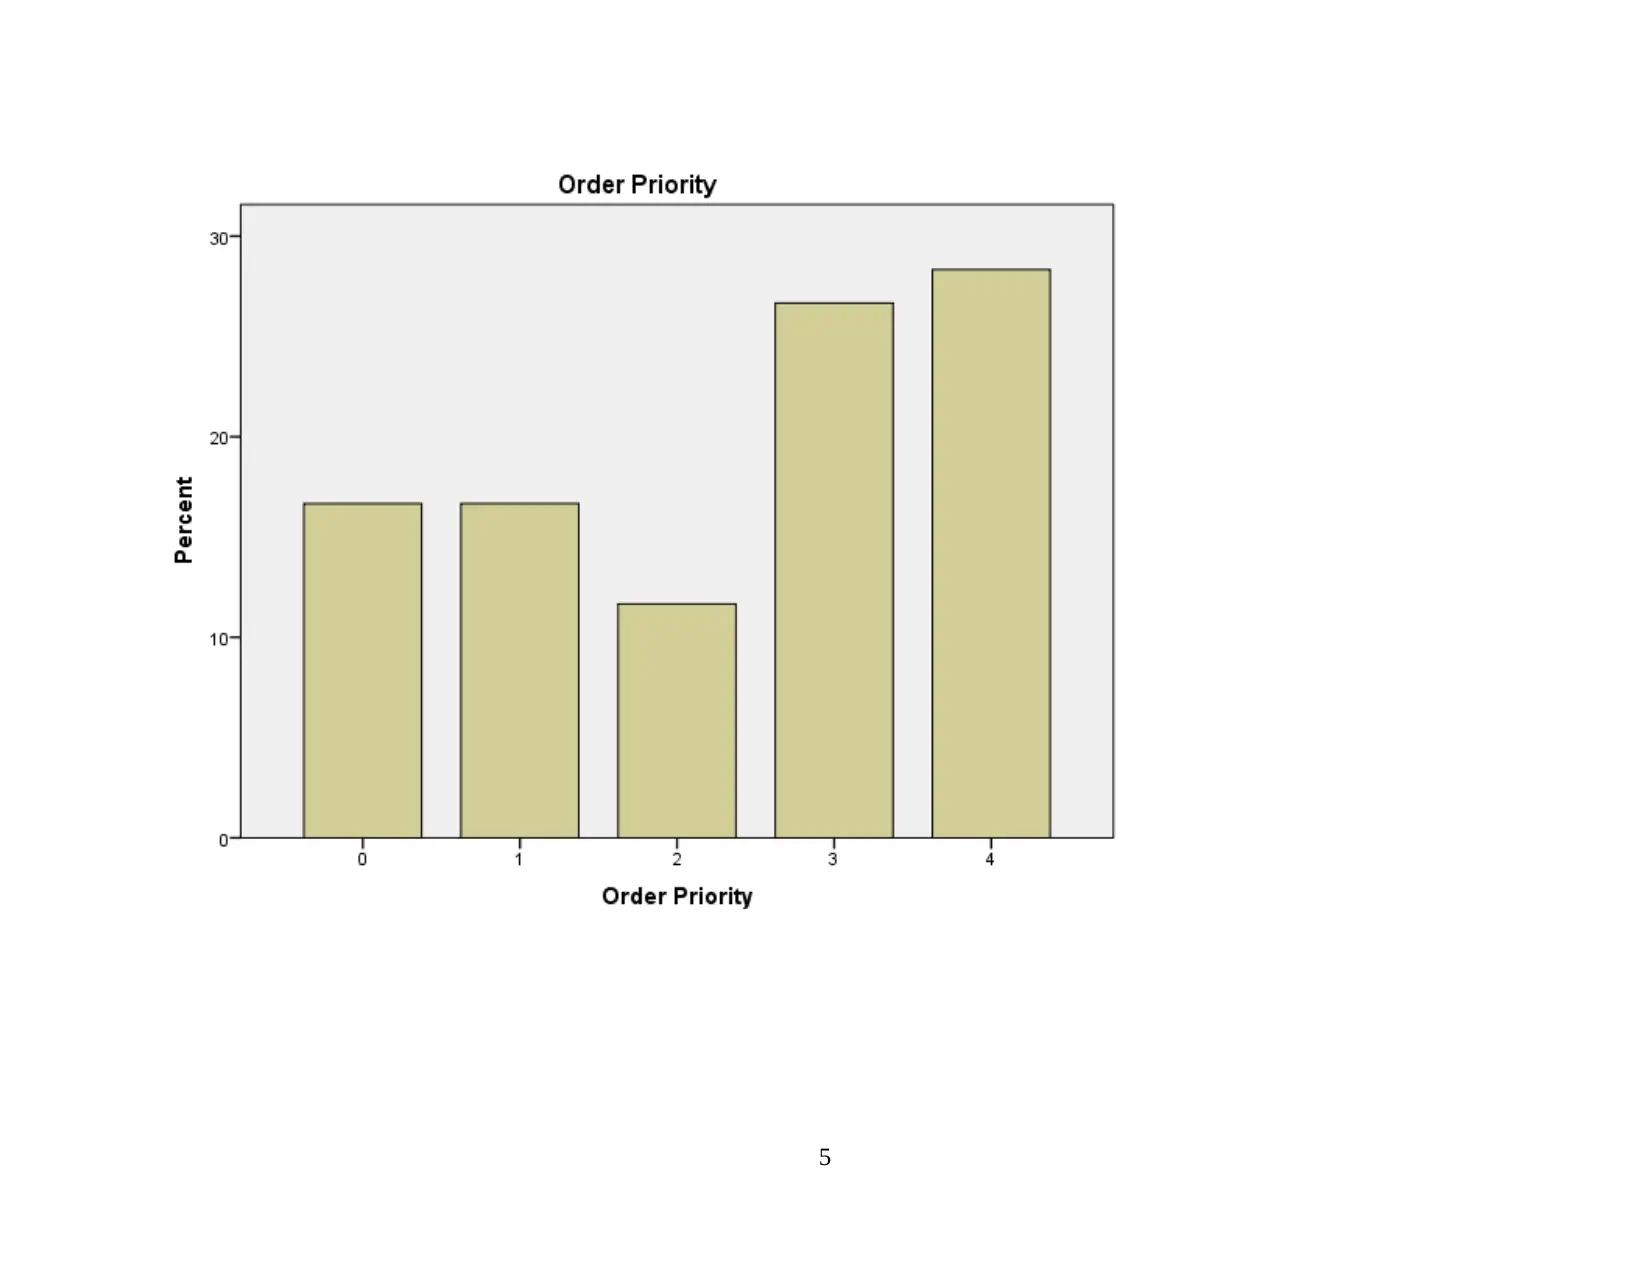
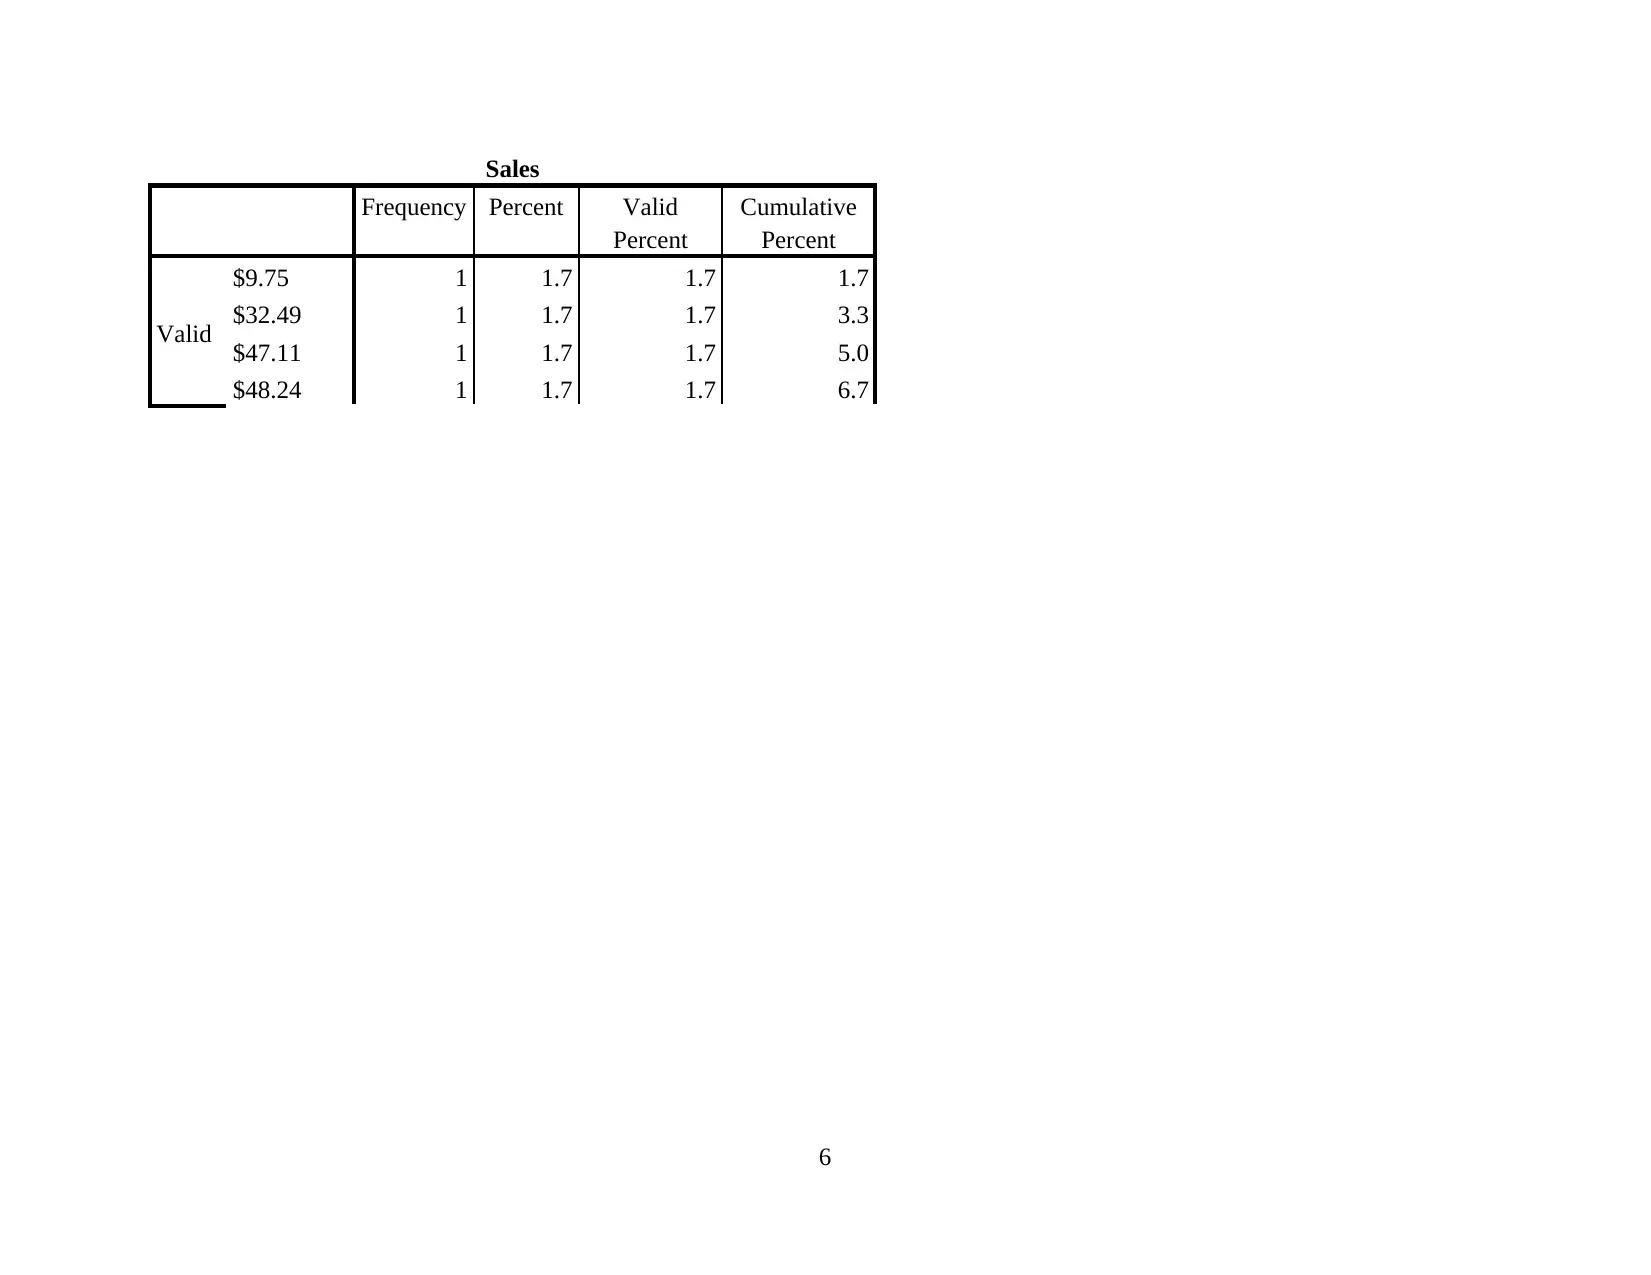
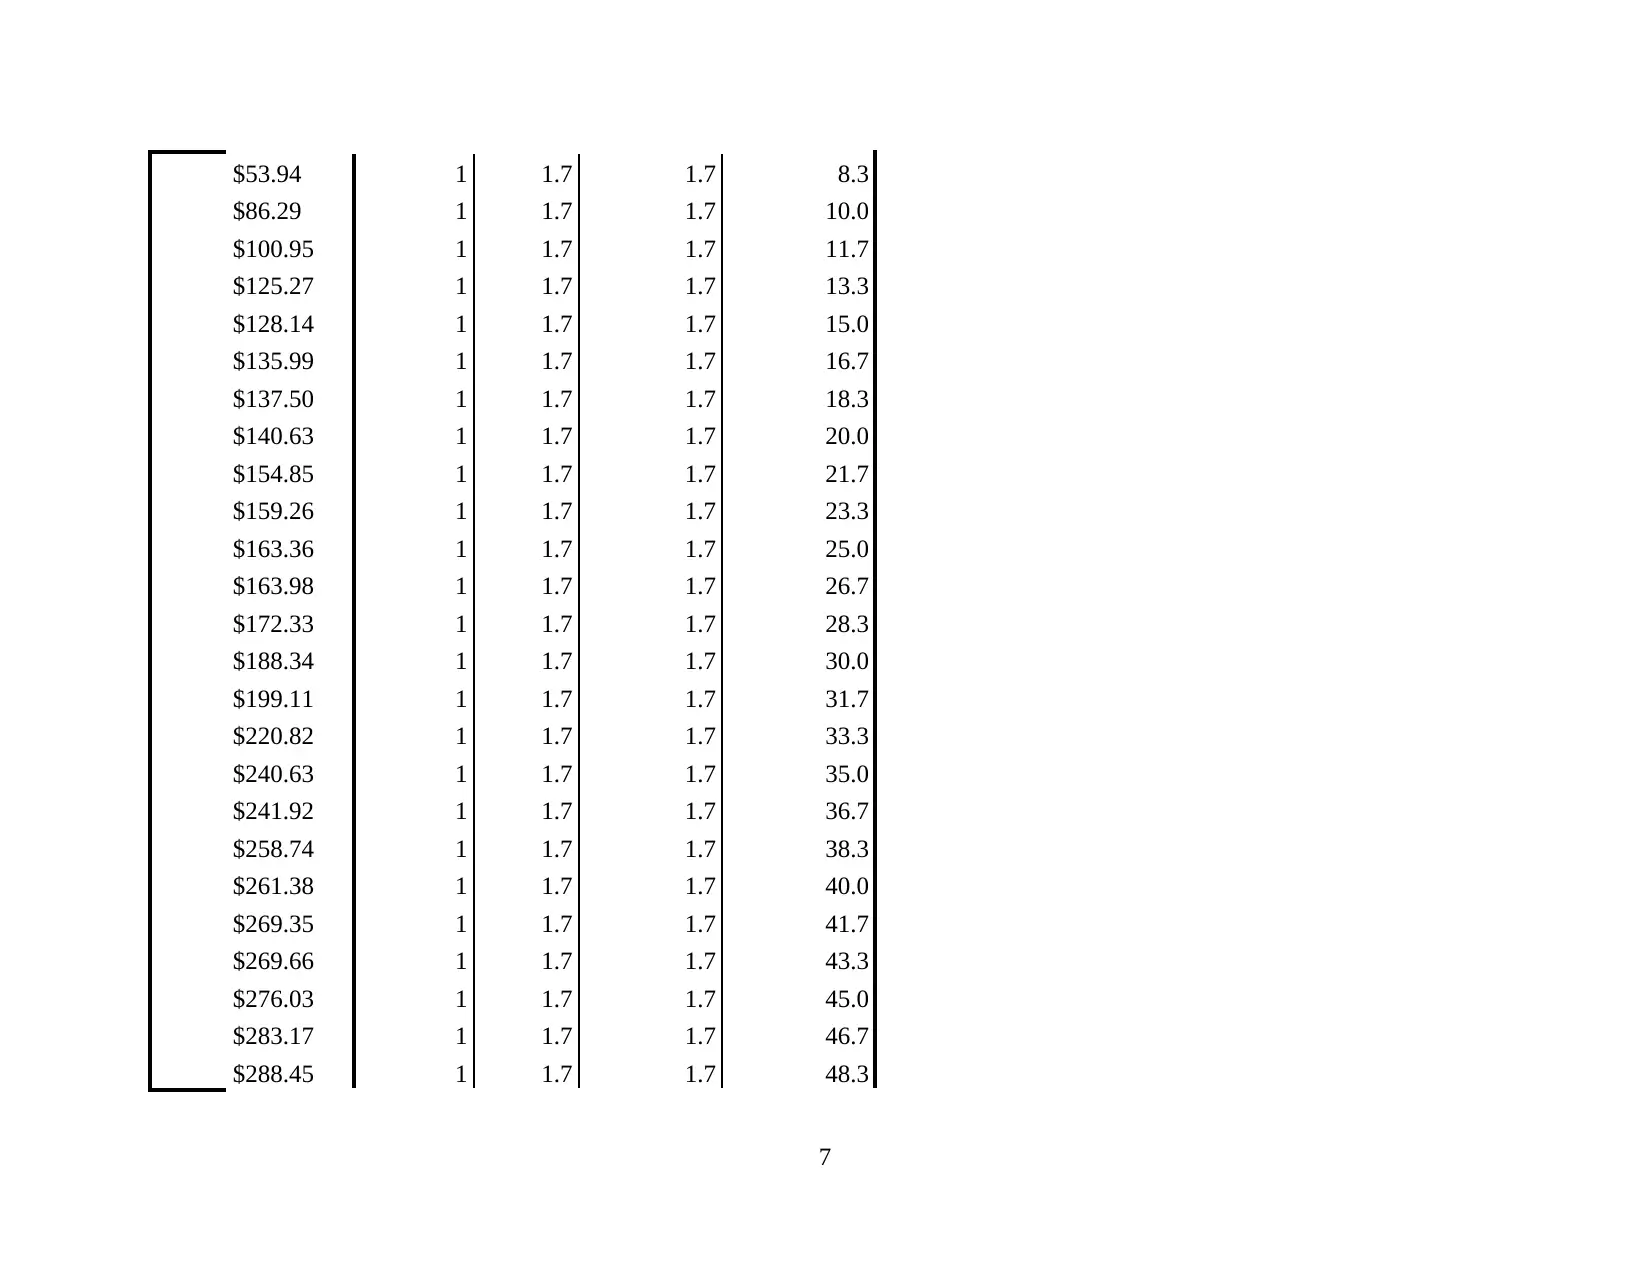
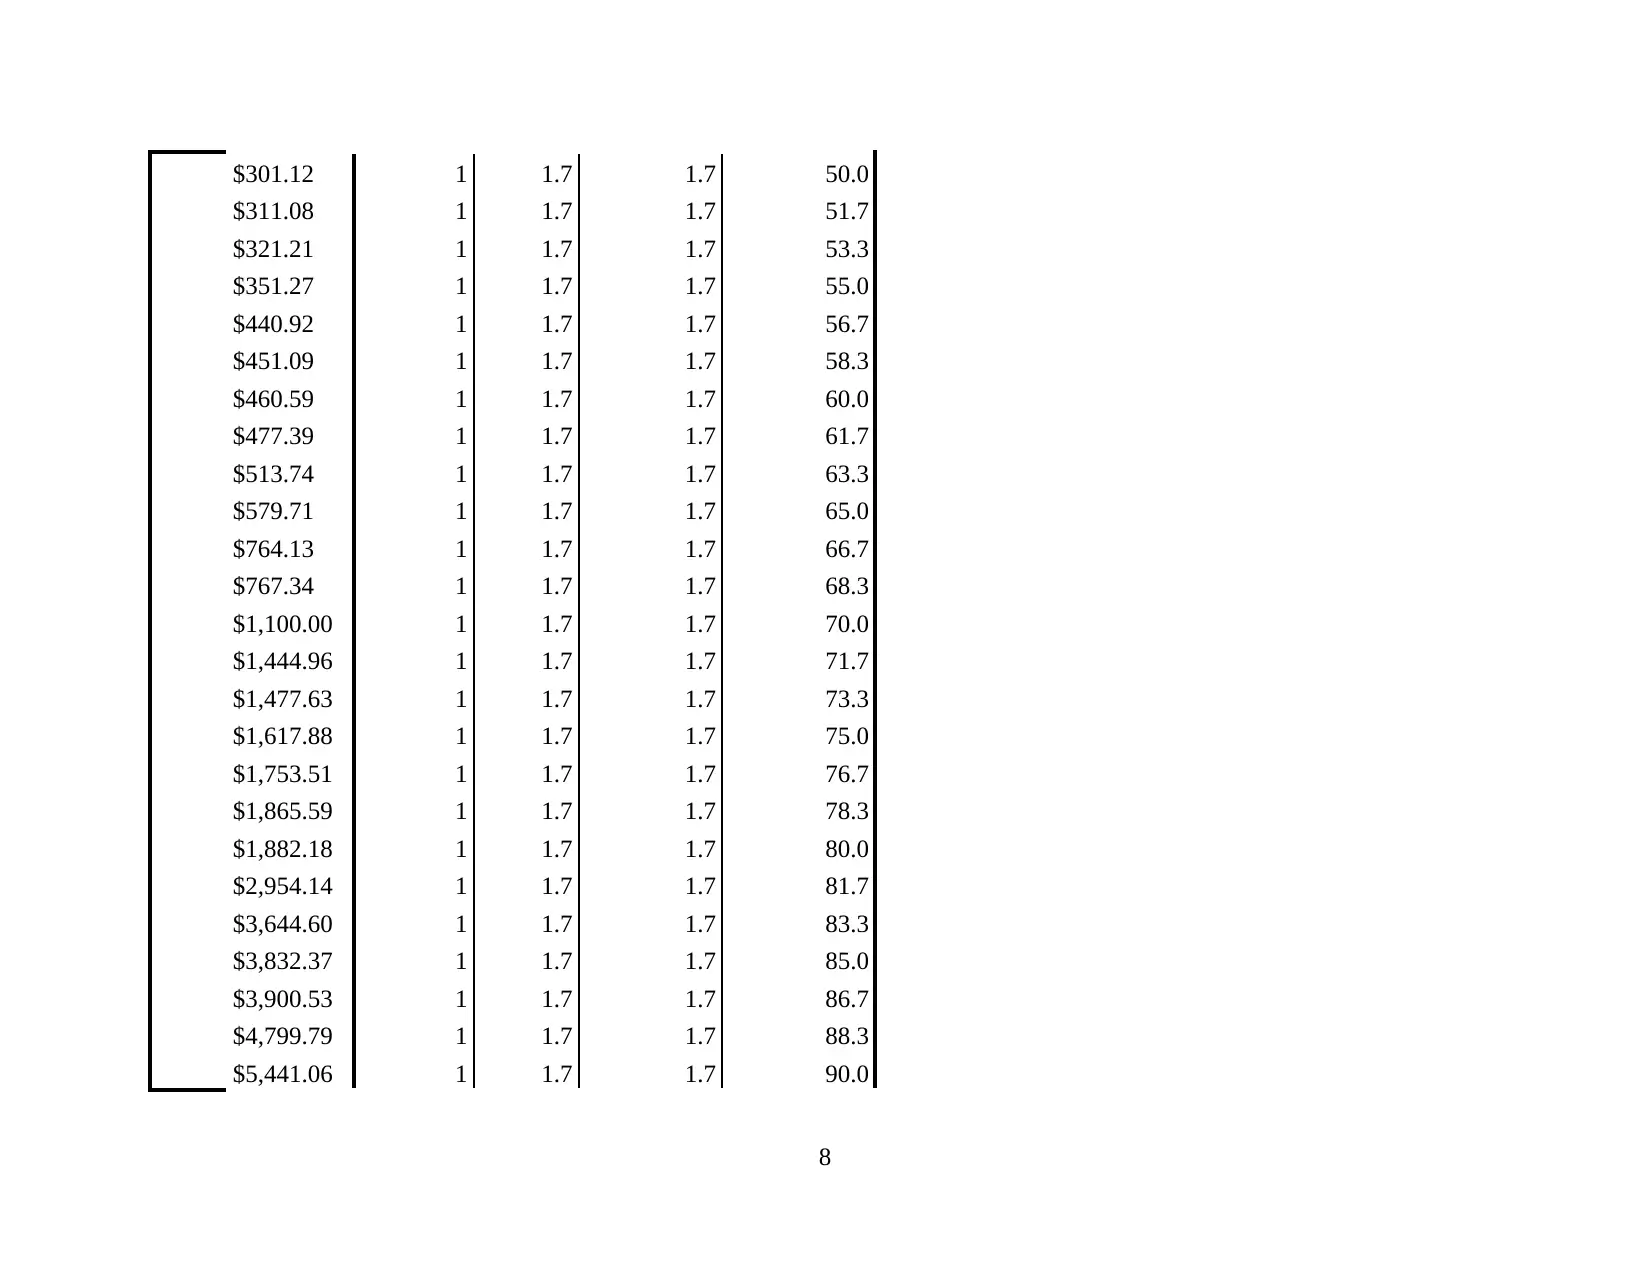
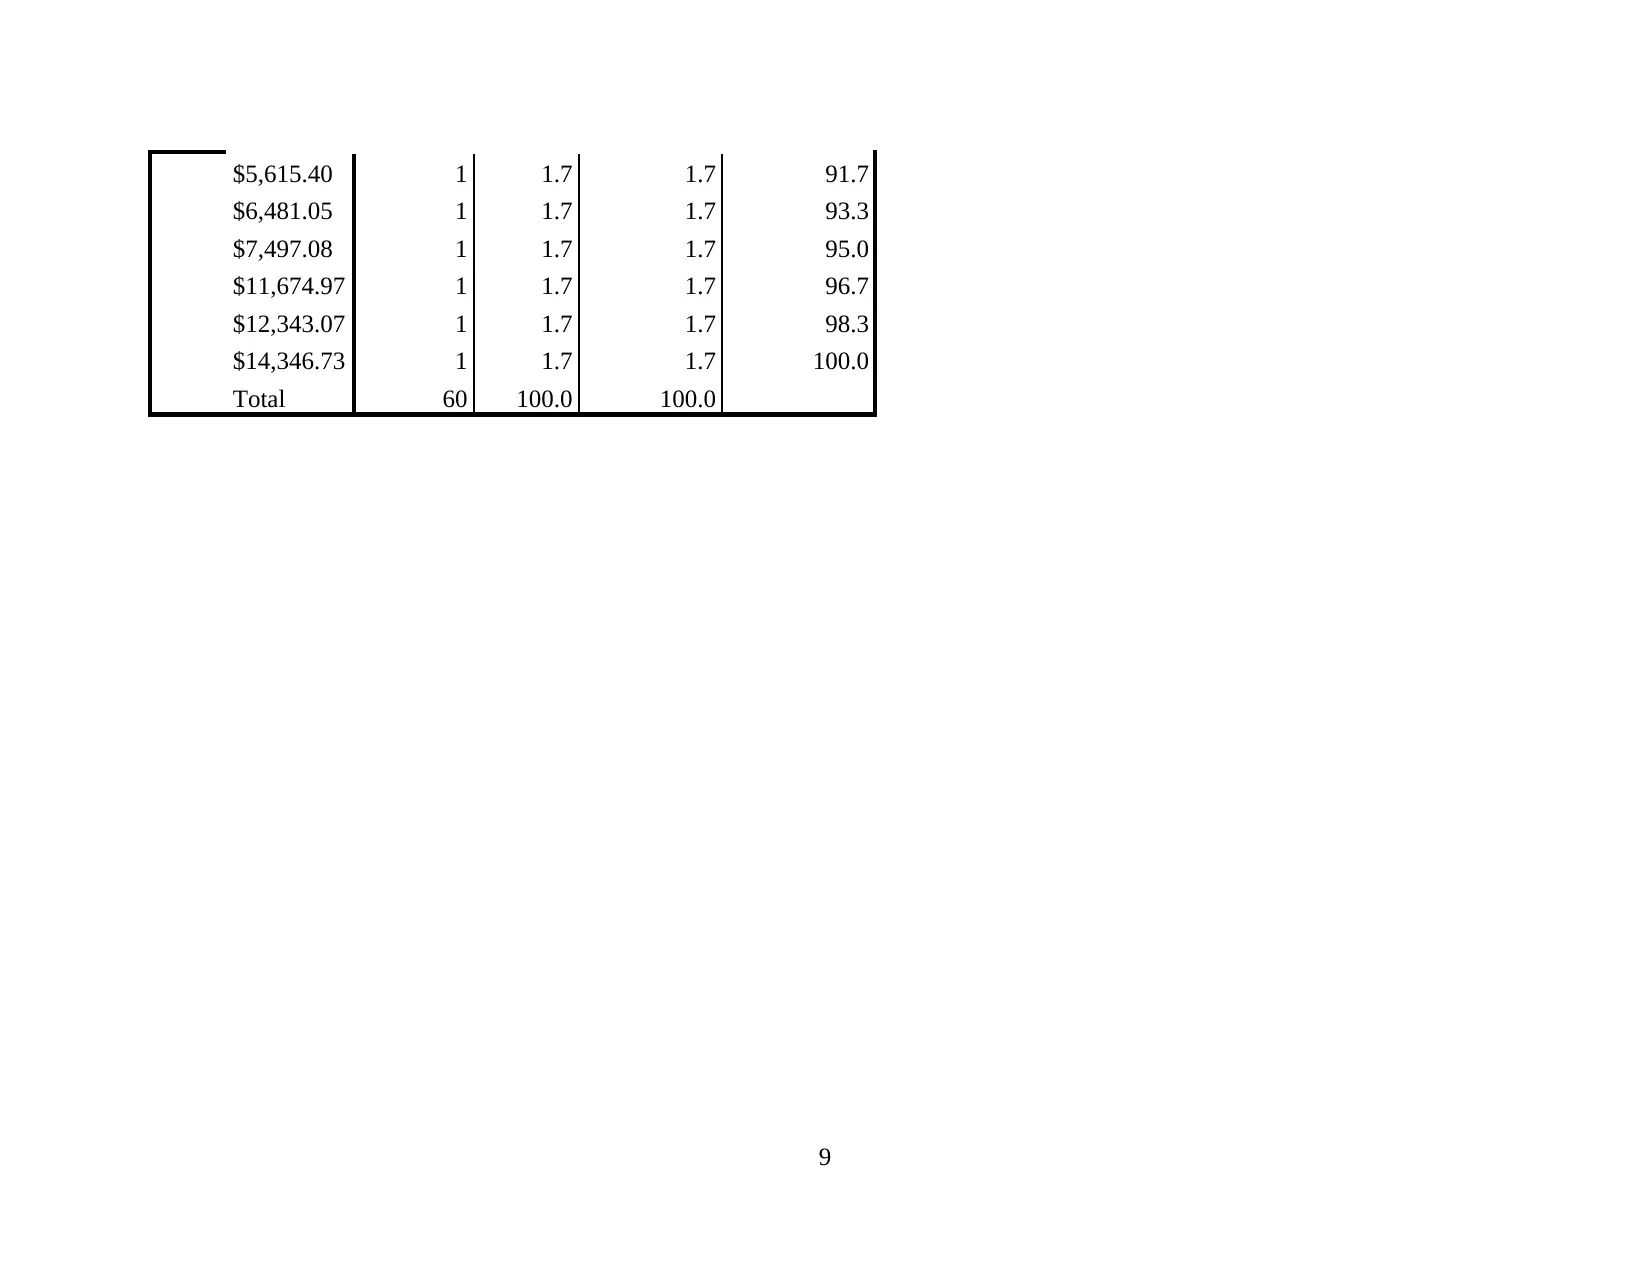
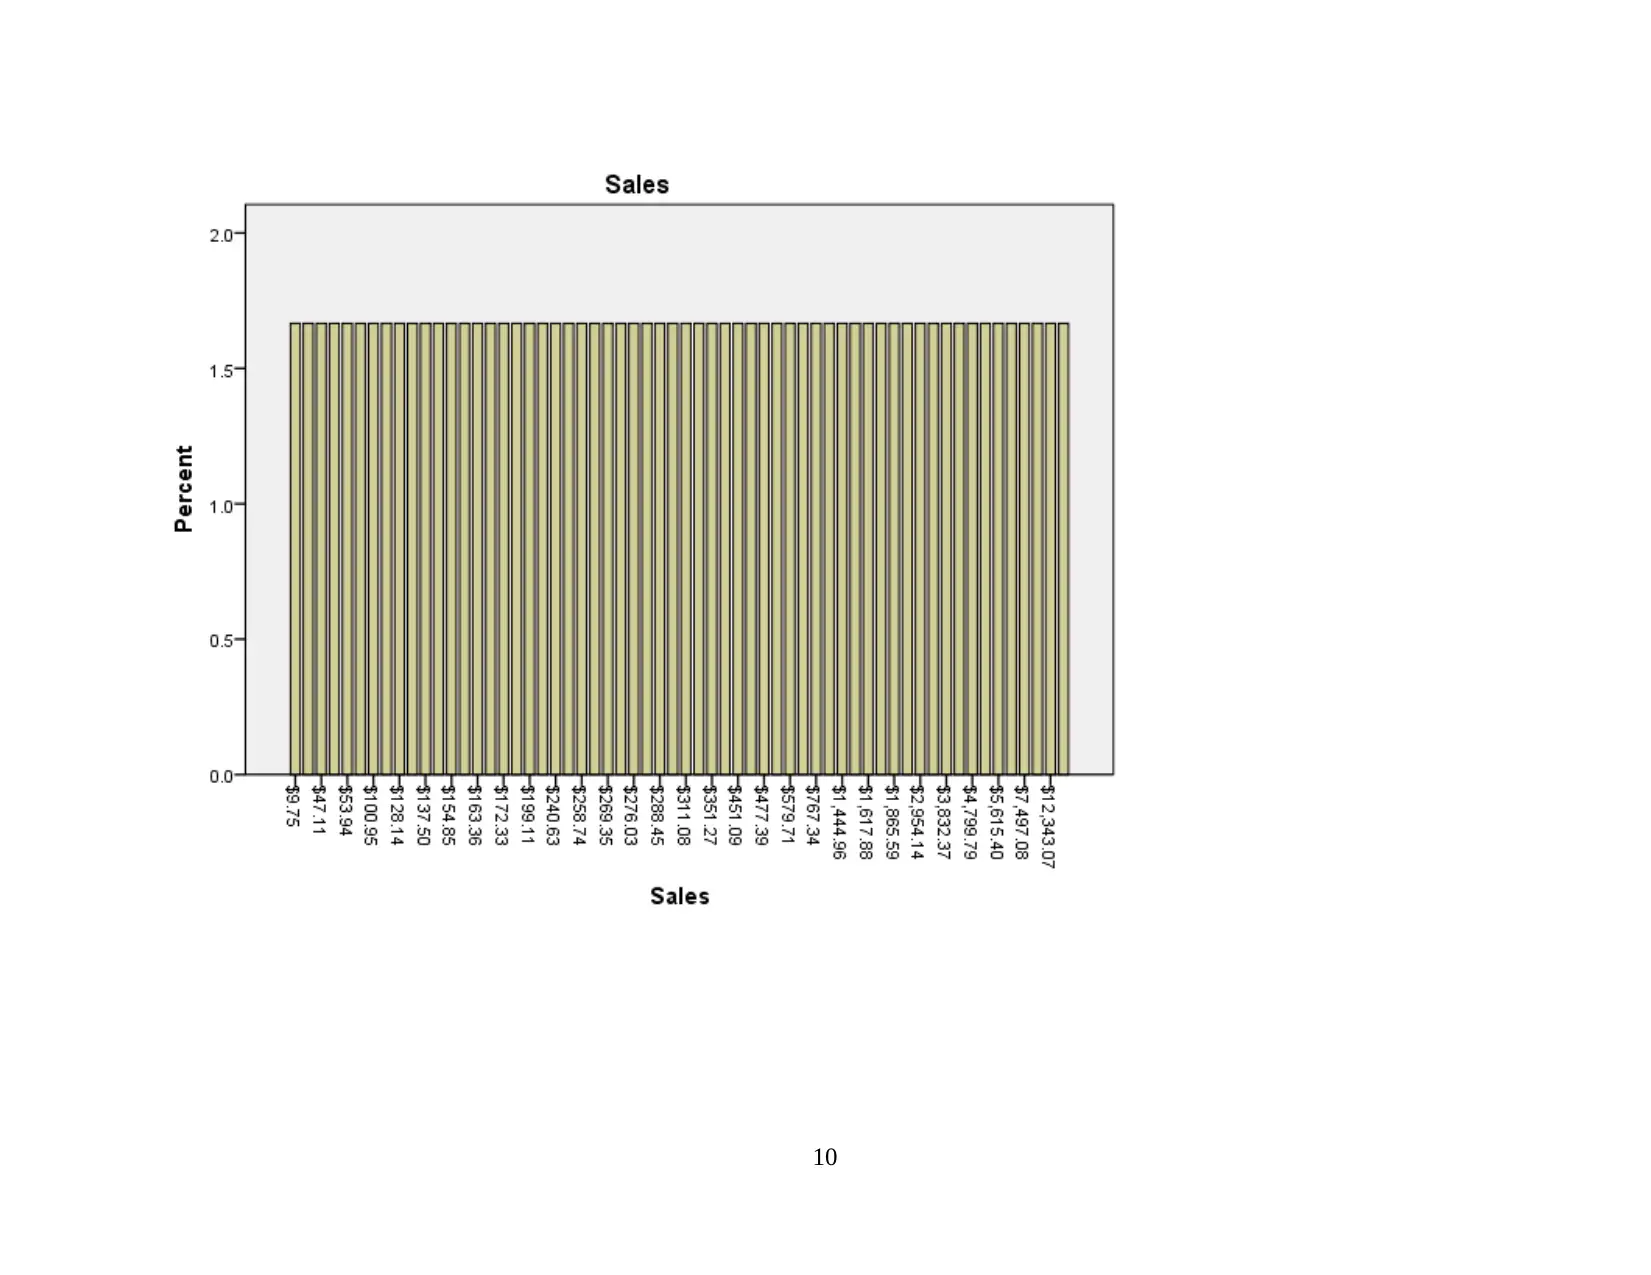
This statistics project presents a comprehensive analysis of sales and order quantity data. The project begins with the selection of a random sample and progresses through various statistical analyses, including the creation of frequency tables, calculation of summary statistics, and graphical presentations. The project delves into an analysis of average sales for home office customers and the relationship between shipping costs and sample variables. Hypothesis testing is conducted, and correlation and regression analyses are performed to explore the relationship between sales and order quantity. The project culminates in a conclusion that synthesizes the findings and provides references to support the analysis. The project utilizes statistical tools to determine facts, create hypotheses, and derive valid outcomes, offering insights into the dynamics of sales and order quantities.
Document Page
STATISTIC PROJECT
tabler-icon-diamond-filled.svg

Paraphrase This Document

Need a fresh take? Get an instant paraphrase of this document with our AI Paraphraser
Document Page
TABLE OF CONTENTS
TASK 1............................................................................................................................................1
Selection of a random sample of size 60................................................................................1
TASK 2............................................................................................................................................3
1. Frequency table in percentage and graph...........................................................................3
2. Summary statistics..............................................................................................................9
Graphical presentation..........................................................................................................11
TASK 3..........................................................................................................................................14
Analysing the Average sales for Home office customers....................................................14
Shipping cost and all sample variables.................................................................................15
TASK 4..........................................................................................................................................18
Hypothesis test......................................................................................................................18
TASK 5..........................................................................................................................................19
Correlation and Regression analysis on sales and order quantity........................................19
TASK 6..........................................................................................................................................23
Conclusion............................................................................................................................23
REFERENCES..............................................................................................................................24
Document Page
TASK 1
Selection of a Random Sample of size 60
Order
ID
Order
Priority
Order
Quantity Sales Ship Mode
Shipping
Cost Region
Customer
Segment Days to ship
52929 3 19 $53.94 1 $1.25 1 4 1
40964 4 40 $301.12 1 $8.37 2 1 3
32198 2 31 $240.63 1 $5.53 2 3 0
6433 2 41 $159.26 1 $0.50 2 2 1
30626 4 23 $220.82 3 $1.09 2 1 1
40134 1 1 $9.75 1 $4.72 1 4 5
15205 4 42 $1,753.51 1 $9.20 1 1 1
34660 0 36 $3,832.37 1 $5.81 1 2 2
31556 4 35 $269.35 1 $3.68 1 3 1
12323 0 32 $513.74 1 $10.13 2 1 1
20486 3 42 $163.98 1 $0.70 2 1 1
45248 2 38 $154.85 1 $5.13 2 1 2
326 3 17 $100.95 1 $3.37 2 3 1
57799 3 25 $12,343.07 2 $69.30 1 3 2
5347 2 39 $276.03 1 $5.03 1 1 3
29318 0 21 $2,954.14 3 $35.00 2 1 1
42081 1 36 $188.34 1 $5.74 2 4 5
16805 1 26 $172.33 1 $5.74 1 1 2
54882 4 17 $86.29 1 $0.49 2 3 3
10210 0 10 $767.34 1 $14.52 1 1 1
54215 3 14 $321.21 1 $1.99 1 4 2
12293 3 31 $283.17 1 $1.39 2 2 1
51200 2 29 $1,617.88 1 $5.50 1 4 3
27904 3 8 $460.59 1 $8.99 1 3 1
1
Document Page
32580 3 38 $261.38 1 $8.74 2 1 2
53443 4 35 $1,477.63 1 $4.62 1 3 1
51008 3 20 $269.66 1 $4.59 2 3 2
57350 3 33 $140.63 1 $5.68 1 4 1
56577 4 30 $7,497.08 2 $54.12 2 4 1
50854 4 27 $137.50 1 $4.95 2 1 0
18688 0 49 $14,346.73 1 $19.99 1 2 2
40643 4 23 $258.74 1 $5.72 2 2 2
23558 1 17 $579.71 2 $45.51 2 2 5
49479 2 46 $5,615.40 2 $26.30 2 3 2
37891 3 24 $163.36 1 $6.60 2 4 2
6432 4 30 $311.08 1 $4.50 2 1 2
42788 4 26 $241.92 1 $2.27 1 4 2
42081 1 3 $32.49 1 $1.39 2 4 2
22149 1 17 $48.24 1 $1.01 2 4 5
15622 3 21 $135.99 1 $9.68 1 3 1
15428 4 50 $1,444.96 3 $4.00 1 4 1
11815 1 22 $351.27 1 $7.42 2 3 2
58755 1 18 $47.11 1 $7.09 1 2 9
52930 1 40 $1,865.59 1 $1.25 2 1 0
49312 4 19 $1,882.18 3 $5.81 2 1 2
31046 4 42 $3,900.53 1 $2.50 2 1 1
38950 0 30 $288.45 1 $3.98 2 4 3
21542 3 43 $11,674.97 2 $84.84 2 1 1
53637 3 12 $451.09 3 $9.83 2 3 1
48837 0 39 $4,799.79 1 $3.90 2 1 2
56387 2 32 $128.14 3 $7.01 1 4 2
42370 3 33 $125.27 1 $4.83 1 2 2
25028 4 5 $477.39 2 $55.81 1 2 1
25318 4 22 $440.92 3 $10.49 1 4 2
6304 3 30 $199.11 1 $6.65 1 1 2
2
tabler-icon-diamond-filled.svg

Paraphrase This Document

Need a fresh take? Get an instant paraphrase of this document with our AI Paraphraser
Document Page
21414 4 46 $3,644.60 1 $35.00 2 3 2
41987 0 25 $6,481.05 2 $29.20 1 1 1
47015 0 19 $5,441.06 2 $61.76 1 1 1
32069 0 8 $1,100.00 2 $17.85 2 3 0
52642 1 15 $764.13 1 $4.86 2 2 7
TASK 2
1. Frequency Table in percentage and graph
Statistics
Order
Priority
Sales
N Valid 60 60
Missing 0 0
Mean 2.33 $1,737.8300
Std. Error of Mean .190 $401.20189
Median 3.00 $306.1000
Mode 4 $9.75a
Std. Deviation 1.469 $3,107.6964
5
Variance 2.158 9657777.195
Skewness -.374 2.631
Std. Error of
Skewness .309 .309
Kurtosis -1.296 6.911
Std. Error of Kurtosis .608 .608
Range 4 $14,336.98
Percentiles 25 1.00 $163.5150
3
Document Page
50 3.00 $306.1000
75 4.00 $1,719.6025
a. Multiple modes exist. The smallest value is
shown
Frequency Table
Order Priority
Frequency Percent Valid Percent Cumulative
Percent
Valid
0 10 16.7 16.7 16.7
1 10 16.7 16.7 33.3
2 7 11.7 11.7 45.0
3 16 26.7 26.7 71.7
4 17 28.3 28.3 100.0
Total 60 100.0 100.0
4
Document Page
5
tabler-icon-diamond-filled.svg

Paraphrase This Document

Need a fresh take? Get an instant paraphrase of this document with our AI Paraphraser
Document Page
Sales
Frequency Percent Valid
Percent
Cumulative
Percent
Valid
$9.75 1 1.7 1.7 1.7
$32.49 1 1.7 1.7 3.3
$47.11 1 1.7 1.7 5.0
$48.24 1 1.7 1.7 6.7
6
Document Page
$53.94 1 1.7 1.7 8.3
$86.29 1 1.7 1.7 10.0
$100.95 1 1.7 1.7 11.7
$125.27 1 1.7 1.7 13.3
$128.14 1 1.7 1.7 15.0
$135.99 1 1.7 1.7 16.7
$137.50 1 1.7 1.7 18.3
$140.63 1 1.7 1.7 20.0
$154.85 1 1.7 1.7 21.7
$159.26 1 1.7 1.7 23.3
$163.36 1 1.7 1.7 25.0
$163.98 1 1.7 1.7 26.7
$172.33 1 1.7 1.7 28.3
$188.34 1 1.7 1.7 30.0
$199.11 1 1.7 1.7 31.7
$220.82 1 1.7 1.7 33.3
$240.63 1 1.7 1.7 35.0
$241.92 1 1.7 1.7 36.7
$258.74 1 1.7 1.7 38.3
$261.38 1 1.7 1.7 40.0
$269.35 1 1.7 1.7 41.7
$269.66 1 1.7 1.7 43.3
$276.03 1 1.7 1.7 45.0
$283.17 1 1.7 1.7 46.7
$288.45 1 1.7 1.7 48.3
7
Document Page
$301.12 1 1.7 1.7 50.0
$311.08 1 1.7 1.7 51.7
$321.21 1 1.7 1.7 53.3
$351.27 1 1.7 1.7 55.0
$440.92 1 1.7 1.7 56.7
$451.09 1 1.7 1.7 58.3
$460.59 1 1.7 1.7 60.0
$477.39 1 1.7 1.7 61.7
$513.74 1 1.7 1.7 63.3
$579.71 1 1.7 1.7 65.0
$764.13 1 1.7 1.7 66.7
$767.34 1 1.7 1.7 68.3
$1,100.00 1 1.7 1.7 70.0
$1,444.96 1 1.7 1.7 71.7
$1,477.63 1 1.7 1.7 73.3
$1,617.88 1 1.7 1.7 75.0
$1,753.51 1 1.7 1.7 76.7
$1,865.59 1 1.7 1.7 78.3
$1,882.18 1 1.7 1.7 80.0
$2,954.14 1 1.7 1.7 81.7
$3,644.60 1 1.7 1.7 83.3
$3,832.37 1 1.7 1.7 85.0
$3,900.53 1 1.7 1.7 86.7
$4,799.79 1 1.7 1.7 88.3
$5,441.06 1 1.7 1.7 90.0
8
tabler-icon-diamond-filled.svg

Paraphrase This Document

Need a fresh take? Get an instant paraphrase of this document with our AI Paraphraser
Document Page
$5,615.40 1 1.7 1.7 91.7
$6,481.05 1 1.7 1.7 93.3
$7,497.08 1 1.7 1.7 95.0
$11,674.97 1 1.7 1.7 96.7
$12,343.07 1 1.7 1.7 98.3
$14,346.73 1 1.7 1.7 100.0
Total 60 100.0 100.0
9
Document Page
10
chevron_up_icon
1 out of 27
circle_padding
hide_on_mobile
zoom_out_icon
[object Object]