Comprehensive Statistical Analysis Report: Sampling, Salary, and Data
VerifiedAdded on  2021/02/22
|19
|2632
|73
Report
AI Summary
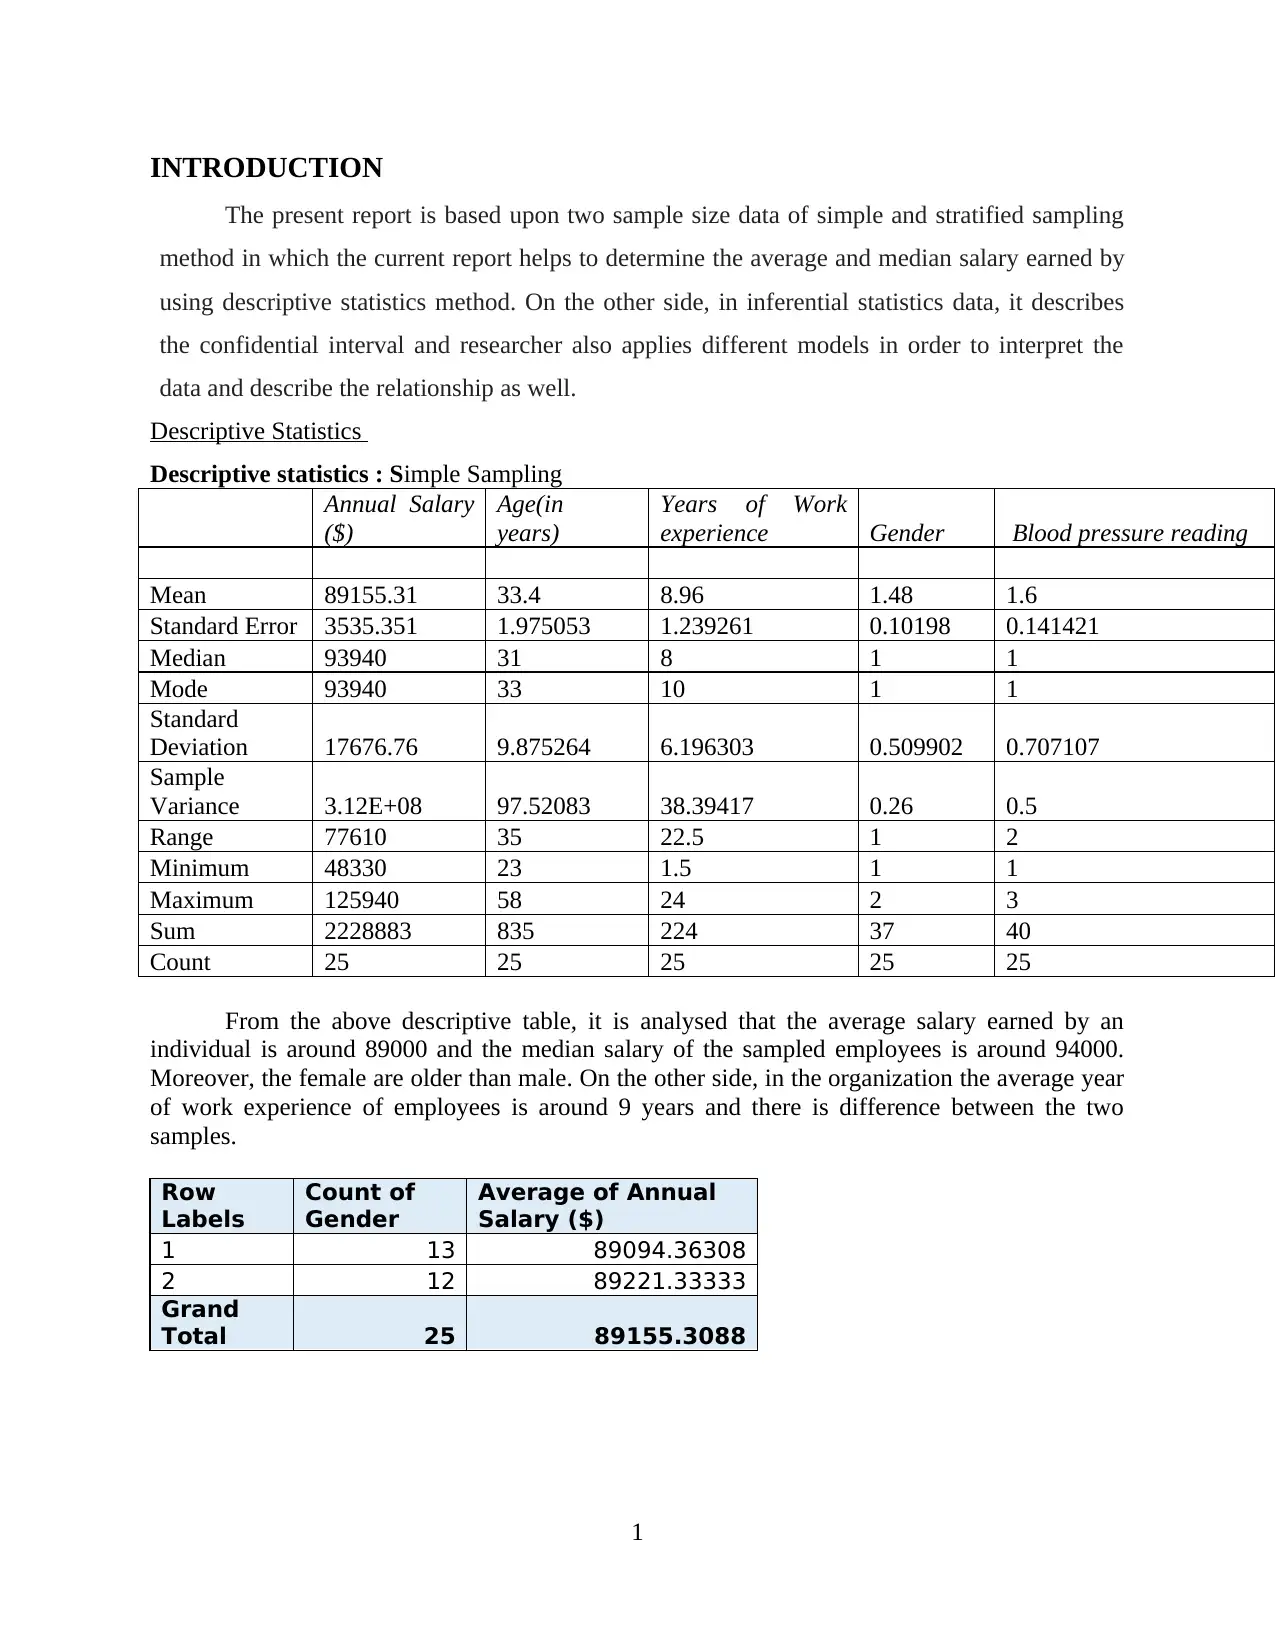
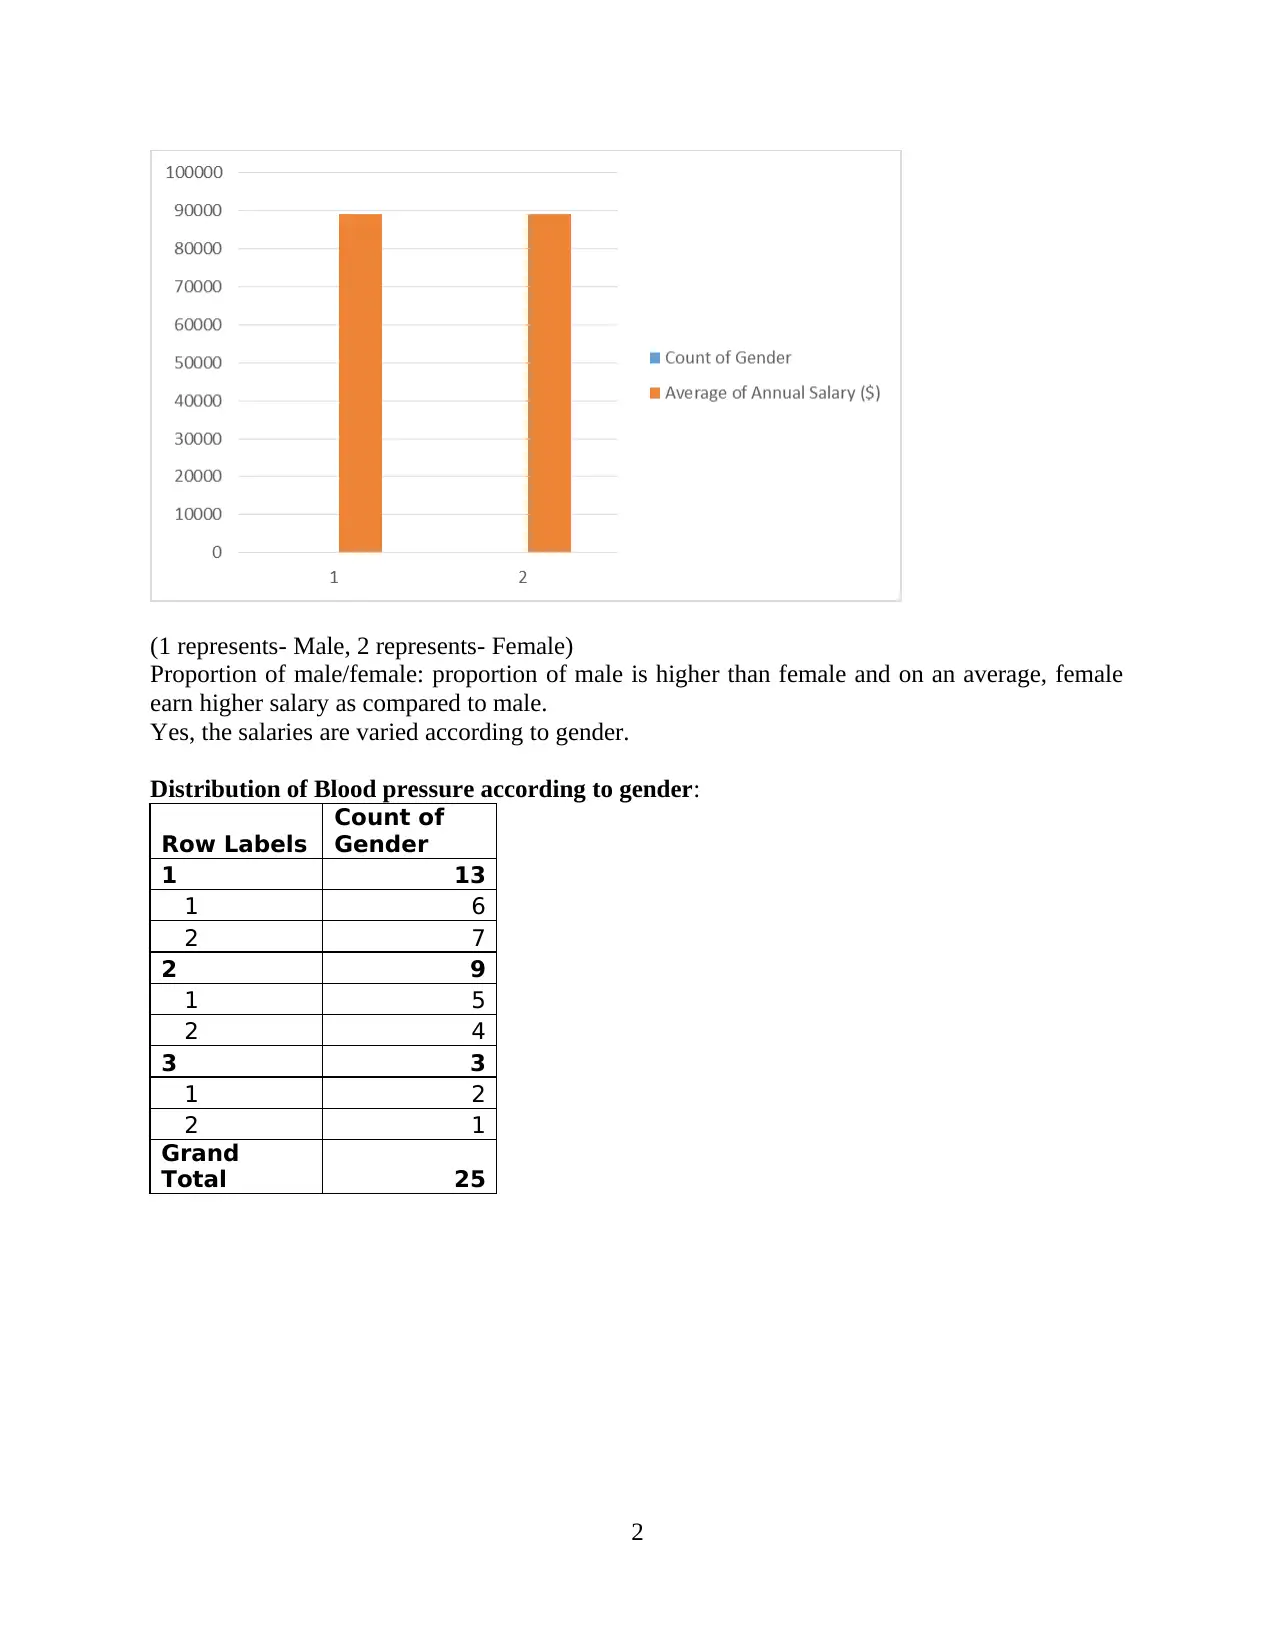
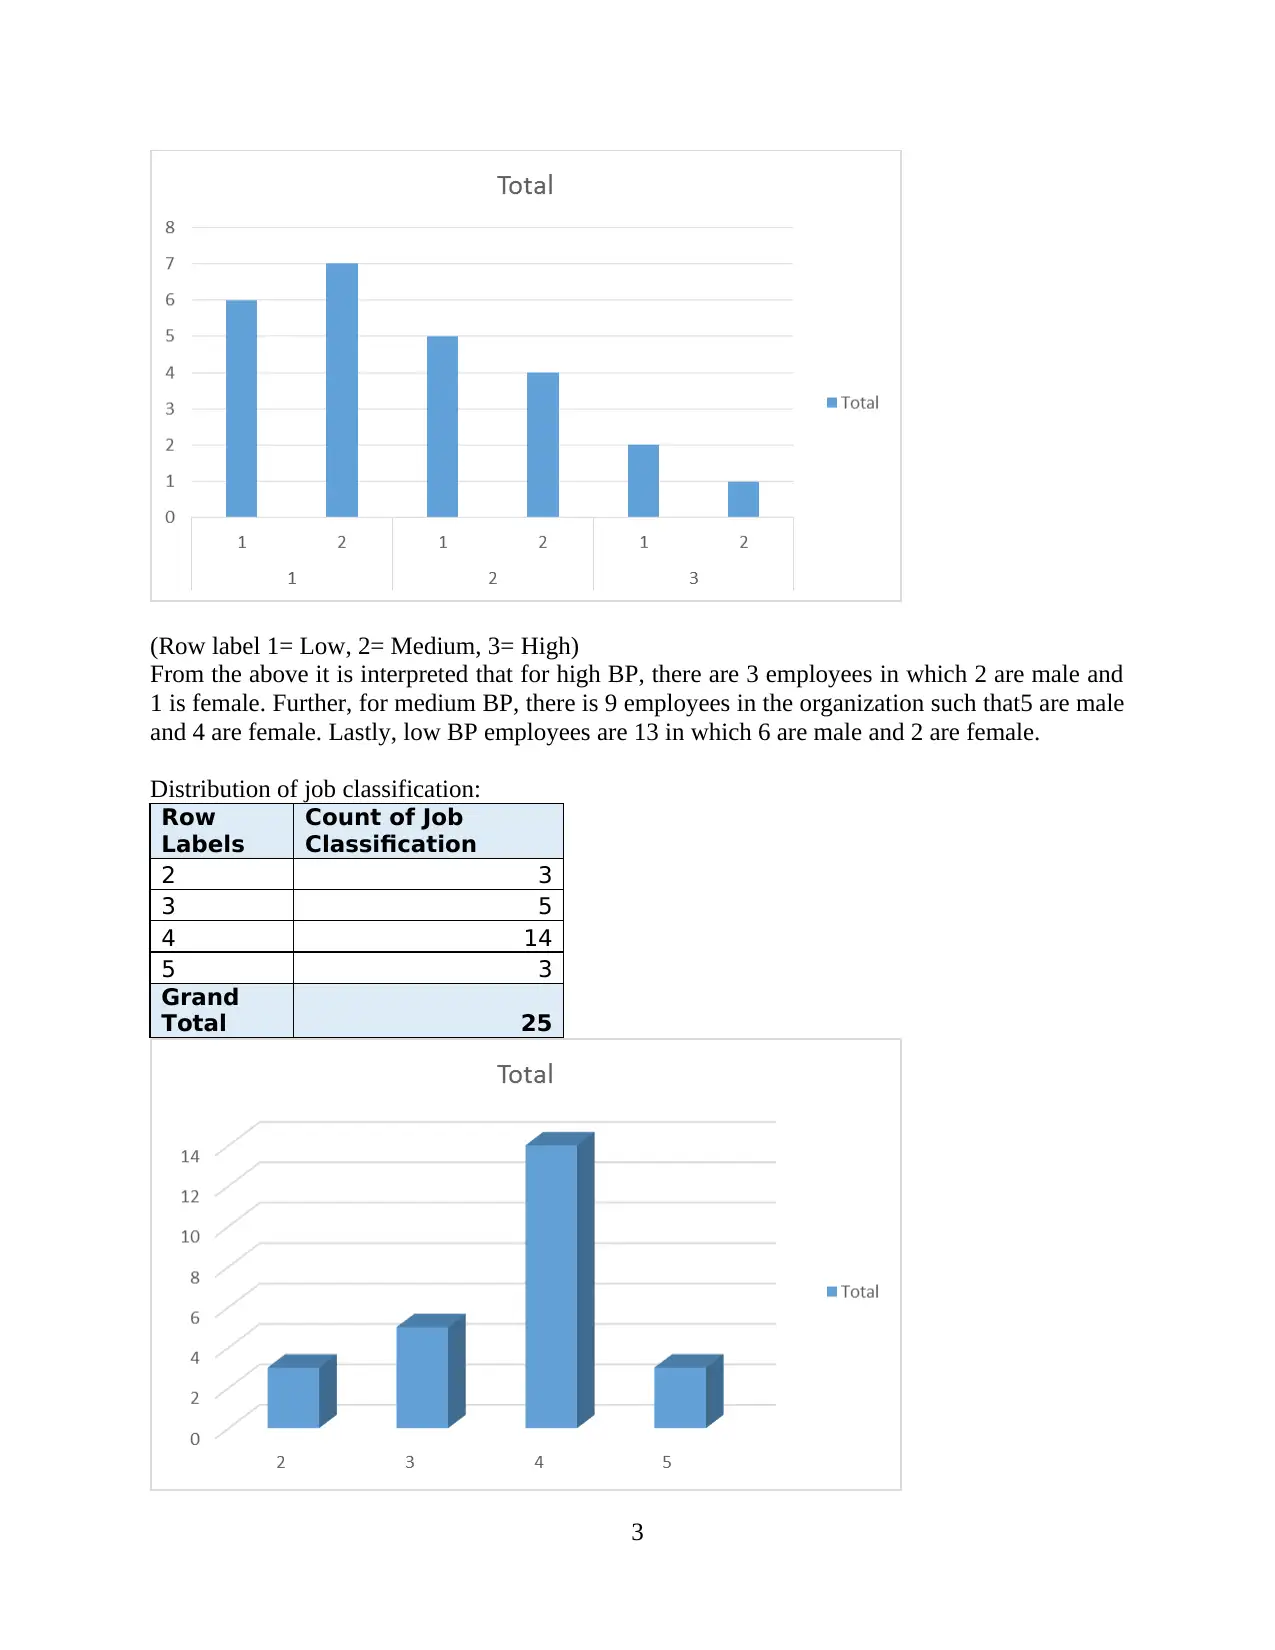
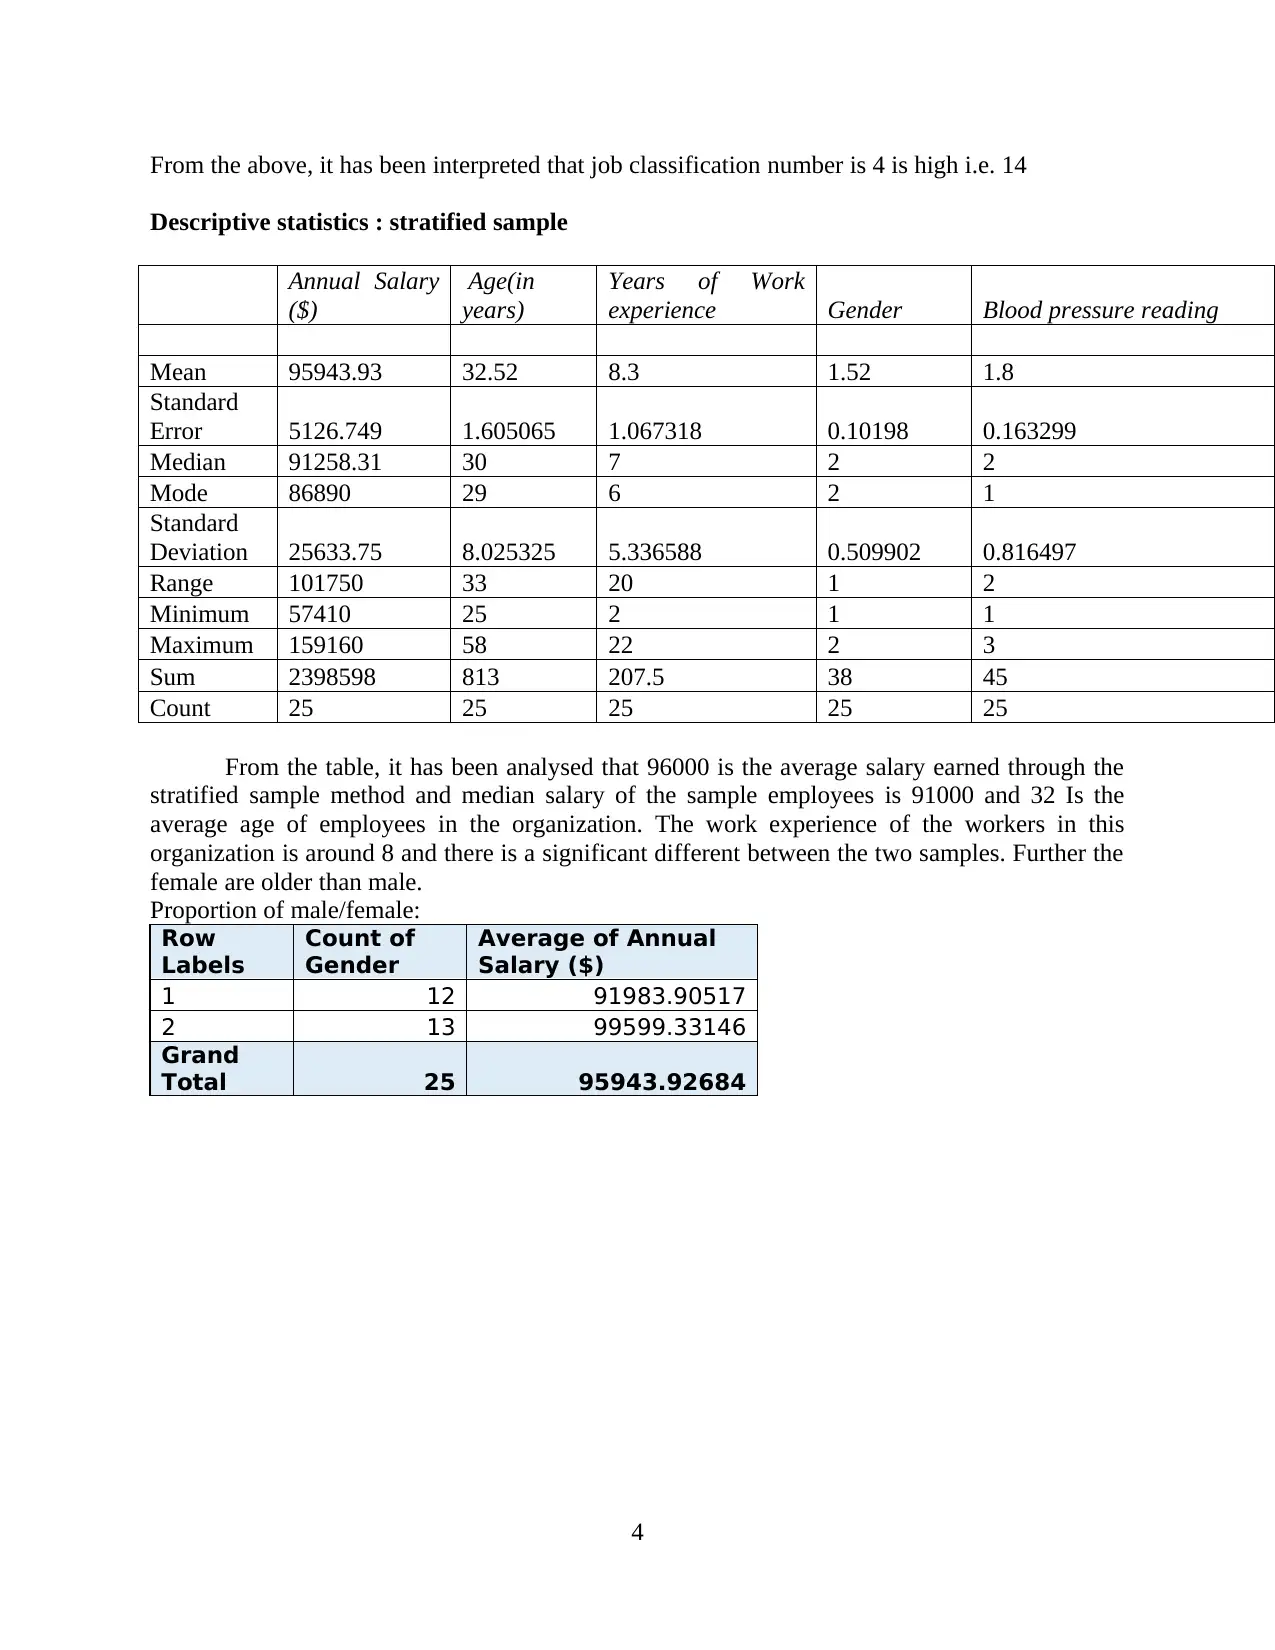
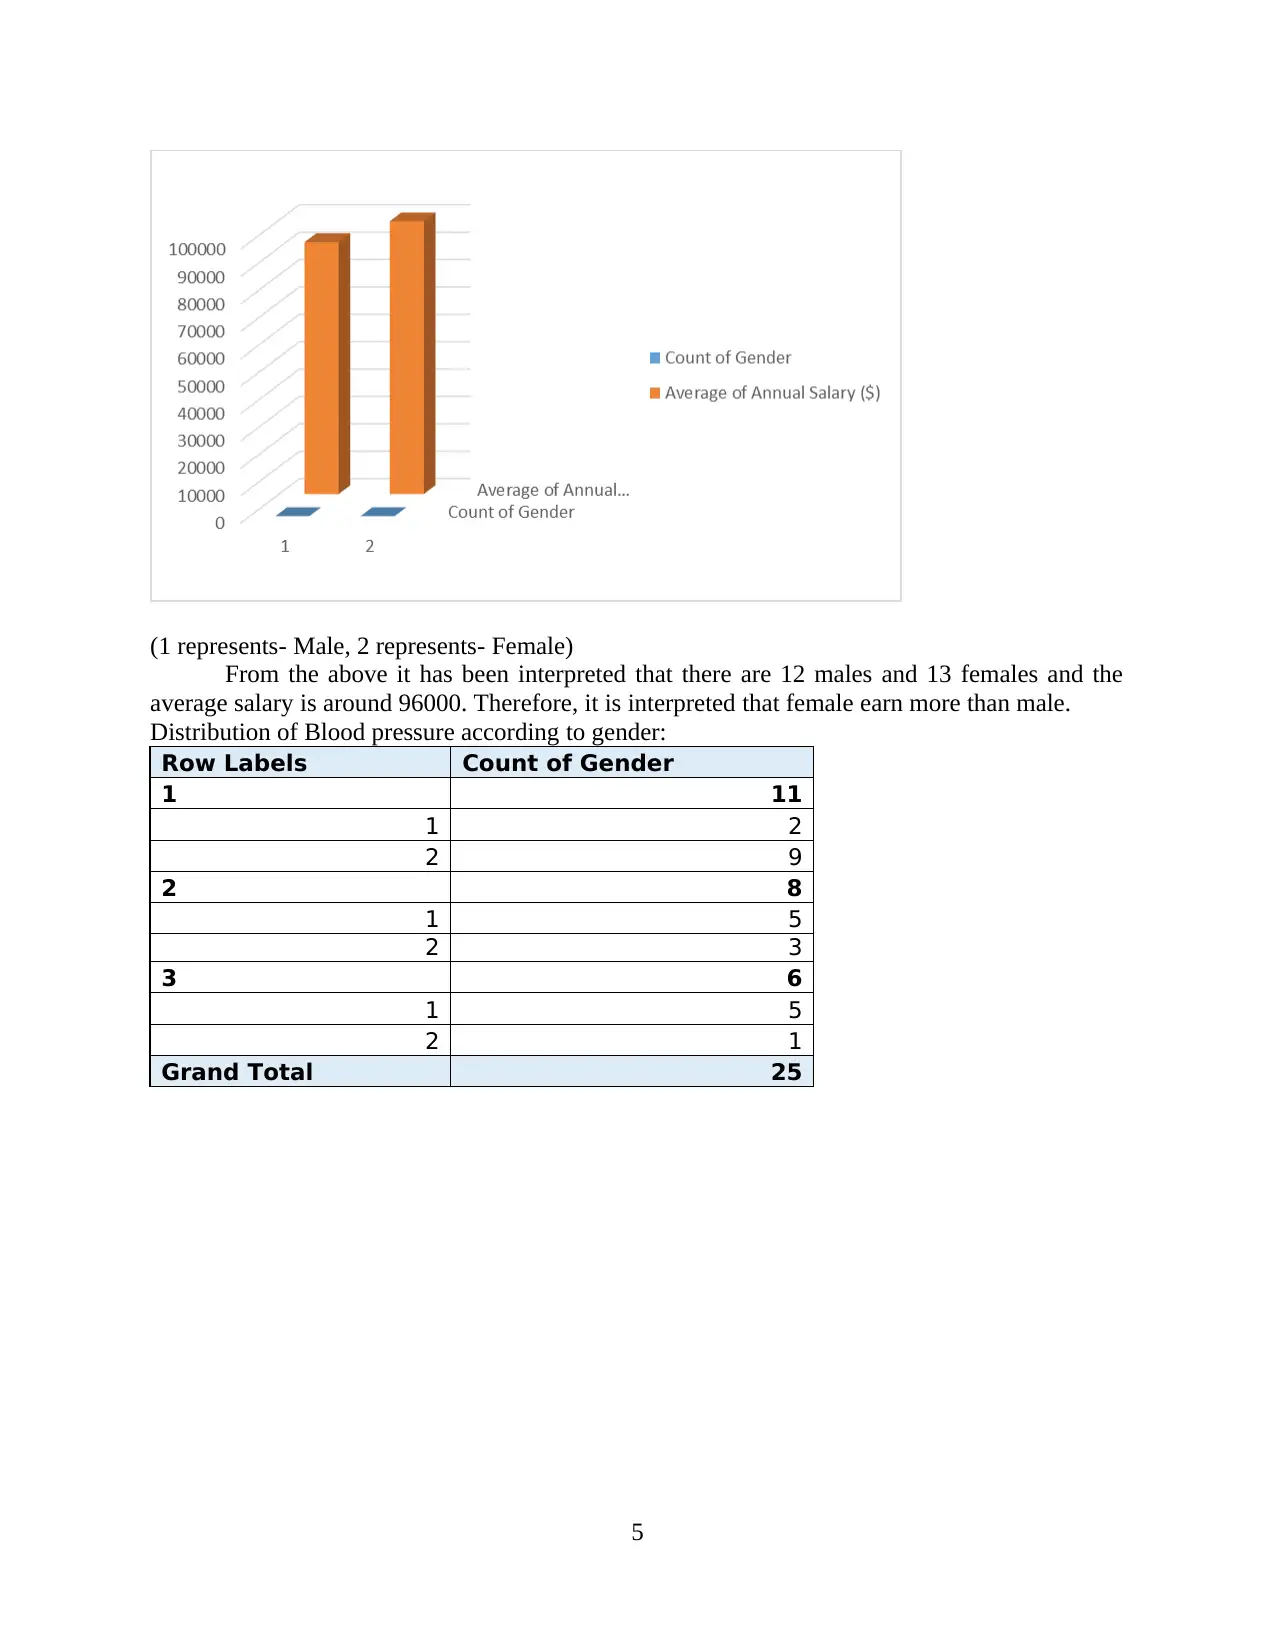
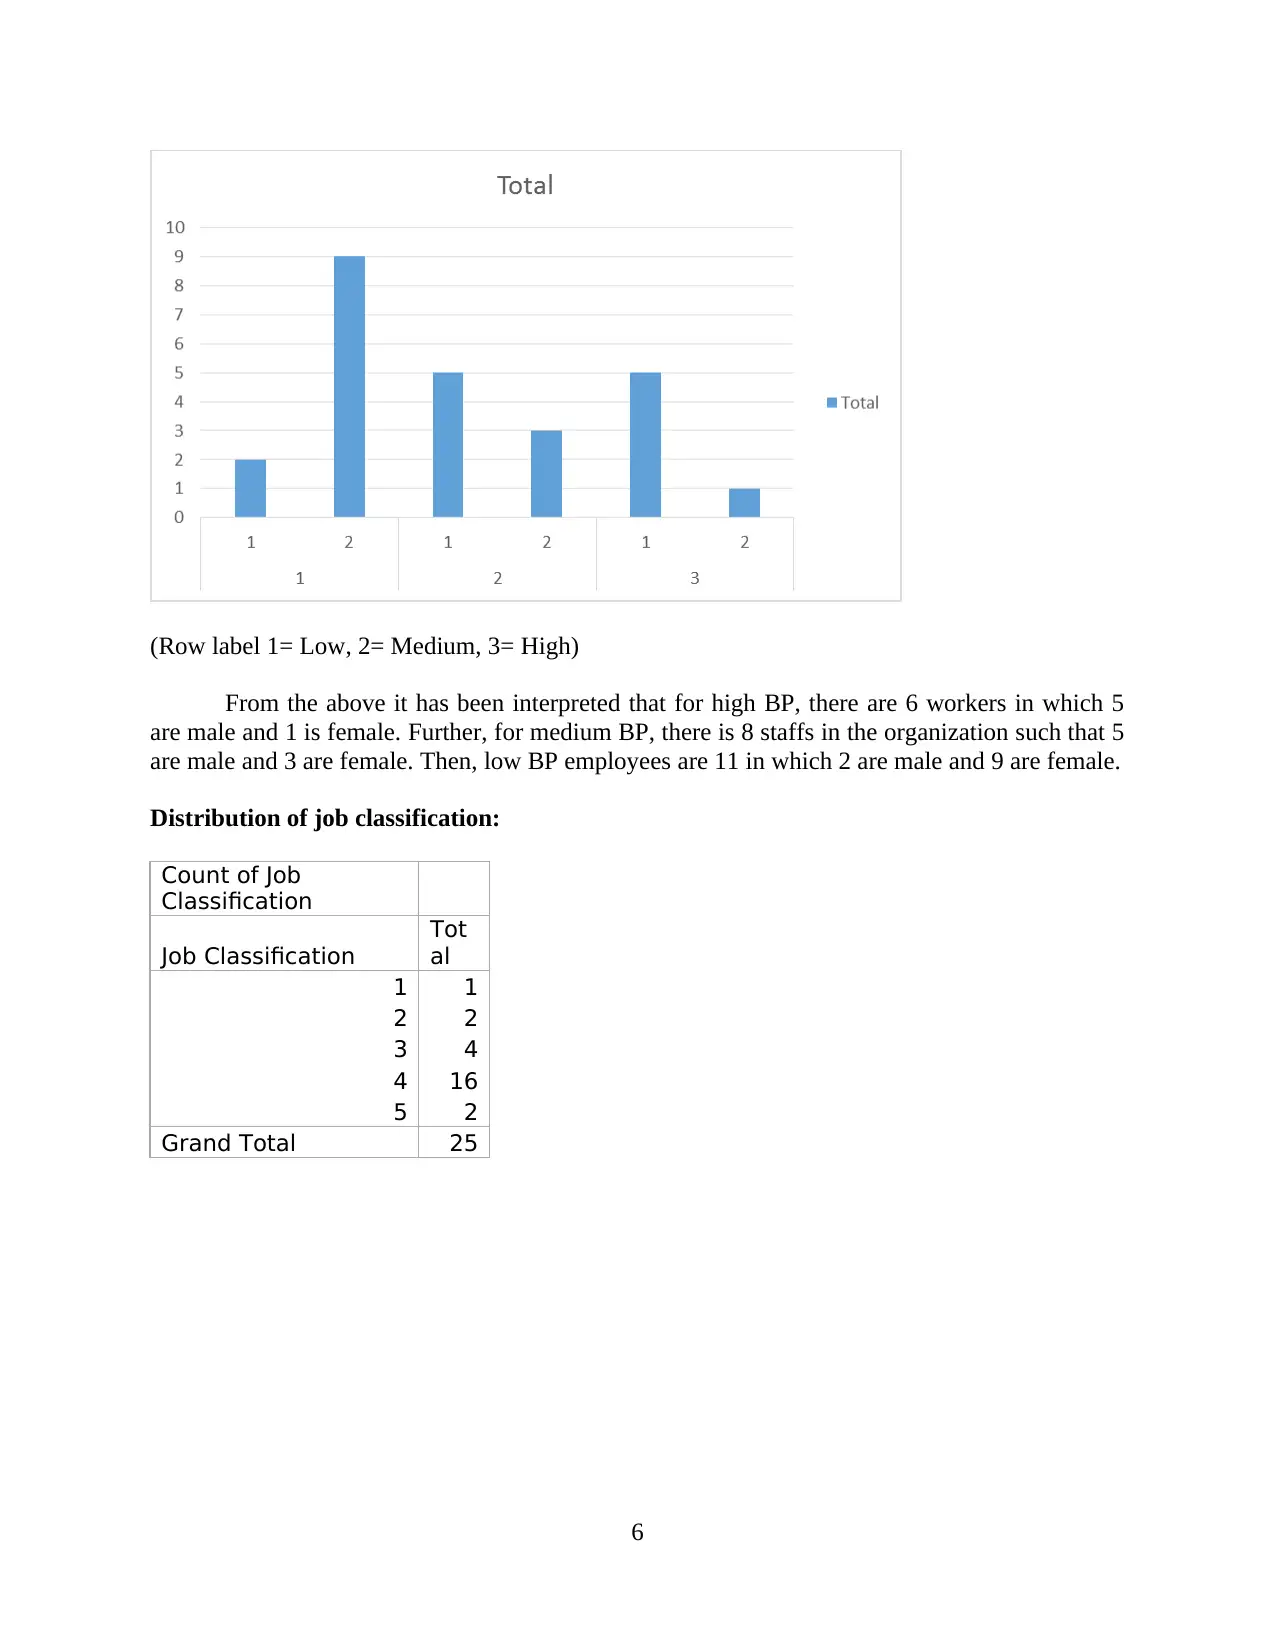
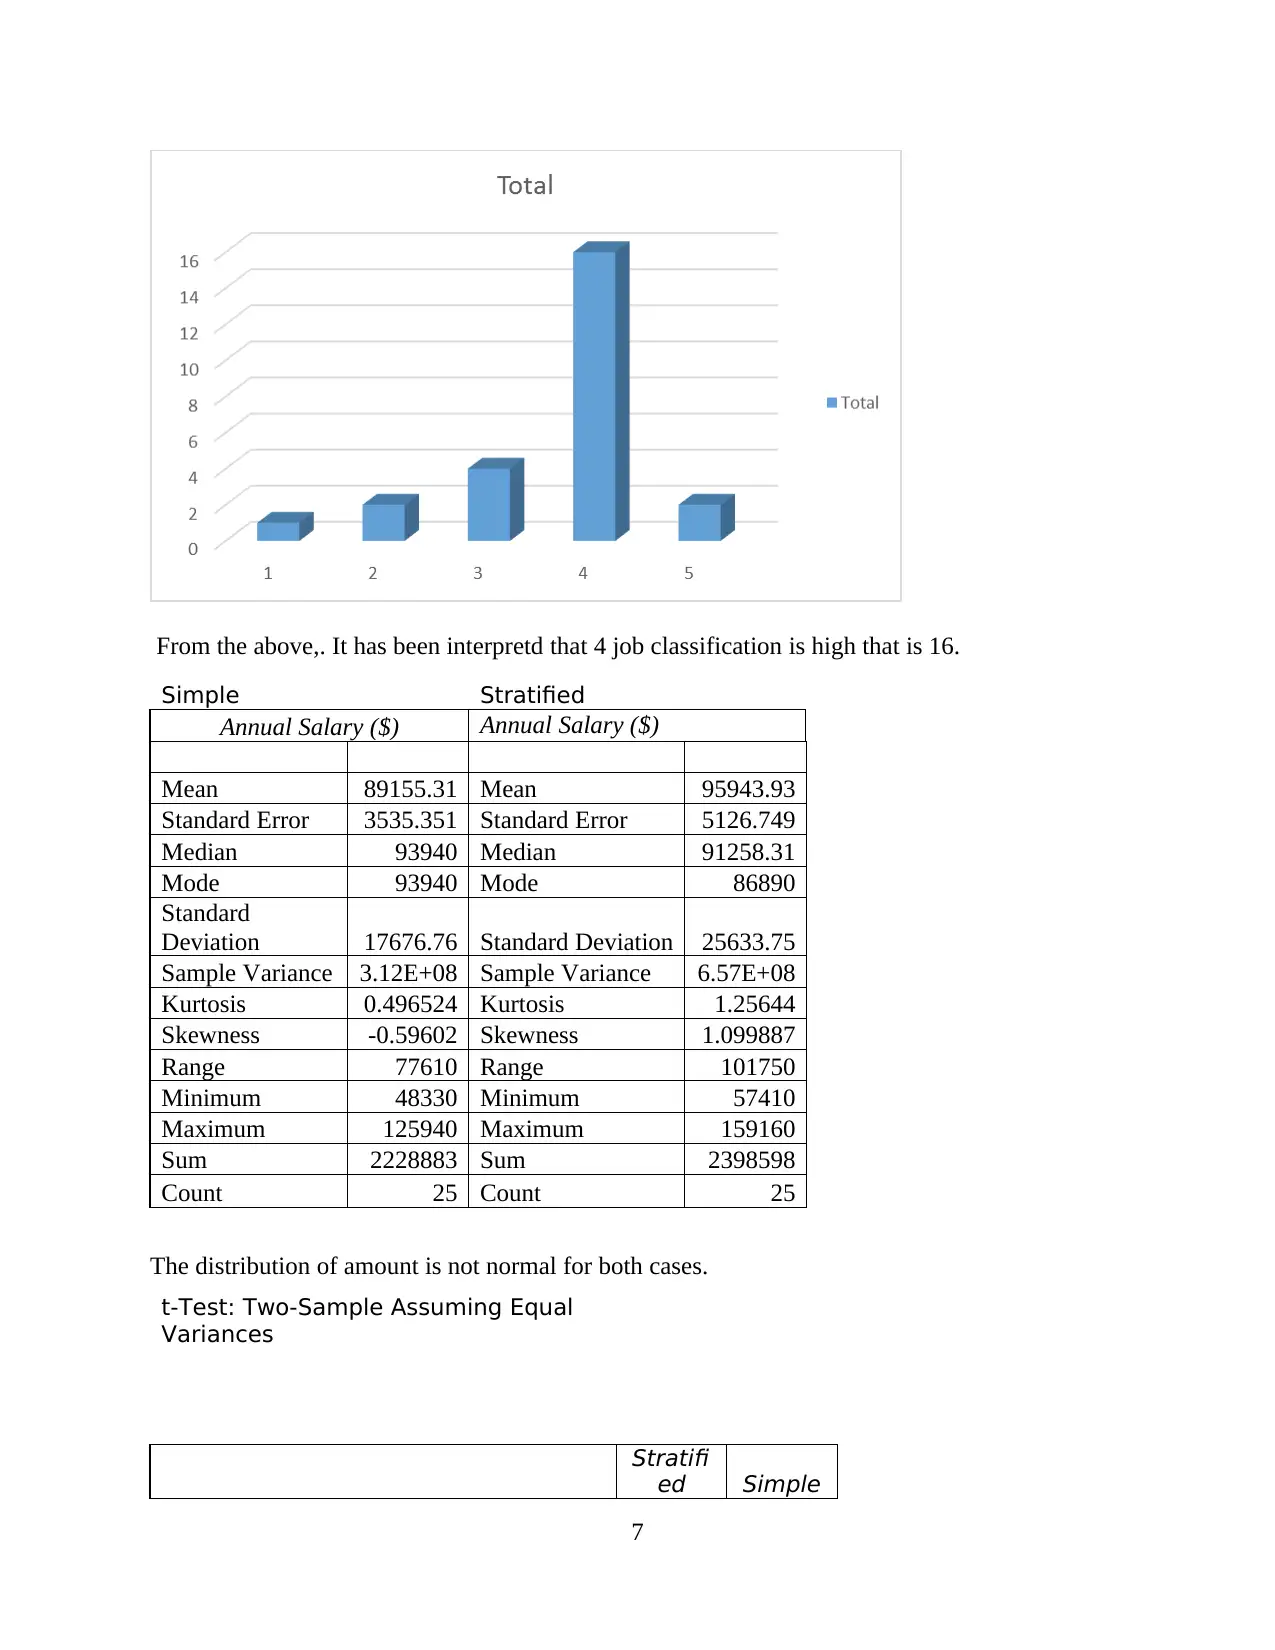
This report presents a statistical analysis comparing simple and stratified sampling methods. It begins with an introduction to descriptive statistics, including the mean, median, and distribution of salary, age, work experience, gender, and blood pressure readings. The analysis extends to inferential statistics, describing confidence intervals and applying regression models to interpret data and determine relationships. The report provides detailed tables and interpretations for both sampling methods, comparing salary distributions, gender-based variations, and job classifications. Further, it examines the relationship between salary and work experience through regression analysis, providing ANOVA tables and statistical significance. The report concludes with a summary of findings and comparisons between the two sampling methodologies, offering valuable insights into the data and the statistical techniques used.

Statistics Report and excel sheet work
Paraphrase This Document
Need a fresh take? Get an instant paraphrase of this document with our AI Paraphraser

INTRODUCTION...........................................................................................................................1
Descriptive Statistics...................................................................................................................1
Inferential Statistics.....................................................................................................................8
Analysis of relationship.............................................................................................................10
Summary/ Conclusion...................................................................................................................15

INTRODUCTION
The present report is based upon two sample size data of simple and stratified sampling
method in which the current report helps to determine the average and median salary earned by
using descriptive statistics method. On the other side, in inferential statistics data, it describes
the confidential interval and researcher also applies different models in order to interpret the
data and describe the relationship as well.
Descriptive Statistics
Descriptive statistics : Simple Sampling
Annual Salary
($)
Age(in
years)
Years of Work
experience Gender Blood pressure reading
Mean 89155.31 33.4 8.96 1.48 1.6
Standard Error 3535.351 1.975053 1.239261 0.10198 0.141421
Median 93940 31 8 1 1
Mode 93940 33 10 1 1
Standard
Deviation 17676.76 9.875264 6.196303 0.509902 0.707107
Sample
Variance 3.12E+08 97.52083 38.39417 0.26 0.5
Range 77610 35 22.5 1 2
Minimum 48330 23 1.5 1 1
Maximum 125940 58 24 2 3
Sum 2228883 835 224 37 40
Count 25 25 25 25 25
From the above descriptive table, it is analysed that the average salary earned by an
individual is around 89000 and the median salary of the sampled employees is around 94000.
Moreover, the female are older than male. On the other side, in the organization the average year
of work experience of employees is around 9 years and there is difference between the two
samples.
Row
Labels
Count of
Gender
Average of Annual
Salary ($)
1 13 89094.36308
2 12 89221.33333
Grand
Total 25 89155.3088
1
⊘ This is a preview!⊘
Do you want full access?
Subscribe today to unlock all pages.

Trusted by 1+ million students worldwide

(1 represents- Male, 2 represents- Female)
Proportion of male/female: proportion of male is higher than female and on an average, female
earn higher salary as compared to male.
Yes, the salaries are varied according to gender.
Distribution of Blood pressure according to gender:
Row Labels
Count of
Gender
1 13
1 6
2 7
2 9
1 5
2 4
3 3
1 2
2 1
Grand
Total 25
2
Paraphrase This Document
Need a fresh take? Get an instant paraphrase of this document with our AI Paraphraser

(Row label 1= Low, 2= Medium, 3= High)
From the above it is interpreted that for high BP, there are 3 employees in which 2 are male and
1 is female. Further, for medium BP, there is 9 employees in the organization such that5 are male
and 4 are female. Lastly, low BP employees are 13 in which 6 are male and 2 are female.
Distribution of job classification:
Row
Labels
Count of Job
Classification
2 3
3 5
4 14
5 3
Grand
Total 25
3

From the above, it has been interpreted that job classification number is 4 is high i.e. 14
Descriptive statistics : stratified sample
Annual Salary
($)
Age(in
years)
Years of Work
experience Gender Blood pressure reading
Mean 95943.93 32.52 8.3 1.52 1.8
Standard
Error 5126.749 1.605065 1.067318 0.10198 0.163299
Median 91258.31 30 7 2 2
Mode 86890 29 6 2 1
Standard
Deviation 25633.75 8.025325 5.336588 0.509902 0.816497
Range 101750 33 20 1 2
Minimum 57410 25 2 1 1
Maximum 159160 58 22 2 3
Sum 2398598 813 207.5 38 45
Count 25 25 25 25 25
From the table, it has been analysed that 96000 is the average salary earned through the
stratified sample method and median salary of the sample employees is 91000 and 32 Is the
average age of employees in the organization. The work experience of the workers in this
organization is around 8 and there is a significant different between the two samples. Further the
female are older than male.
Proportion of male/female:
Row
Labels
Count of
Gender
Average of Annual
Salary ($)
1 12 91983.90517
2 13 99599.33146
Grand
Total 25 95943.92684
4
⊘ This is a preview!⊘
Do you want full access?
Subscribe today to unlock all pages.

Trusted by 1+ million students worldwide

(1 represents- Male, 2 represents- Female)
From the above it has been interpreted that there are 12 males and 13 females and the
average salary is around 96000. Therefore, it is interpreted that female earn more than male.
Distribution of Blood pressure according to gender:
Row Labels Count of Gender
1 11
1 2
2 9
2 8
1 5
2 3
3 6
1 5
2 1
Grand Total 25
5
Paraphrase This Document
Need a fresh take? Get an instant paraphrase of this document with our AI Paraphraser

(Row label 1= Low, 2= Medium, 3= High)
From the above it has been interpreted that for high BP, there are 6 workers in which 5
are male and 1 is female. Further, for medium BP, there is 8 staffs in the organization such that 5
are male and 3 are female. Then, low BP employees are 11 in which 2 are male and 9 are female.
Distribution of job classification:
Count of Job
Classification
Job Classification
Tot
al
1 1
2 2
3 4
4 16
5 2
Grand Total 25
6

From the above,. It has been interpretd that 4 job classification is high that is 16.
Simple Stratified
Annual Salary ($) Annual Salary ($)
Mean 89155.31 Mean 95943.93
Standard Error 3535.351 Standard Error 5126.749
Median 93940 Median 91258.31
Mode 93940 Mode 86890
Standard
Deviation 17676.76 Standard Deviation 25633.75
Sample Variance 3.12E+08 Sample Variance 6.57E+08
Kurtosis 0.496524 Kurtosis 1.25644
Skewness -0.59602 Skewness 1.099887
Range 77610 Range 101750
Minimum 48330 Minimum 57410
Maximum 125940 Maximum 159160
Sum 2228883 Sum 2398598
Count 25 Count 25
The distribution of amount is not normal for both cases.
t-Test: Two-Sample Assuming Equal
Variances
Stratifi
ed Simple
7
⊘ This is a preview!⊘
Do you want full access?
Subscribe today to unlock all pages.

Trusted by 1+ million students worldwide

Mean 8.3 8.96
Variance
28.479
17
38.394
17
Observations 25 25
Pooled Variance
33.436
67
Hypothesized Mean Difference 0
df 48
t Stat
-
0.4035
4
P(T<=t) one-tail
0.3441
71
t Critical one-tail
1.6772
24
P(T<=t) two-tail
0.6883
43
t Critical two-tail
2.0106
35
Value of p is 0.68>0.05 which means that there is no significant difference between simple and
stratified sample in terms of years of experience.
Inferential Statistics
Simple Stratified
Confidence
Level 95%
Confidence
Level 95%
Ship A Ship B
n 25 n 175
Mean
93471.
25 Mean
93471.
25
Std Dev
17676.
76 Std Dev
25633.
75
RESULTS RESULTS
SE
3535.3
52 SE
1937.7
29
Z 1.96 Z
1.9599
64
Margin of
Error
6929.2
9
Margin of
Error
3797.8
8
Lower Limit
86541.
96 Lower Limit
89673.
37
Upper Limit
10040
0.5 Upper Limit
97269.
13
8
Paraphrase This Document
Need a fresh take? Get an instant paraphrase of this document with our AI Paraphraser

Interpretation: In simple random, if the average salary remains by 93471 then in that case 95%
CI will remain in the range of 86541 and 100400. On the other side, for stratified method, if the
average salary remains by 93471 then in that case 95% CI will remain in the range of 89673
and 97269. Further, the sample results are accurate and also the methodology can be describe
by the identifies the ranges.
Simple Stratified
Confidence
Level 90%
Confidence
Level 90%
n 25 n 175
Mean 33.42 Mean 33.42
Std Dev
9.8752
64 Std Dev
8.0253
25
RESULTS RESULTS
SE
1.9750
53 SE
0.6066
58
Z 1.645 Z
1.6448
54
Margin of
Error
3.2489
62
Margin of
Error
0.9978
63
Lower Limit
30.171
04 Lower Limit
32.422
14
Upper Limit
36.668
96 Upper Limit
34.417
86
Interpretation: in the simple random sample, the average age is 33.42 then in this case, 90% of
the CI will remain in the range of 30 and 37. While on the other side, for stratified sample data,
the range varies from 32 to 34. . Further, the sample results are accurate and also the
methodology can be describe by identifies the ranges.
Simple Stratified
Sample proportion 52% Sample proportion 44%
Population
proportion 30% Population proportion 30%
STDEV 0.7 STDEV 0.81
Z value 0.154 Z value 0.1134
Probability of
suffering of
individual from
55% Probability of suffering of individual
from low blood pressure
54%
9

low blood
pressure
There is probability that 55% individual in sample may have low blood pressure in simple
sample. Percentage is more then 37%. Hence, it can be said that assumption is correct.
On the other side, There is probability that 54% individual in sample may have low blood
pressure in simple sample. Percentage is more then 37%. Hence, it can be said that assumption is
correct.
Analysis of relationship
For simple random sampling
In order to determine the relationship between the salary earned and number of years of
work experienced can be identified through Regression which is a mention below:
H0 (Null hypothesis): There is no statistical significant difference in the mean values of salary
earned and work experience.
H1 (Alternative hypothesis): There is a statistical significant difference in the mean values of
salary earned and work experience.
Regression Statistics
Multiple R 0.782929
R Square 0.612978
Adjusted R
Square 0.596151
Standard Error 3.937694
Observations 25
ANOVA
df SS MS F
Significance
F
Regression 1 564.8349 564.8349 36.42818 0.00000373
Residual 23 356.6251 15.50544
Total 24 921.46
Coefficients
Standard
Error t Stat P-value
Lower
95%
Upper
95%
Lower
95.0%
Upper
95.0%
Intercept -15.5081 4.129761 -3.7552 0.001031
-
24.0511 -6.96501
-
24.0511 -6.96501
Annual
Salary
0.000274 4.55E-05 6.035577 3.73E-06 0.00018 0.000369 0.00018 0.000369
10
⊘ This is a preview!⊘
Do you want full access?
Subscribe today to unlock all pages.

Trusted by 1+ million students worldwide
1 out of 19
Related Documents

Your All-in-One AI-Powered Toolkit for Academic Success.
 +13062052269
info@desklib.com
Available 24*7 on WhatsApp / Email
Unlock your academic potential
Copyright © 2020–2025 A2Z Services. All Rights Reserved. Developed and managed by ZUCOL.