Statistics Homework: KU Spring 2019 - Task Solutions
VerifiedAdded on 2022/09/22
|11
|883
|34
Homework Assignment
AI Summary
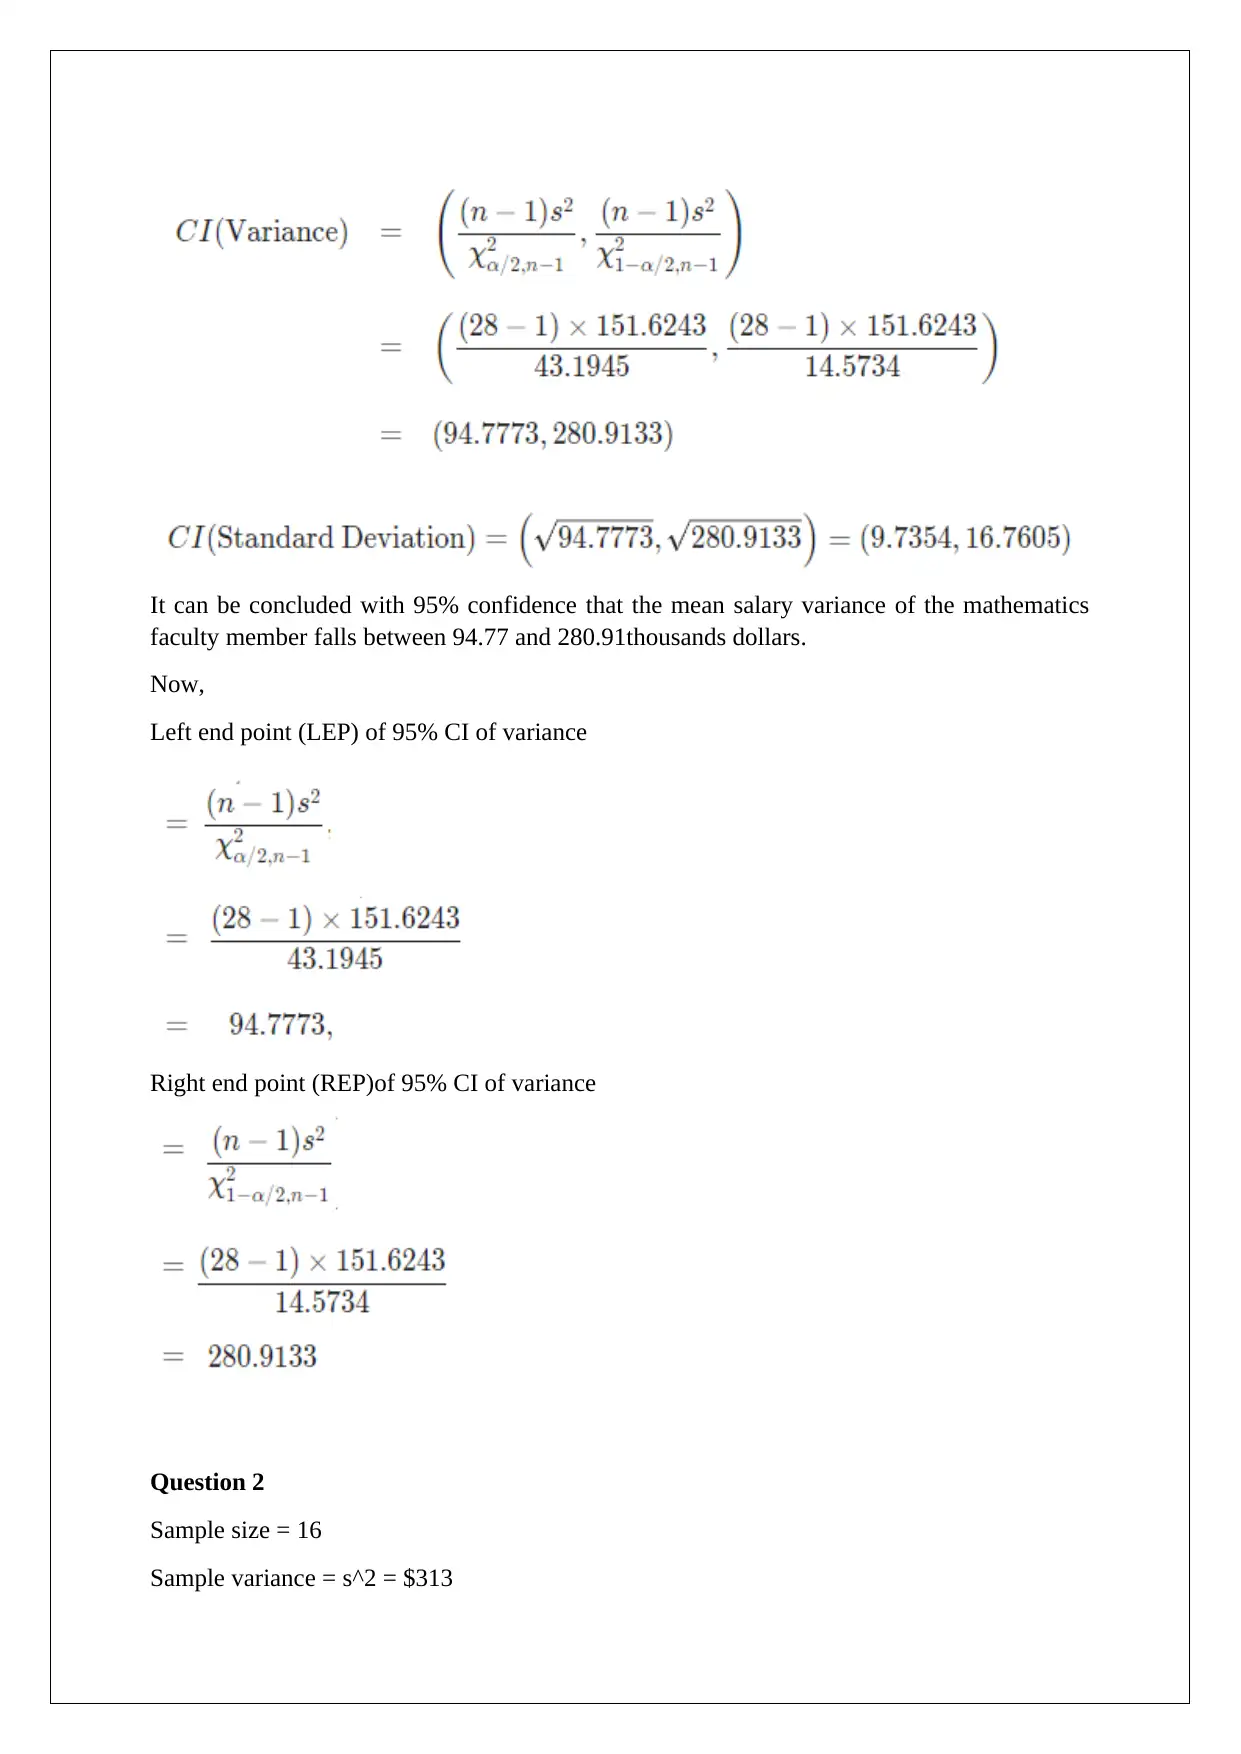
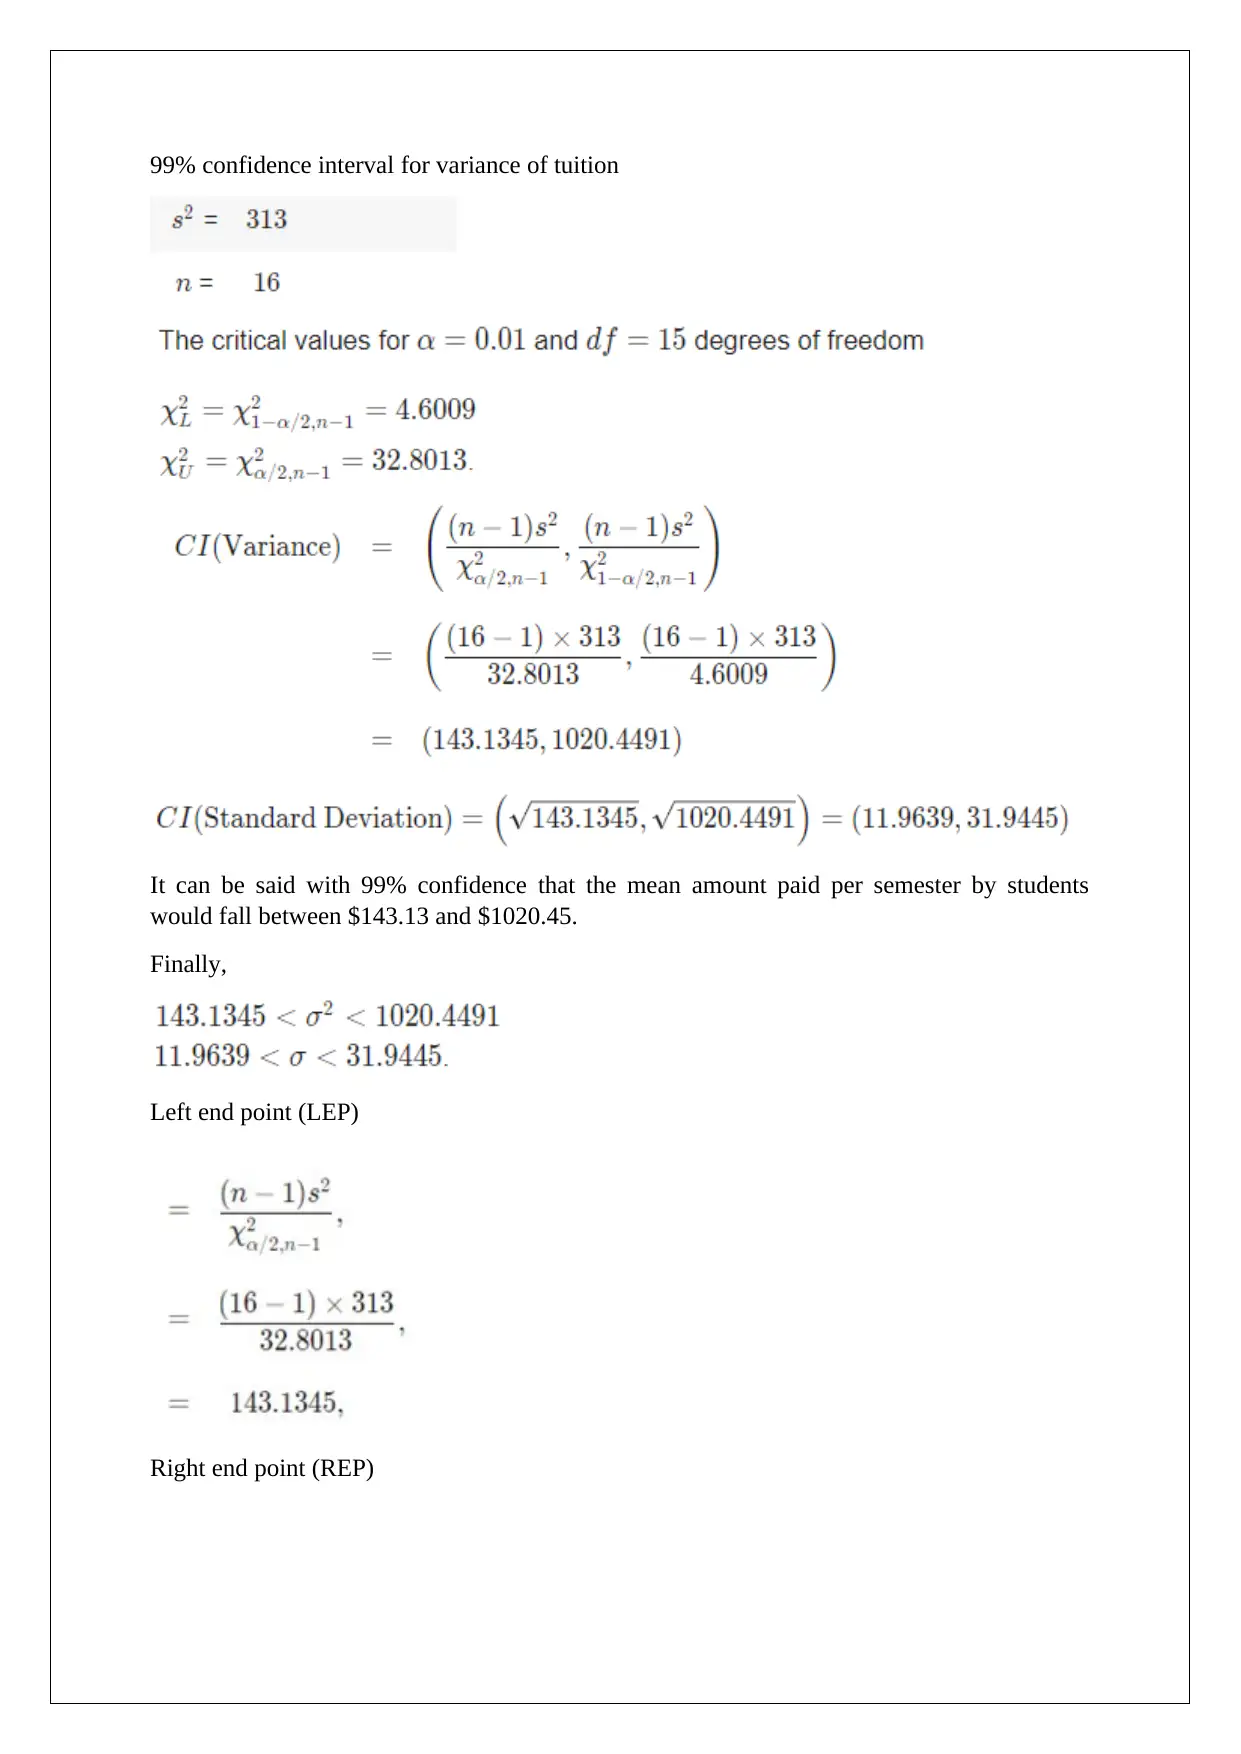
This document presents solutions to a statistics homework assignment, addressing concepts from confidence intervals and hypothesis testing to sample size calculations and margin of error. The assignment includes calculations of proportions, confidence intervals (95% and 99%), and conservative margin of error for different scenarios. It also covers hypothesis testing, including null and alternative hypotheses, p-values, and levels of significance, with examples involving salary, birth weight, and other variables. The solutions provide step-by-step calculations and interpretations, making it a comprehensive resource for students studying elementary statistics. The solutions cover tasks 7.3, 7.4 and 9.1 from the assignment brief.

STATISTICS
STUDENT ID:
[Pick the date]
STUDENT ID:
[Pick the date]
Paraphrase This Document
Need a fresh take? Get an instant paraphrase of this document with our AI Paraphraser

Task - 7.3
Question 1
Sample = 180 bulbs
Number of defective bulbs = 27
Proportion of defective bulbs in factory =?
95% confidence interval =?
Margin of error e =?
Left end point (LEP)=?
Right end point (REP)=?
Conservative margin of error (E)=?
Now,
Proportion of defective bulbs in factory = 27/180 = 0.15
The z value for 95% confidence interval = 1.96
Margin of error = ± z value √ p ( 1−p )
n =±1.96 √ 0.15∗1−0.15
180 =± 0.0522
Left end point (LEP) = p – Margin of error = 0.15 – 0.0522 = 0.0978
Right end point (REP)= p + Margin of error = 0.15 +0.0522=0.2022
Conservative margin of error (E) = C- MOE = (REP-LEP)-MOE = (0.2022-0.0978)-0.0522
=0.0522
Question 2
Sample = 176 people
Number of people found to be infected with HIV = 44
Proportion of infected people =?
99% confidence interval =?
Margin of error e =?
Left end point (LEP)=?
Right end point (REP)=?
Conservative margin of error (E)=?
Now,

Proportion of infected people = 44/176 = 0.25
The z value for 99% confidence interval = 2.58
Margin of error = ± z value √ p ( 1−p )
n =±2.58 √ 0.25∗1−0.25
176 =± 0.0842
Left end point (LEP) = p – Margin of error = 0.25 – 0.0842 = 0.1658
Right end point (REP)= p + Margin of error = 0.25 +0.0842=0.3342
Conservative margin of error (E)= C- MOE = (REP-LEP)-MOE = (0.3342-0.1568)- 0.0842 =
0.0932
Question 3
Sample size =?
Proportion within 0.01 from sample proportion i.e. E = 0.01
95% level of confidence
Proportion = 0.15
n = {(z value)^2 *p(1-p)}/(Margin of error)^2 = (1.96*1.96*0.15*(1-0.15)/(0.01*0.01)
Required sample size n= 4898
Question 4
Sample size =?
Proportion within 0.02 from sample proportion i.e. E = 0.02
99% level of confidence
Proportion = 0.5
n = {(z value)^2 *p(1-p)}/(Margin of error)^2 = (2.58*2.58*0.5*(1-0.5)/(0.02*0.02)
Required sample size n =4147
Task 7.4
Question 1
95% confidence interval for variance of the salary =?
Left end point (LEP)=?
Right end point (REP)=?
Now,
⊘ This is a preview!⊘
Do you want full access?
Subscribe today to unlock all pages.

Trusted by 1+ million students worldwide

Paraphrase This Document
Need a fresh take? Get an instant paraphrase of this document with our AI Paraphraser

It can be concluded with 95% confidence that the mean salary variance of the mathematics
faculty member falls between 94.77 and 280.91thousands dollars.
Now,
Left end point (LEP) of 95% CI of variance
Right end point (REP)of 95% CI of variance
Question 2
Sample size = 16
Sample variance = s^2 = $313
faculty member falls between 94.77 and 280.91thousands dollars.
Now,
Left end point (LEP) of 95% CI of variance
Right end point (REP)of 95% CI of variance
Question 2
Sample size = 16
Sample variance = s^2 = $313

99% confidence interval for variance of tuition
It can be said with 99% confidence that the mean amount paid per semester by students
would fall between $143.13 and $1020.45.
Finally,
Left end point (LEP)
Right end point (REP)
It can be said with 99% confidence that the mean amount paid per semester by students
would fall between $143.13 and $1020.45.
Finally,
Left end point (LEP)
Right end point (REP)
⊘ This is a preview!⊘
Do you want full access?
Subscribe today to unlock all pages.

Trusted by 1+ million students worldwide

Question 3
Paraphrase This Document
Need a fresh take? Get an instant paraphrase of this document with our AI Paraphraser

Finally,
Left end point (LEP)
Right end point (REP)
Left end point (LEP)
Right end point (REP)

Task 9.1
Question 1
(a) Null and alternative hypotheses
Null hypothesis H0 :μ=51 KMean salary of new KU graduates is 51K.
Alternative hypothesis Ha : μ>51 K Mean salary of new KU graduates is more than 51K.
Now,
Sample mean salary x=54 K
Standard deviation σ=5 K
Sample size n = 15
z stat = x−μ
s . e . = 54−51
5
√ 15
=2.324
As per the sign of the alternative hypothesis, the test would be right tailed test.
The right tailed p value for the calculated z stat = 0.010063
(b) Level of significance = 0.05
Here, p value < level of significance which implies that null hypothesis would be rejected.
Answer: YES
(c) The lowest level of significance at which we can conclude that graduate salary has
increased is 2%.
Question 2
⊘ This is a preview!⊘
Do you want full access?
Subscribe today to unlock all pages.

Trusted by 1+ million students worldwide

(a) Null and alternative hypotheses
Null hypothesis H0 :μ=112 ouncesMean birth weight of babies in US is 12 ounces.
Alternative hypothesis Ha : μ>1 12ounces Mean birth weight of babies in US is higher than
12 ounces.
Now,
Sample mean salary x=115 ounces
Standard deviation σ=17 ounces
Sample size n = 96
z stat = x−μ
s . e . = 115−112
17
√ 96
=1.729
As per the sign of the alternative hypothesis, the test would be right tailed test.
The right tailed p value for the calculated z stat = 0.041905
(b) Level of significance = 0.05
Here, p value < level of significance which implies that null hypothesis would be rejected.
Answer: YES
(c) The lowest level of significance would be 5%.
Question 3
(a) Null and alternative hypotheses
Null hypothesis H0 :μ=25 sMeantime of athleteis 25 sec .
Alternative hypothesis Ha : μ<25 s Mean time of athlete is lower than 25 sec .
Now,
Sample mean salary x=23.9 s
Standard deviation σ=3 s
Sample size n = 29
z stat = x−μ
s . e . = 23.9−25
3
√ 29
=−1.975
Paraphrase This Document
Need a fresh take? Get an instant paraphrase of this document with our AI Paraphraser

As per the sign of the alternative hypothesis, the test would be left tailed test.
The right tailed p value for the calculated z stat = 0.024134
(b) Level of significance = 0.05
Here, p value < level of significance which implies that null hypothesis would be rejected.
Answer: YES
(c) The lowest level of significance to conclude improvement is 3%.
The right tailed p value for the calculated z stat = 0.024134
(b) Level of significance = 0.05
Here, p value < level of significance which implies that null hypothesis would be rejected.
Answer: YES
(c) The lowest level of significance to conclude improvement is 3%.
1 out of 11
Related Documents

Your All-in-One AI-Powered Toolkit for Academic Success.
+13062052269
info@desklib.com
Available 24*7 on WhatsApp / Email
Unlock your academic potential
Copyright © 2020–2025 A2Z Services. All Rights Reserved. Developed and managed by ZUCOL.