Undergraduate Statistics: Stock Prices, Probability, and Data Analysis
VerifiedAdded on 2023/06/11
|7
|912
|473
Homework Assignment
AI Summary
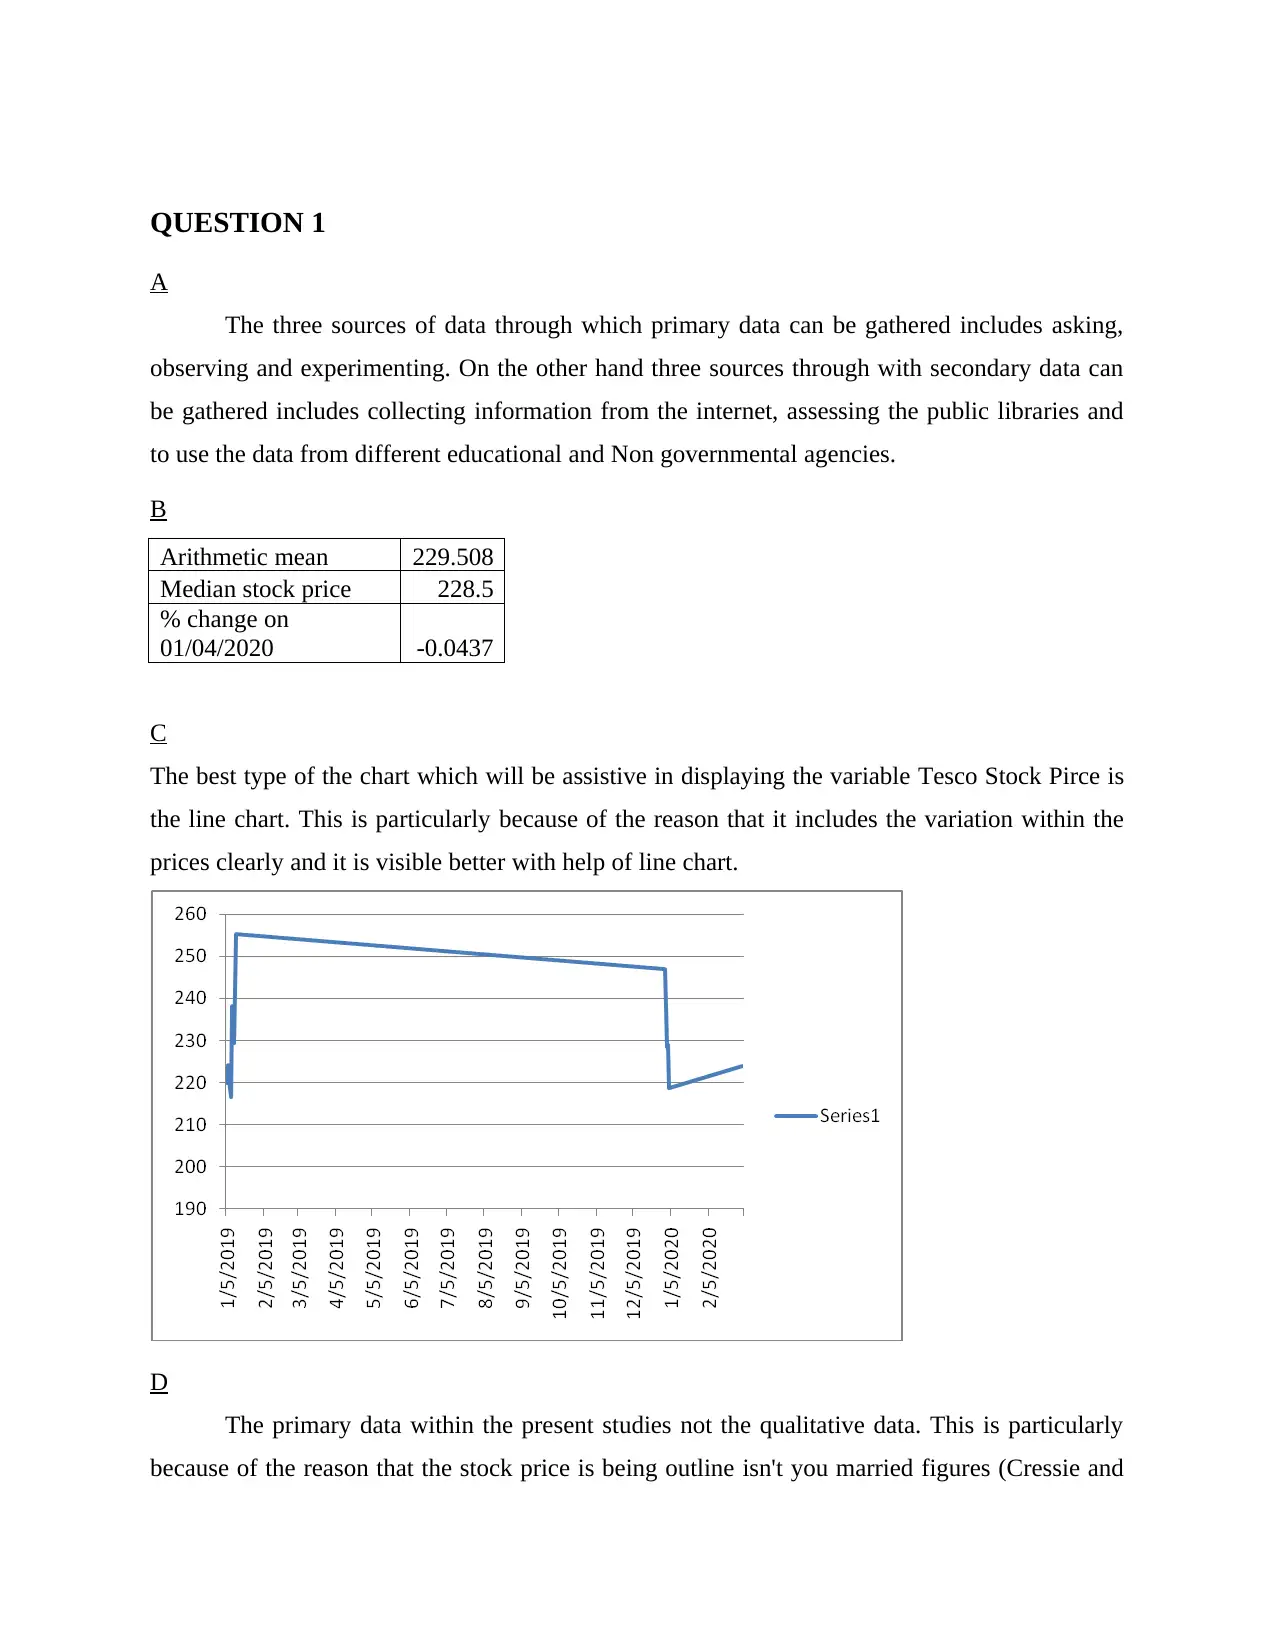
This assignment solution covers various statistical concepts applied to stock price analysis and probability assessments. It includes calculations of arithmetic mean, median, and percentage change in stock prices. Different data visualization techniques, such as line charts, are discussed for displaying variables like Tesco stock prices. The assignment also addresses probability calculations related to spending habits and distances, along with concepts like modal class and compound interest. Furthermore, it delves into Z-score calculations, confidence intervals, and probability density functions. The analysis extends to examining the relationship between advertising expenditure and sales using scatter diagrams and regression equations, highlighting the importance of analyzing the pros and cons of increasing advertisement expenses. Desklib provides students access to a wide array of similar solved assignments and study resources.

1 out of 7
Related Documents


Your All-in-One AI-Powered Toolkit for Academic Success.
+13062052269
info@desklib.com
Available 24*7 on WhatsApp / Email
![[object Object]](/_next/static/media/star-bottom.7253800d.svg)
Copyright © 2020–2026 A2Z Services. All Rights Reserved. Developed and managed by ZUCOL.