Statistical Analysis of Stress and GRE Scores with Training Programs
VerifiedAdded on 2023/06/04
|15
|3490
|435
Report
AI Summary
This report investigates the relationship between stress and GRE scores among a sample of 100 students who participated in GRE training and assertiveness programs. The study examines the effectiveness of a tutoring program and an assertiveness training program in improving GRE scores and reducing stress levels, respectively. Statistical analysis, including regression analysis and descriptive statistics, was performed to assess the correlation between stress and GRE scores, as well as the impact of other variables such as gender, outdoor activity, and time spent on TV. The findings indicate a mild negative association between stress levels and GRE scores, although this relationship was not statistically significant. The tutoring program showed a positive impact on GRE scores, while the assertiveness program appeared to reduce stress levels. The report concludes with recommendations for further research and interventions to support students in managing stress and improving academic performance. Desklib provides access to this and many other solved assignments.
Running head: STATISTICS ASSIGNMENT
Statistics assignment
Name of Student
Student ID
Name of University
Statistics assignment
Name of Student
Student ID
Name of University
Paraphrase This Document
Need a fresh take? Get an instant paraphrase of this document with our AI Paraphraser
1
STATISTICS ASSIGNMENT
Table of Contents
Introduction......................................................................................................................................2
Background..................................................................................................................................2
Statement of Problem..................................................................................................................2
Research questions.......................................................................................................................3
Research Hypothesis....................................................................................................................3
Independent and Dependent Variables........................................................................................4
Literature review..............................................................................................................................4
Data Analysis and results.................................................................................................................6
Discussion......................................................................................................................................12
Recommendation...........................................................................................................................13
Conclusion.....................................................................................................................................13
References......................................................................................................................................14
2
STATISTICS ASSIGNMENT
Introduction
Background
Stress is an emotional and physical disposition that has often been attributed to be a
deterrent to functional efficiency. It is often associated with a myriad of other underlying
conditions aside from the external stimuli that fuel it, such as anxiety, depression among other
mental health conditions. Its cause can also be associated with physical strain and ailments
(Bhambu, 2018). Due to its close association with mental health it is often ignored and brushed
aside by people. However studies have shown that stress can be an important factor in
determining how a person handles a situation. As per Bhambu (2018), stress depending on its
nature and the individual can either serve to be positive or negative force. It has been asserted by
psychologists that moderate stress can actually lead to motivating an individual to perform better
whereas extreme stress could be debilitating. It could lead to an otherwise capable individual to
perform extremely poorly or a person to perform exceedingly better as explored by Siraj et al.
(2014).
Statement of Problem
The impact of stress among students and scholars on their academic performance has
been seen to be widespread across the Globe. Student depression arising out of incapability to
handle the expectations that they set for themselves and is held up to as standards by the
institution and society in general, student attrition and even suicide have been seen across
educational institutions across the world. Hence it is of interest of this paper to identify the
relationship between stress and academic performance and to hopefully identify how to help
students overcome the negative impact that stress could have on their performance at school and
life in general.
⊘ This is a preview!⊘
Do you want full access?
Subscribe today to unlock all pages.
Trusted by 1+ million students worldwide
3
STATISTICS ASSIGNMENT
Data from a 100 students who have appeared for GRE examination who were subjected
to two separate training programs on assertiveness and a tutorship program for GRE have been
collected and asked to fill out a questionnaire which addresses their scores before and after the
programs, their self-reported stress levels, outdoor activity habits, engagement in sports,
addiction to TV, employment details among others. It is to be determined how their scores at
GRE were impacted by their stress and whether the training programs were able to successfully
help them or not.
Research questions
1. How effective was the tutorship program in improving GRE scores?
2. How are GRE scores related to self-reported stress?
3. How has the assertiveness program affected stress levels?
4. What are the factors that can improve GRE scores?
Research Hypothesis
1. H0A: GRE score is unrelated with Stress levels.(Null Hypothesis)
H1A: GRE score is significantly related with Stress levels.
2. H0B: Pre-tutoring GRE scores is same as post –tutoring GRE scores.(Null Hypothesis)
H1B: Pre-tutoring GRE scores is less than post –tutoring GRE scores
3. H0C: Pre-assertiveness programstress levels is same as post–program stress levels(Null
Hypothesis)
H1C: Pre-assertiveness program stress levels is greater than post–program stress levels
Paraphrase This Document
Need a fresh take? Get an instant paraphrase of this document with our AI Paraphraser
4
STATISTICS ASSIGNMENT
4. H0D: Outdoor activity, volunteering, time dedicated to TV and gender do not have
significant impact on GRE scores. (Null Hypothesis)
H1D: Outdoor activity, volunteering, time dedicated to TV and gender have significant
impact on GRE scores.
Independent and Dependent Variables
The dependent variable or the response being studied in this paper is post tutoring
program GRE scores. The independent variables or explanatory variables considered are gender,
outdoor activity level, post assertiveness program stress levels, hours spent watching TV and
time spent volunteering. Aside from this the paper also compares the pro and post tutoring
program GRE grades as well as stress levels before and after the assertiveness program.
Literature review
The impact of stress on examination scores and performance has been studied in the
context of demanding course works such as the field of medicine and for those who are aspirants
of competitive exams and enrolled in higher studies. Sohail (2013) in an article in the Journal of
the college of Physicians and Surgeons Pakistan addressed how stress negatively impacts the
performance of medical students in llama Iqbal Medical College, Lahore. The study utilized
primary data analysis using survey questionnaire and in depth interviews of students to reach that
conclusion that overall higher stress levels show a significant association with poorer
performance for the student. Crego et al. (2015) addressed the subject from the perspective of
dental students. The paper takes into account the negative impact of stress on exam performance
and in turn explores in detail coping strategies that may counter or facilitate the perceived and
academic stress. It was found that high perceived stress had negative association with rational
coping skills such as seeking out social support, problem solving and positive reappraisal.
5
STATISTICS ASSIGNMENT
However emotional coping strategies such as negative self criticism and venting negativity were
positively associated with exam related stress. Furthermore greater sense of self efficacy was
seen to be positively related to rational coping activities and negatively associated with
emotional coping. The paper concluded that students who had greater self confidence in being
able to tackle academic hurdles usually perform better than those with more negative self
perception in this regard. Siraj et al.(2014) conducted a study on the undergraduate students of
medical science at the UKM Medical Center in Malaysia. Based on a cross sectional study of the
performance of the students and the stress factors faced by the students. Although most studies
reported negative relationship between academic performance and stress, the study found that the
subjects under high stress corresponded with higher CGPA scores, that is, in this case the
students were found to perform better under stress. The study concluded that although stress was
high, the students were able to successfully deal with their stress which in turn negated the
harmful effects of stress and lead to better performance. The authors went on to recommend that
introducing training programs for the personal and professional development to manage stress
and everyday challenges for students to counter the ill effects of stress and achieve higher scores.
Another study by Jamieson et al. (2016) studied the effectiveness of stress appraisal methods by
students by means of psycho-situational intervention as a treatment for stress induced poor
classroom performance among students in a community college enrolled in a mathematics course
in the USA. The focus was on comparing effectiveness of stress arousal as compared to ignoring
stress which was the placebo group. The paper concluded that the treatment group showed
significantly less degree of Math anxiety and significantly greater scores than the control or
placebo group. The study further established that reappraisal led to an improvement in the
students regarding their ability to cope with stress in the academic context at the least.
⊘ This is a preview!⊘
Do you want full access?
Subscribe today to unlock all pages.
Trusted by 1+ million students worldwide
6
STATISTICS ASSIGNMENT
Therefore drawing upon the works of Jamieson et al.(2016) and Siraj et al. (2014), this
paper seeks to address the effectiveness of a self assertiveness program as a way to reduce stress
and its ensuing impact on the scores of aspirants of GRE examination. The paper makes use of
inferential statistical techniques to compare the results from before and after a training program
for assertiveness and one for the GRE examination itself..
Data Analysis and results
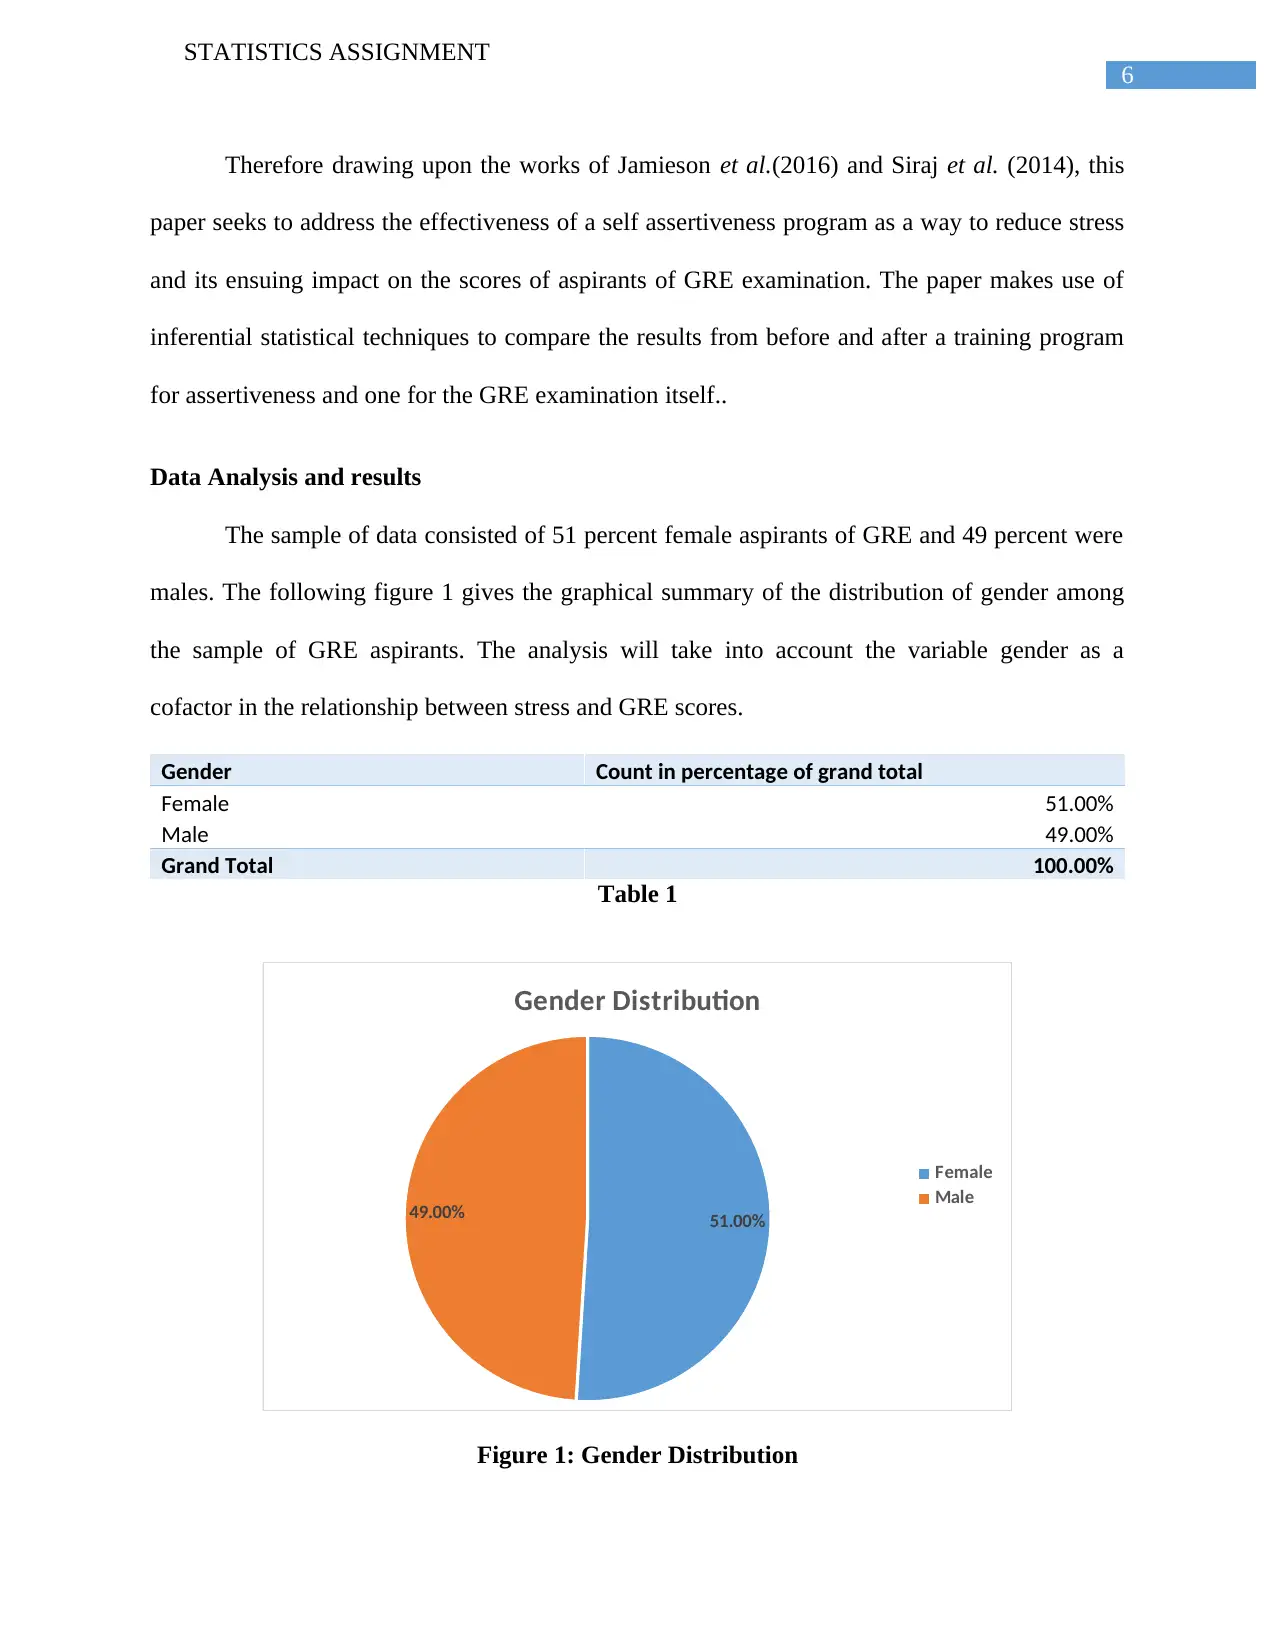
The sample of data consisted of 51 percent female aspirants of GRE and 49 percent were
males. The following figure 1 gives the graphical summary of the distribution of gender among
the sample of GRE aspirants. The analysis will take into account the variable gender as a
cofactor in the relationship between stress and GRE scores.
Gender Count in percentage of grand total
Female 51.00%
Male 49.00%
Grand Total 100.00%
Table 1
51.00%49.00%
Gender Distribution
Female
Male
Figure 1: Gender Distribution
STATISTICS ASSIGNMENT
Therefore drawing upon the works of Jamieson et al.(2016) and Siraj et al. (2014), this
paper seeks to address the effectiveness of a self assertiveness program as a way to reduce stress
and its ensuing impact on the scores of aspirants of GRE examination. The paper makes use of
inferential statistical techniques to compare the results from before and after a training program
for assertiveness and one for the GRE examination itself..
Data Analysis and results
The sample of data consisted of 51 percent female aspirants of GRE and 49 percent were
males. The following figure 1 gives the graphical summary of the distribution of gender among
the sample of GRE aspirants. The analysis will take into account the variable gender as a
cofactor in the relationship between stress and GRE scores.
Gender Count in percentage of grand total
Female 51.00%
Male 49.00%
Grand Total 100.00%
Table 1
51.00%49.00%
Gender Distribution
Female
Male
Figure 1: Gender Distribution
Paraphrase This Document
Need a fresh take? Get an instant paraphrase of this document with our AI Paraphraser
7
STATISTICS ASSIGNMENT
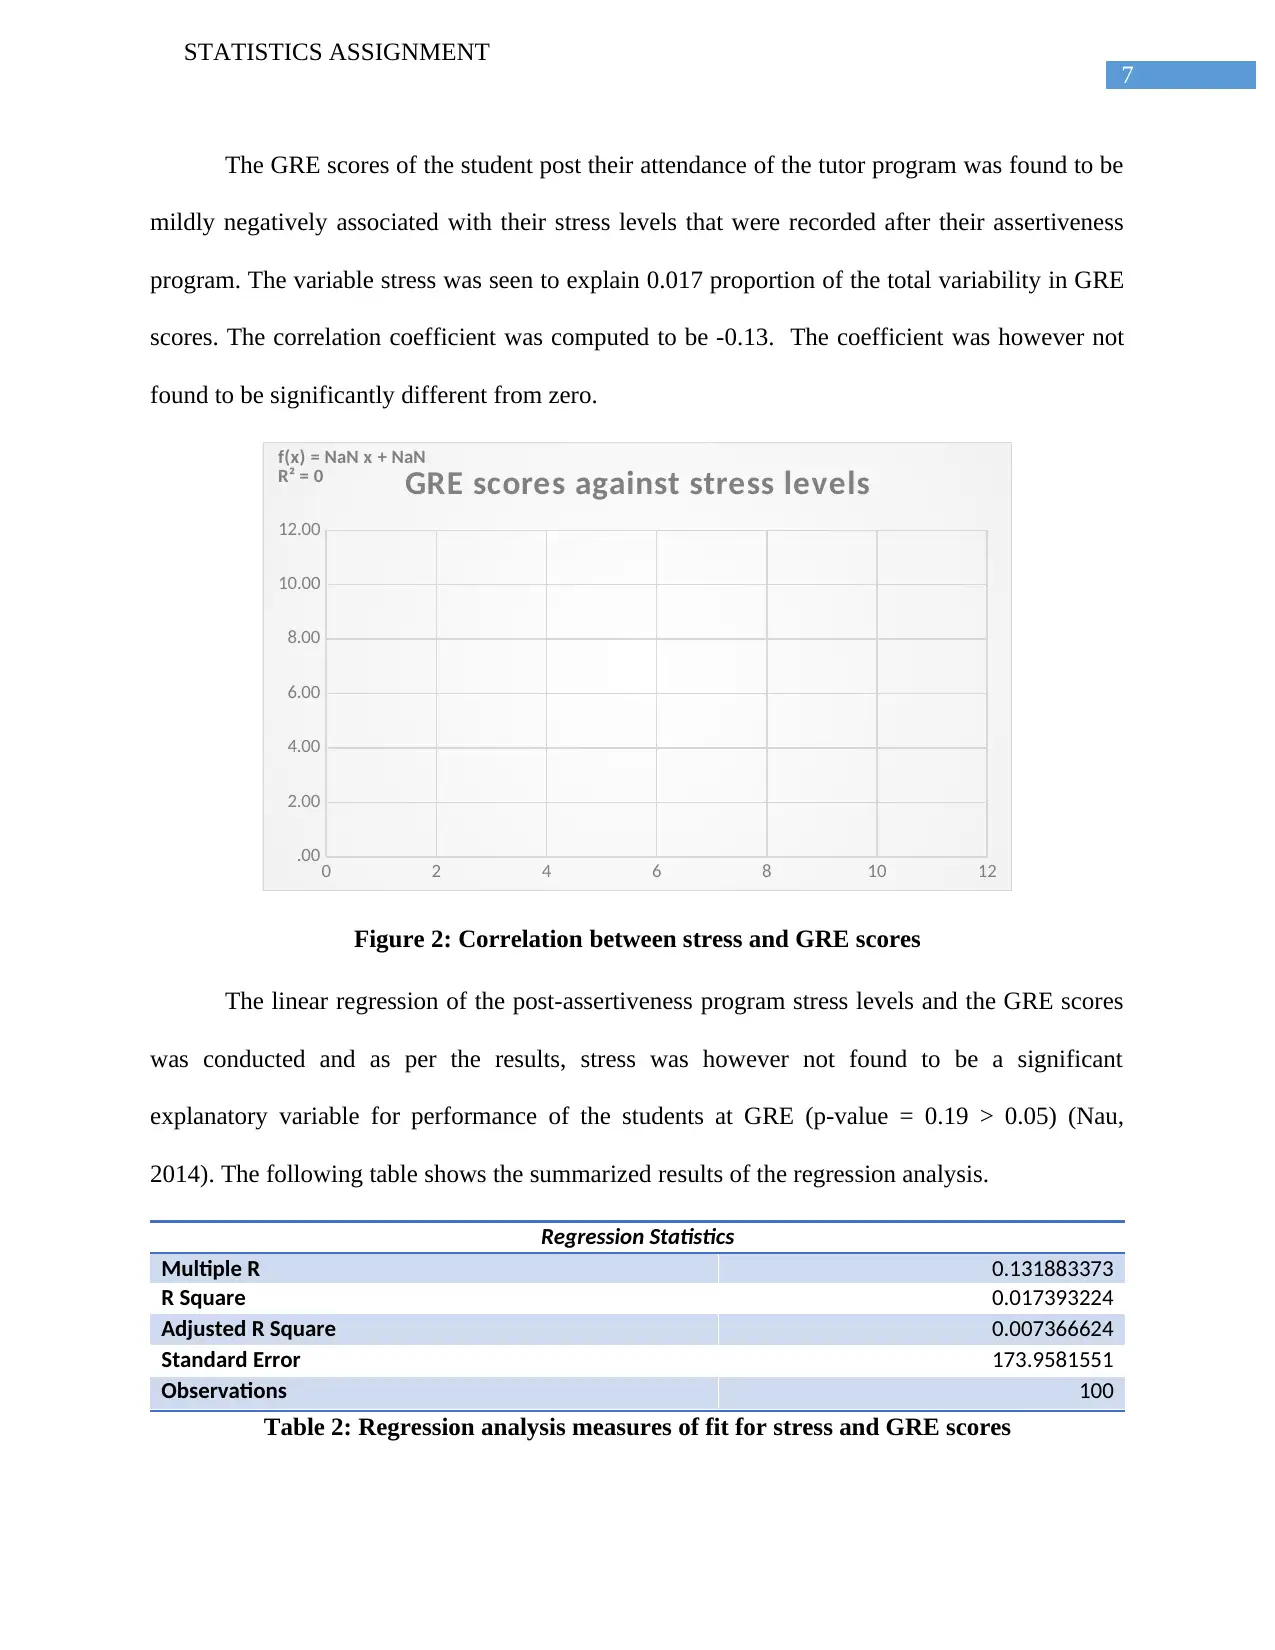
The GRE scores of the student post their attendance of the tutor program was found to be
mildly negatively associated with their stress levels that were recorded after their assertiveness
program. The variable stress was seen to explain 0.017 proportion of the total variability in GRE
scores. The correlation coefficient was computed to be -0.13. The coefficient was however not
found to be significantly different from zero.
0 2 4 6 8 10 12
.00
2.00
4.00
6.00
8.00
10.00
12.00
f(x) = NaN x + NaN
R² = 0 GRE scores against stress levels
Figure 2: Correlation between stress and GRE scores
The linear regression of the post-assertiveness program stress levels and the GRE scores
was conducted and as per the results, stress was however not found to be a significant
explanatory variable for performance of the students at GRE (p-value = 0.19 > 0.05) (Nau,
2014). The following table shows the summarized results of the regression analysis.
Regression Statistics
Multiple R 0.131883373
R Square 0.017393224
Adjusted R Square 0.007366624
Standard Error 173.9581551
Observations 100
Table 2: Regression analysis measures of fit for stress and GRE scores
STATISTICS ASSIGNMENT
The GRE scores of the student post their attendance of the tutor program was found to be
mildly negatively associated with their stress levels that were recorded after their assertiveness
program. The variable stress was seen to explain 0.017 proportion of the total variability in GRE
scores. The correlation coefficient was computed to be -0.13. The coefficient was however not
found to be significantly different from zero.
0 2 4 6 8 10 12
.00
2.00
4.00
6.00
8.00
10.00
12.00
f(x) = NaN x + NaN
R² = 0 GRE scores against stress levels
Figure 2: Correlation between stress and GRE scores
The linear regression of the post-assertiveness program stress levels and the GRE scores
was conducted and as per the results, stress was however not found to be a significant
explanatory variable for performance of the students at GRE (p-value = 0.19 > 0.05) (Nau,
2014). The following table shows the summarized results of the regression analysis.
Regression Statistics
Multiple R 0.131883373
R Square 0.017393224
Adjusted R Square 0.007366624
Standard Error 173.9581551
Observations 100
Table 2: Regression analysis measures of fit for stress and GRE scores
8
STATISTICS ASSIGNMENT
ANOVA
df SS MS F Significance
F
Regression 1 52494.76559 52494.77 1.734708 0.190882
Residual 98 2965621.093 30261.44
Total 99 3018115.858
Table 3: Regression analysis ANOVA test for stress and GRE scores
Coefficien
ts
Standard
Error
t Stat P-
value
Lower
95%
Upper
95%
Lower
95.0%
Upper
95.0%
Interce
pt
372.01517
18
41.218002
19
9.0255
51
1.57E-
14
290.219
4
453.811 290.2194 453.811
POASSE
RT
-
8.2576745
78
6.2696681
82
-
1.3170
8
0.1908
82
-
20.6996
4.18427
8
-20.6996 4.184278
Table 4: Regression analysis estimated coefficients for stress and GRE scores
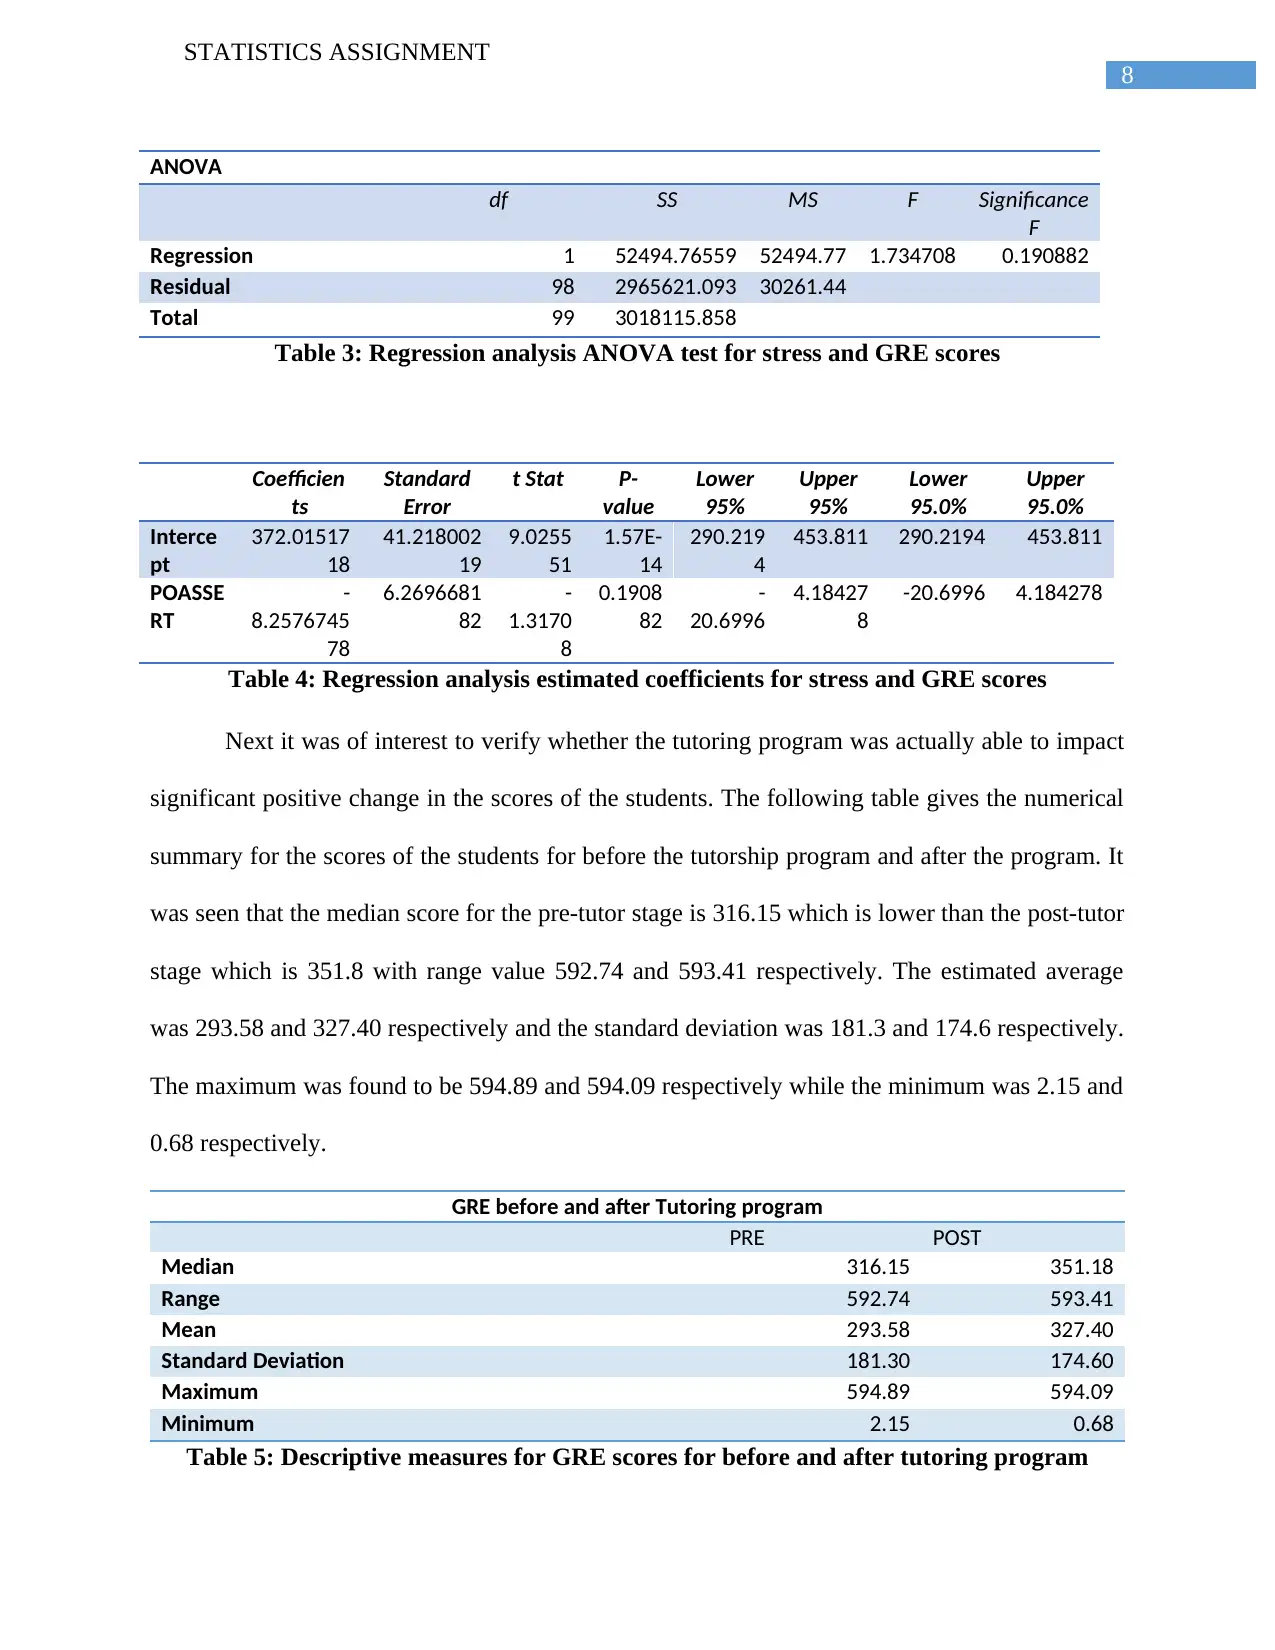
Next it was of interest to verify whether the tutoring program was actually able to impact
significant positive change in the scores of the students. The following table gives the numerical
summary for the scores of the students for before the tutorship program and after the program. It
was seen that the median score for the pre-tutor stage is 316.15 which is lower than the post-tutor
stage which is 351.8 with range value 592.74 and 593.41 respectively. The estimated average
was 293.58 and 327.40 respectively and the standard deviation was 181.3 and 174.6 respectively.
The maximum was found to be 594.89 and 594.09 respectively while the minimum was 2.15 and
0.68 respectively.
GRE before and after Tutoring program
PRE POST
Median 316.15 351.18
Range 592.74 593.41
Mean 293.58 327.40
Standard Deviation 181.30 174.60
Maximum 594.89 594.09
Minimum 2.15 0.68
Table 5: Descriptive measures for GRE scores for before and after tutoring program
STATISTICS ASSIGNMENT
ANOVA
df SS MS F Significance
F
Regression 1 52494.76559 52494.77 1.734708 0.190882
Residual 98 2965621.093 30261.44
Total 99 3018115.858
Table 3: Regression analysis ANOVA test for stress and GRE scores
Coefficien
ts
Standard
Error
t Stat P-
value
Lower
95%
Upper
95%
Lower
95.0%
Upper
95.0%
Interce
pt
372.01517
18
41.218002
19
9.0255
51
1.57E-
14
290.219
4
453.811 290.2194 453.811
POASSE
RT
-
8.2576745
78
6.2696681
82
-
1.3170
8
0.1908
82
-
20.6996
4.18427
8
-20.6996 4.184278
Table 4: Regression analysis estimated coefficients for stress and GRE scores
Next it was of interest to verify whether the tutoring program was actually able to impact
significant positive change in the scores of the students. The following table gives the numerical
summary for the scores of the students for before the tutorship program and after the program. It
was seen that the median score for the pre-tutor stage is 316.15 which is lower than the post-tutor
stage which is 351.8 with range value 592.74 and 593.41 respectively. The estimated average
was 293.58 and 327.40 respectively and the standard deviation was 181.3 and 174.6 respectively.
The maximum was found to be 594.89 and 594.09 respectively while the minimum was 2.15 and
0.68 respectively.
GRE before and after Tutoring program
PRE POST
Median 316.15 351.18
Range 592.74 593.41
Mean 293.58 327.40
Standard Deviation 181.30 174.60
Maximum 594.89 594.09
Minimum 2.15 0.68
Table 5: Descriptive measures for GRE scores for before and after tutoring program
⊘ This is a preview!⊘
Do you want full access?
Subscribe today to unlock all pages.
Trusted by 1+ million students worldwide
9
STATISTICS ASSIGNMENT
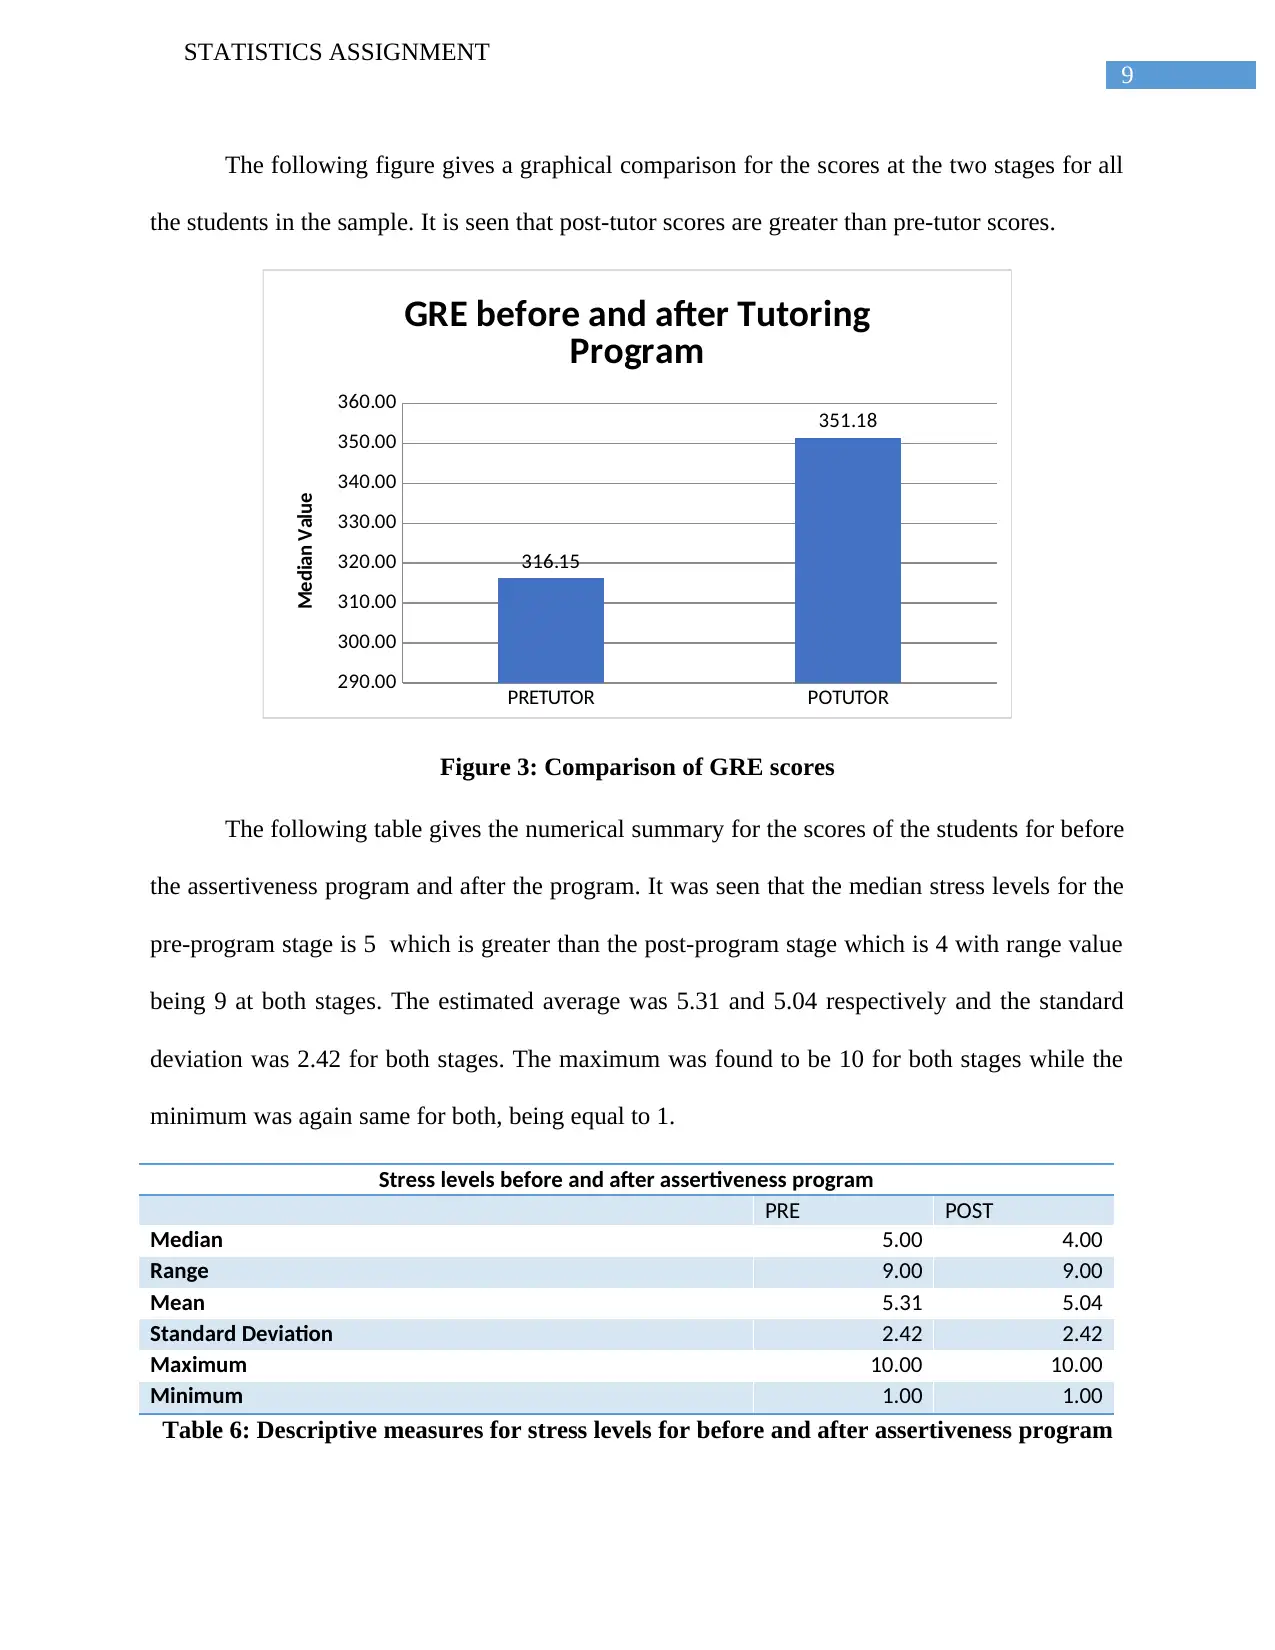
The following figure gives a graphical comparison for the scores at the two stages for all
the students in the sample. It is seen that post-tutor scores are greater than pre-tutor scores.
PRETUTOR POTUTOR
290.00
300.00
310.00
320.00
330.00
340.00
350.00
360.00
316.15
351.18
GRE before and after Tutoring
Program
Median Value
Figure 3: Comparison of GRE scores
The following table gives the numerical summary for the scores of the students for before
the assertiveness program and after the program. It was seen that the median stress levels for the
pre-program stage is 5 which is greater than the post-program stage which is 4 with range value
being 9 at both stages. The estimated average was 5.31 and 5.04 respectively and the standard
deviation was 2.42 for both stages. The maximum was found to be 10 for both stages while the
minimum was again same for both, being equal to 1.
Stress levels before and after assertiveness program
PRE POST
Median 5.00 4.00
Range 9.00 9.00
Mean 5.31 5.04
Standard Deviation 2.42 2.42
Maximum 10.00 10.00
Minimum 1.00 1.00
Table 6: Descriptive measures for stress levels for before and after assertiveness program
STATISTICS ASSIGNMENT
The following figure gives a graphical comparison for the scores at the two stages for all
the students in the sample. It is seen that post-tutor scores are greater than pre-tutor scores.
PRETUTOR POTUTOR
290.00
300.00
310.00
320.00
330.00
340.00
350.00
360.00
316.15
351.18
GRE before and after Tutoring
Program
Median Value
Figure 3: Comparison of GRE scores
The following table gives the numerical summary for the scores of the students for before
the assertiveness program and after the program. It was seen that the median stress levels for the
pre-program stage is 5 which is greater than the post-program stage which is 4 with range value
being 9 at both stages. The estimated average was 5.31 and 5.04 respectively and the standard
deviation was 2.42 for both stages. The maximum was found to be 10 for both stages while the
minimum was again same for both, being equal to 1.
Stress levels before and after assertiveness program
PRE POST
Median 5.00 4.00
Range 9.00 9.00
Mean 5.31 5.04
Standard Deviation 2.42 2.42
Maximum 10.00 10.00
Minimum 1.00 1.00
Table 6: Descriptive measures for stress levels for before and after assertiveness program
Paraphrase This Document
Need a fresh take? Get an instant paraphrase of this document with our AI Paraphraser
10
STATISTICS ASSIGNMENT
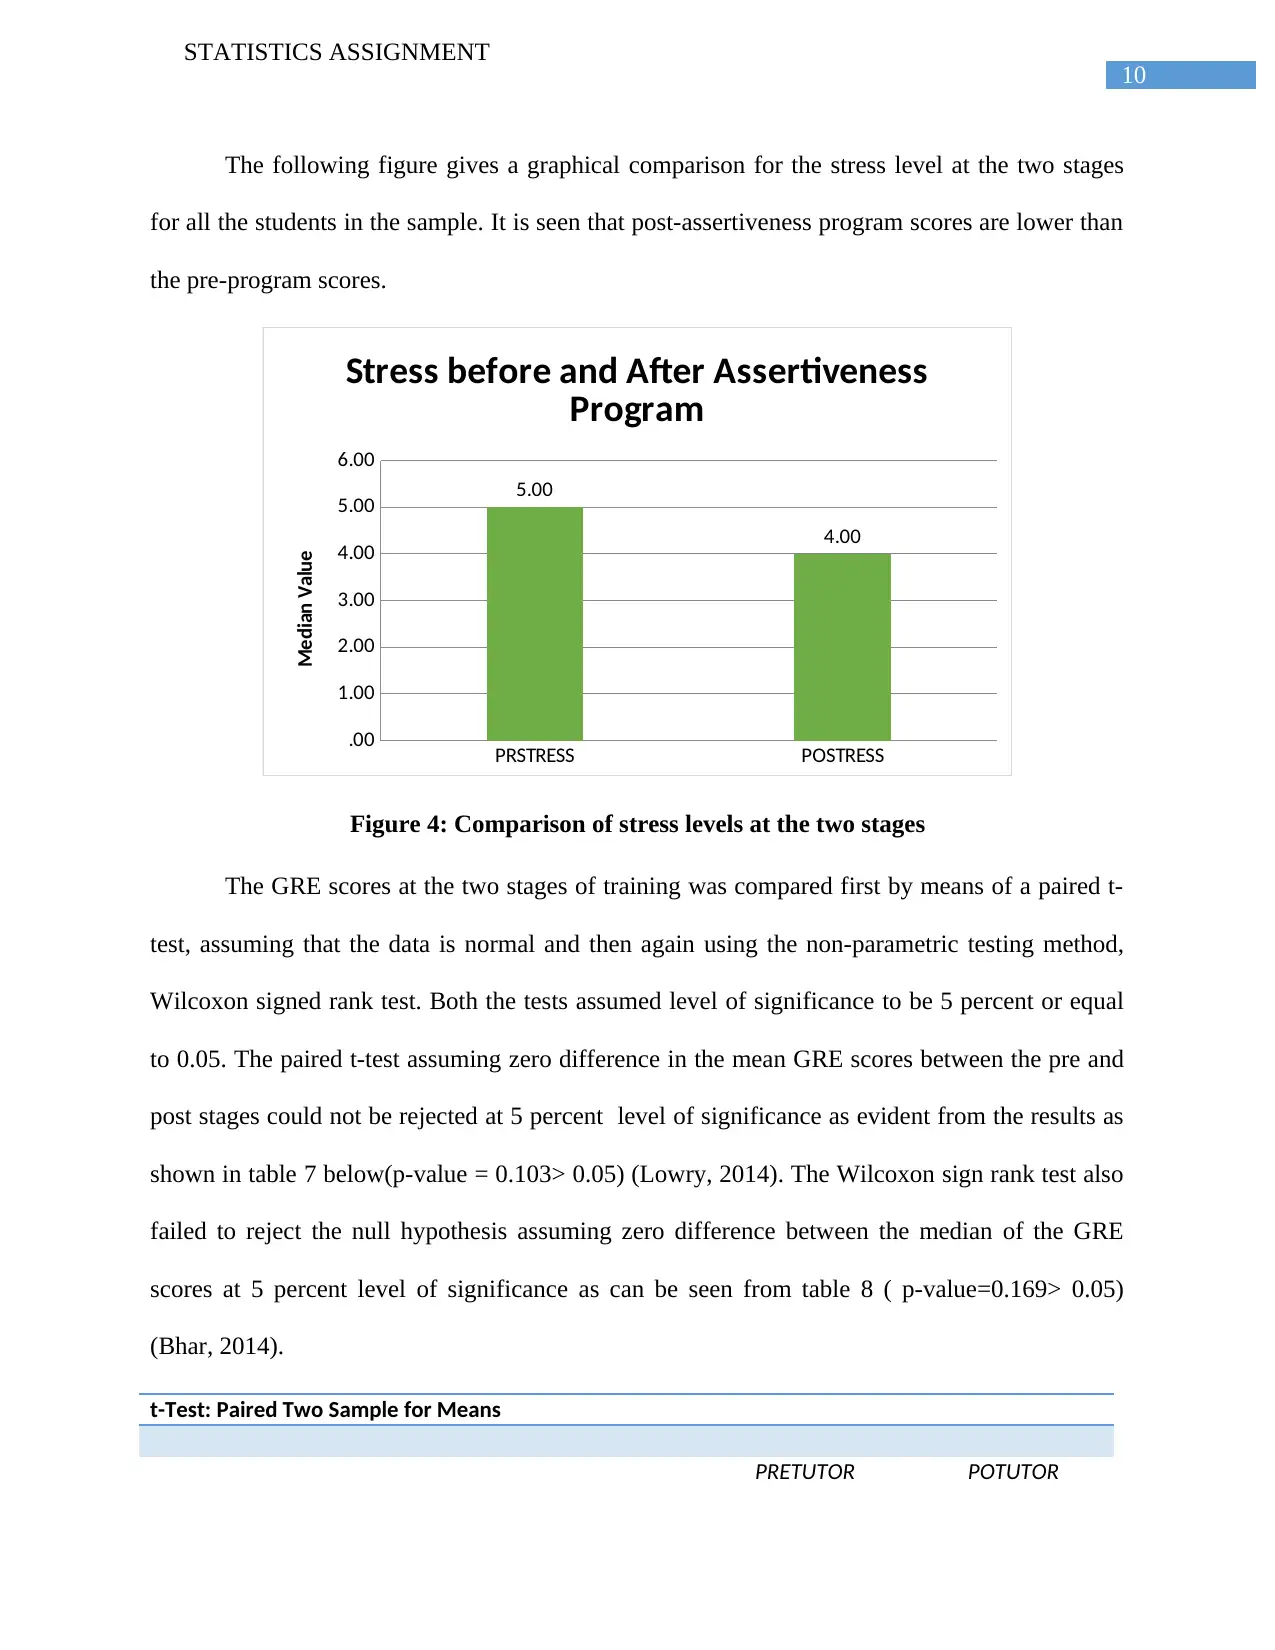
The following figure gives a graphical comparison for the stress level at the two stages
for all the students in the sample. It is seen that post-assertiveness program scores are lower than
the pre-program scores.
PRSTRESS POSTRESS
.00
1.00
2.00
3.00
4.00
5.00
6.00
5.00
4.00
Stress before and After Assertiveness
Program
Median Value
Figure 4: Comparison of stress levels at the two stages
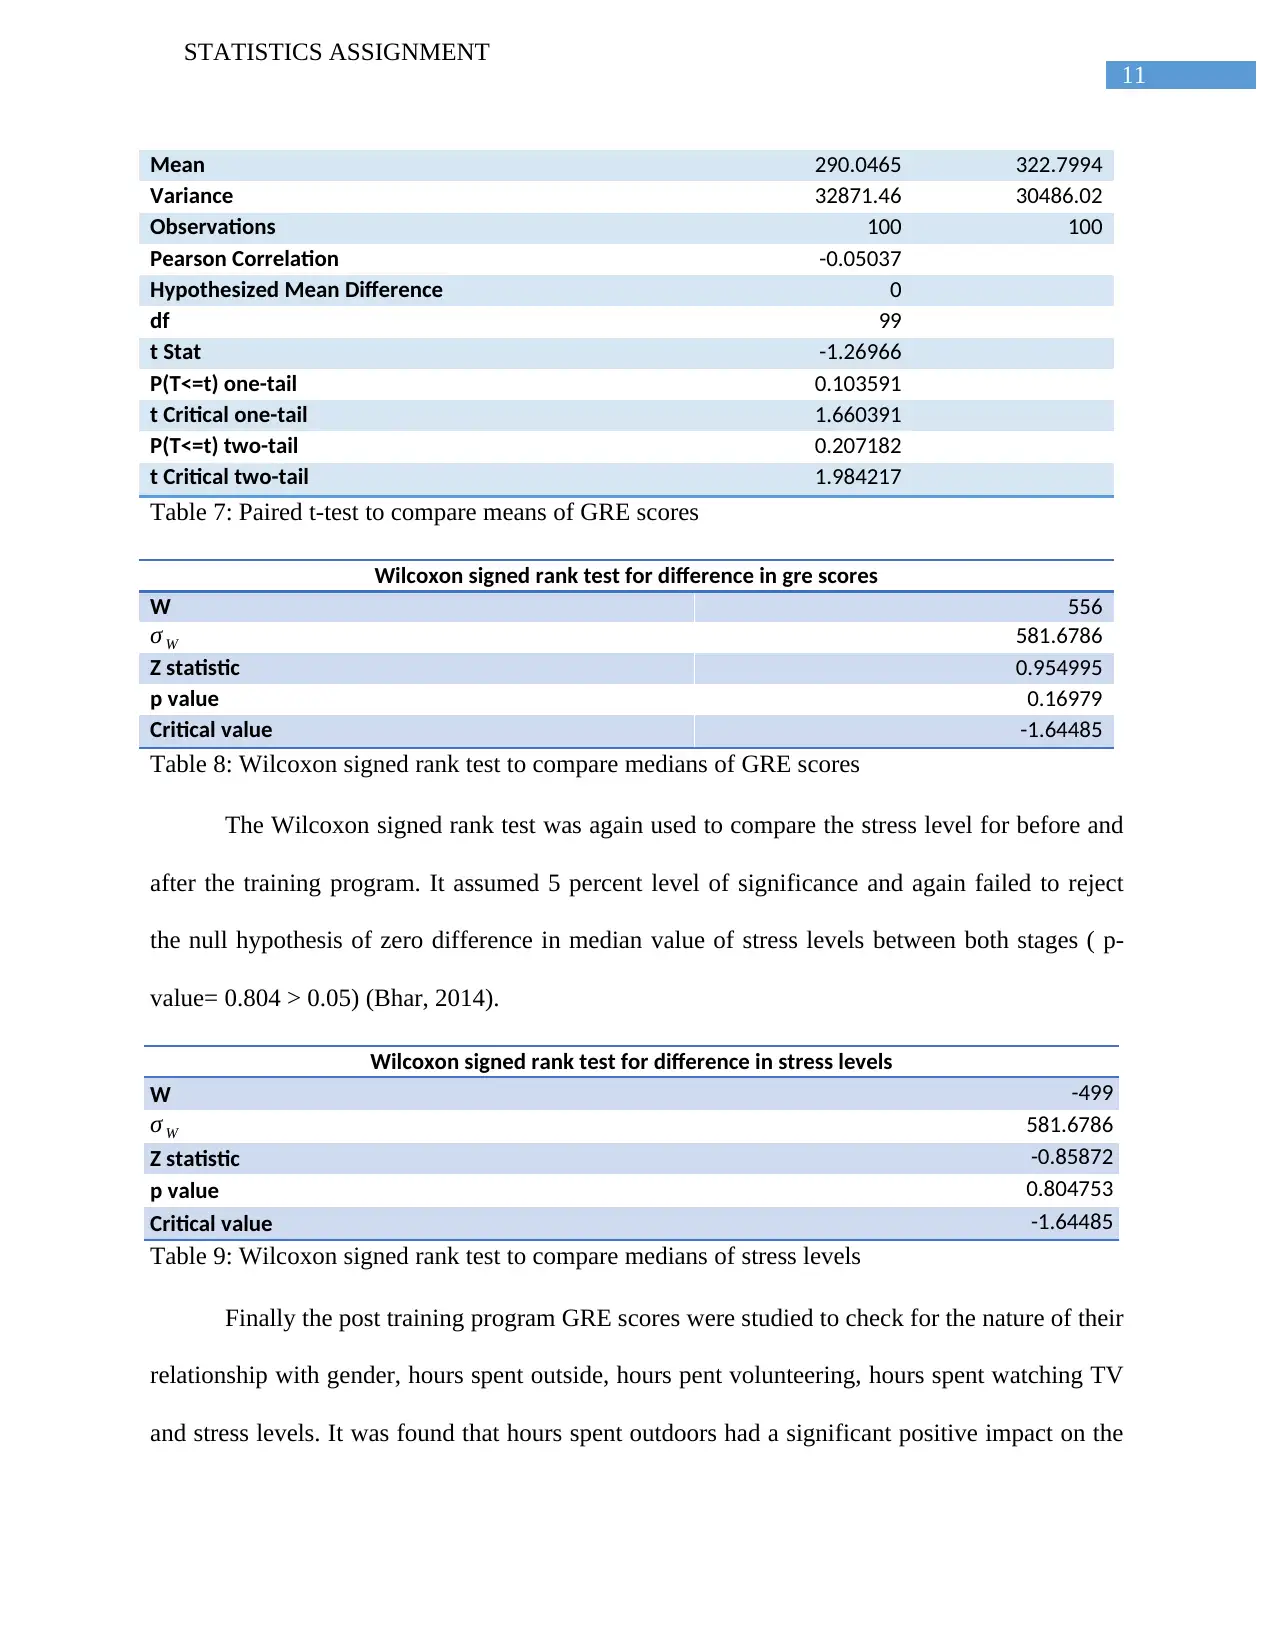
The GRE scores at the two stages of training was compared first by means of a paired t-
test, assuming that the data is normal and then again using the non-parametric testing method,
Wilcoxon signed rank test. Both the tests assumed level of significance to be 5 percent or equal
to 0.05. The paired t-test assuming zero difference in the mean GRE scores between the pre and
post stages could not be rejected at 5 percent level of significance as evident from the results as
shown in table 7 below(p-value = 0.103> 0.05) (Lowry, 2014). The Wilcoxon sign rank test also
failed to reject the null hypothesis assuming zero difference between the median of the GRE
scores at 5 percent level of significance as can be seen from table 8 ( p-value=0.169> 0.05)
(Bhar, 2014).
t-Test: Paired Two Sample for Means
PRETUTOR POTUTOR
STATISTICS ASSIGNMENT
The following figure gives a graphical comparison for the stress level at the two stages
for all the students in the sample. It is seen that post-assertiveness program scores are lower than
the pre-program scores.
PRSTRESS POSTRESS
.00
1.00
2.00
3.00
4.00
5.00
6.00
5.00
4.00
Stress before and After Assertiveness
Program
Median Value
Figure 4: Comparison of stress levels at the two stages
The GRE scores at the two stages of training was compared first by means of a paired t-
test, assuming that the data is normal and then again using the non-parametric testing method,
Wilcoxon signed rank test. Both the tests assumed level of significance to be 5 percent or equal
to 0.05. The paired t-test assuming zero difference in the mean GRE scores between the pre and
post stages could not be rejected at 5 percent level of significance as evident from the results as
shown in table 7 below(p-value = 0.103> 0.05) (Lowry, 2014). The Wilcoxon sign rank test also
failed to reject the null hypothesis assuming zero difference between the median of the GRE
scores at 5 percent level of significance as can be seen from table 8 ( p-value=0.169> 0.05)
(Bhar, 2014).
t-Test: Paired Two Sample for Means
PRETUTOR POTUTOR
11
STATISTICS ASSIGNMENT
Mean 290.0465 322.7994
Variance 32871.46 30486.02
Observations 100 100
Pearson Correlation -0.05037
Hypothesized Mean Difference 0
df 99
t Stat -1.26966
P(T<=t) one-tail 0.103591
t Critical one-tail 1.660391
P(T<=t) two-tail 0.207182
t Critical two-tail 1.984217
Table 7: Paired t-test to compare means of GRE scores
Wilcoxon signed rank test for difference in gre scores
W 556
σ W 581.6786
Z statistic 0.954995
p value 0.16979
Critical value -1.64485
Table 8: Wilcoxon signed rank test to compare medians of GRE scores
The Wilcoxon signed rank test was again used to compare the stress level for before and
after the training program. It assumed 5 percent level of significance and again failed to reject
the null hypothesis of zero difference in median value of stress levels between both stages ( p-
value= 0.804 > 0.05) (Bhar, 2014).
Wilcoxon signed rank test for difference in stress levels
W -499
σ W 581.6786
Z statistic -0.85872
p value 0.804753
Critical value -1.64485
Table 9: Wilcoxon signed rank test to compare medians of stress levels
Finally the post training program GRE scores were studied to check for the nature of their
relationship with gender, hours spent outside, hours pent volunteering, hours spent watching TV
and stress levels. It was found that hours spent outdoors had a significant positive impact on the
⊘ This is a preview!⊘
Do you want full access?
Subscribe today to unlock all pages.
Trusted by 1+ million students worldwide
1 out of 15
Related Documents


Your All-in-One AI-Powered Toolkit for Academic Success.
+13062052269
info@desklib.com
Available 24*7 on WhatsApp / Email
![[object Object]](/_next/static/media/star-bottom.7253800d.svg)
Unlock your academic potential
Copyright © 2020–2026 A2Z Services. All Rights Reserved. Developed and managed by ZUCOL.