Statistics for Managerial Decision Making: Assignment 2 Analysis

Verified

Added on  2022/10/11

|10
|1025
|17
Homework Assignment
AI Summary
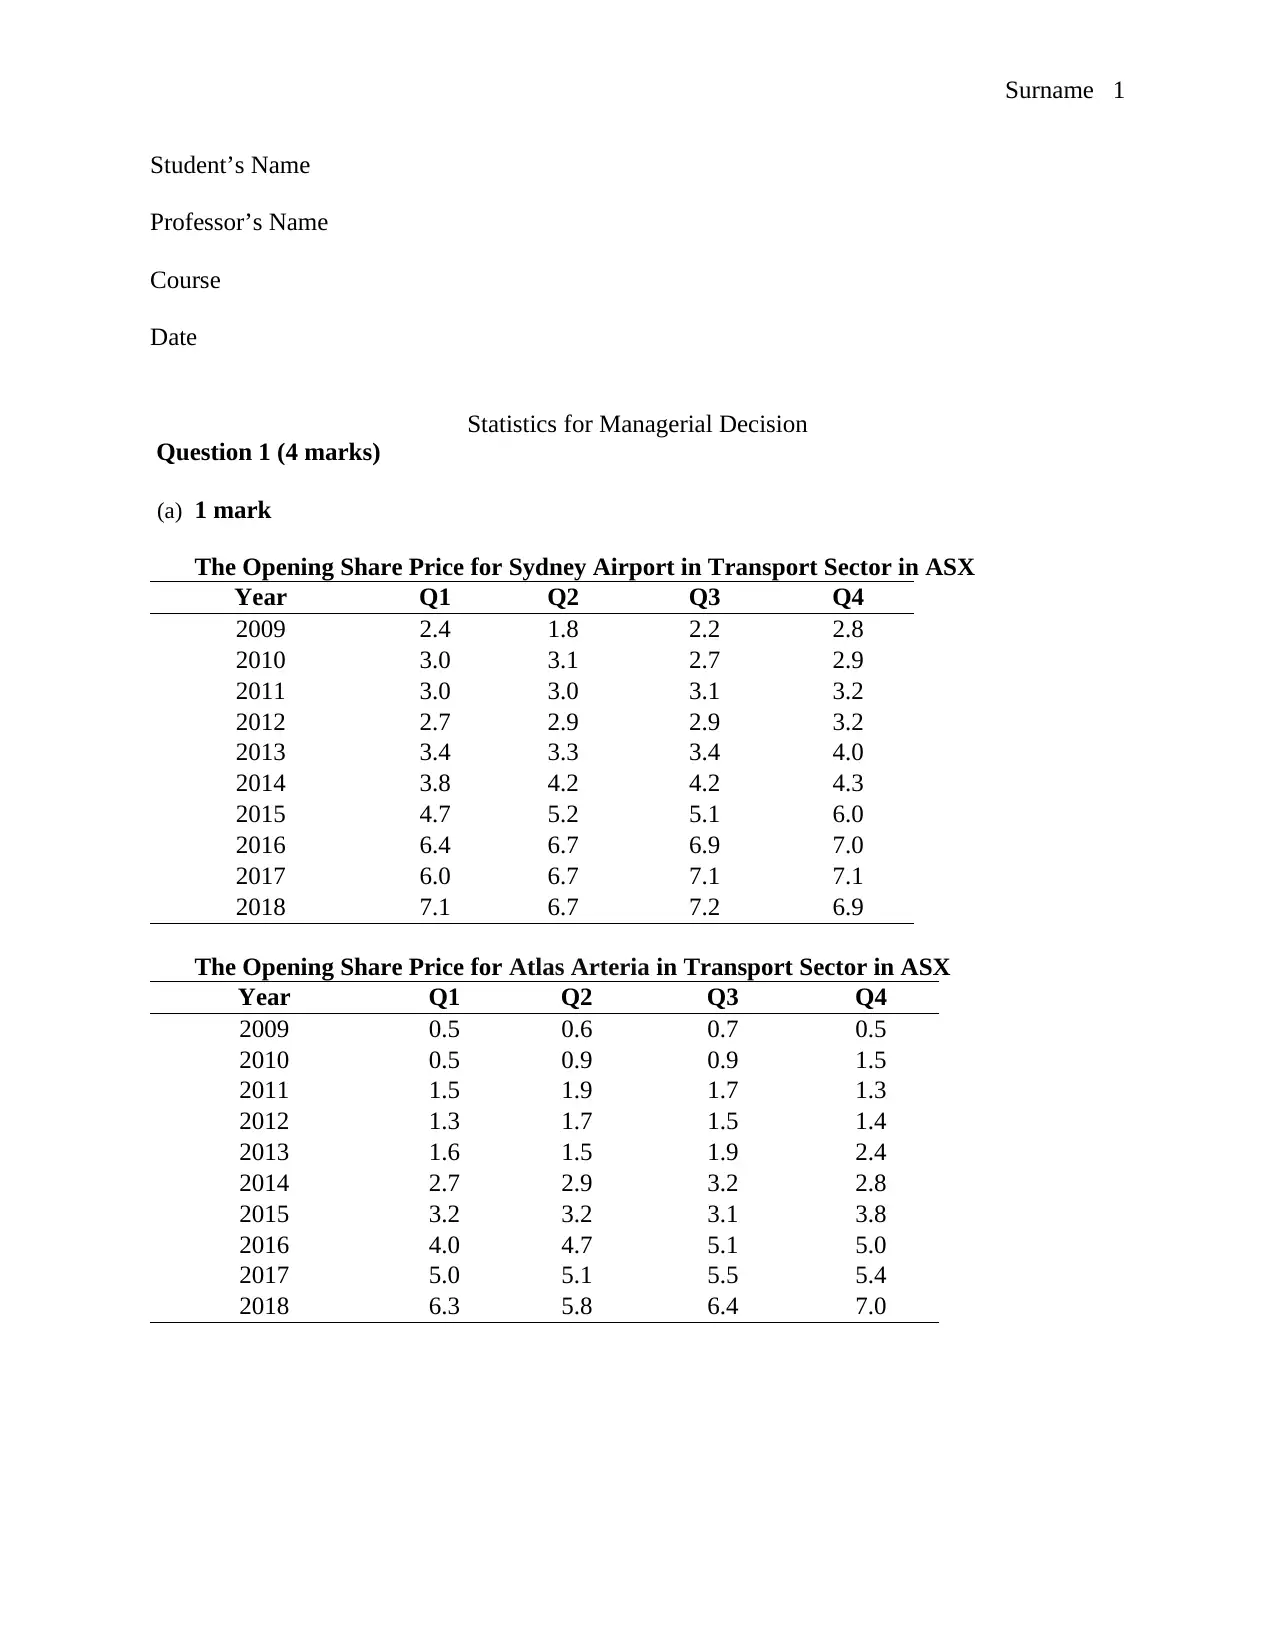
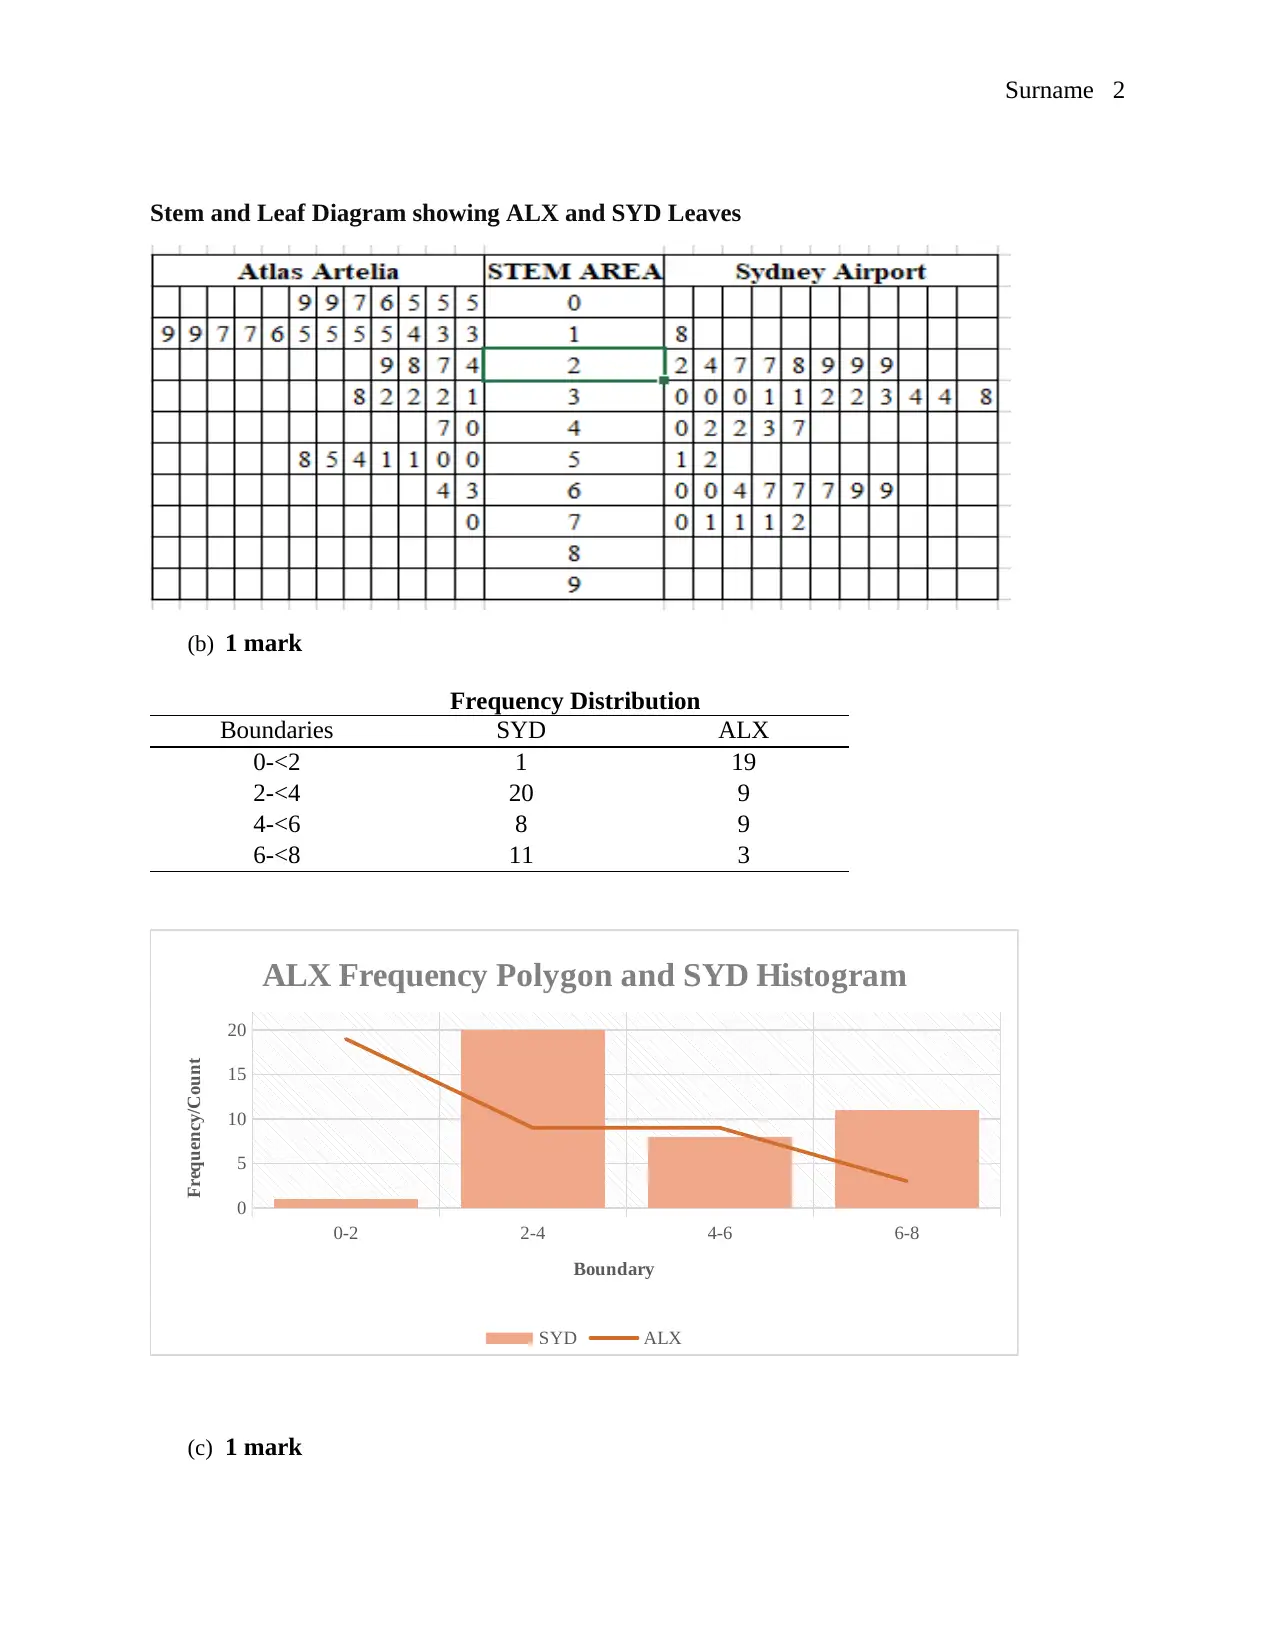
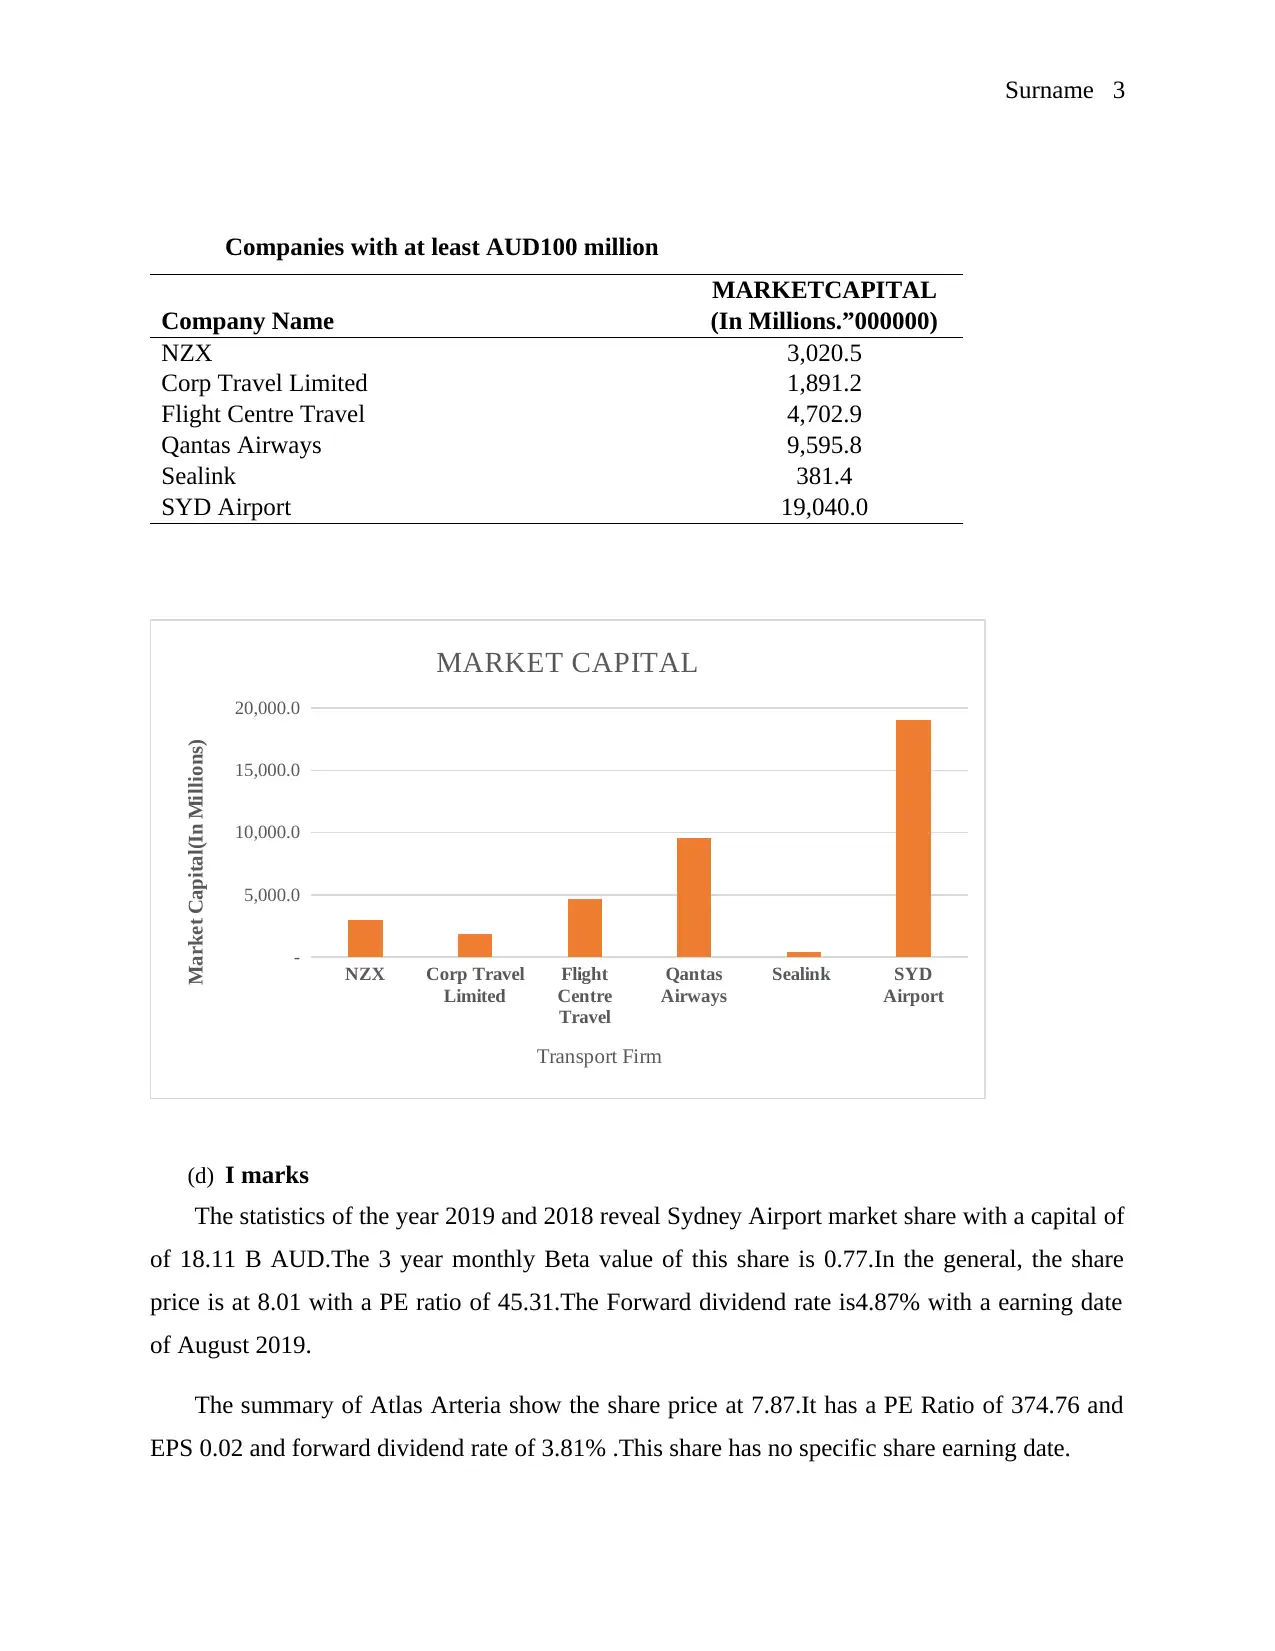
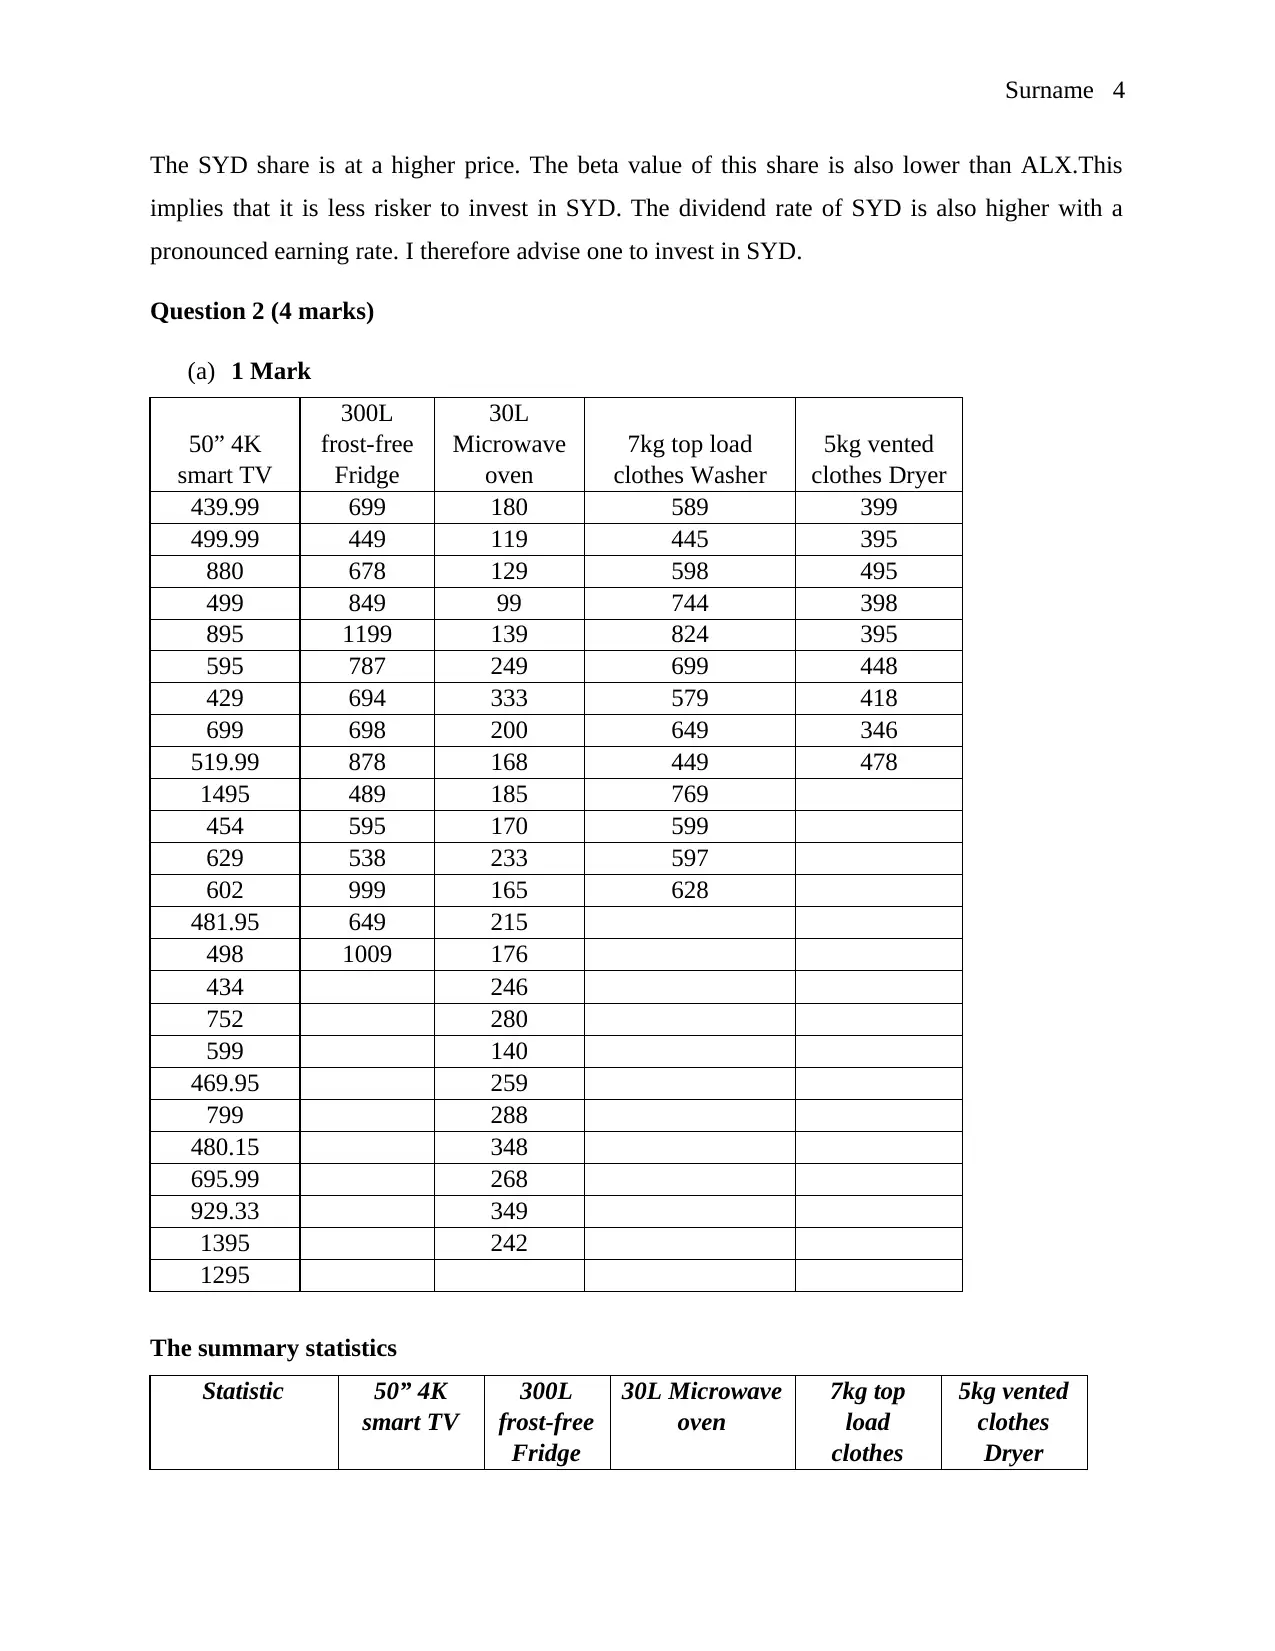
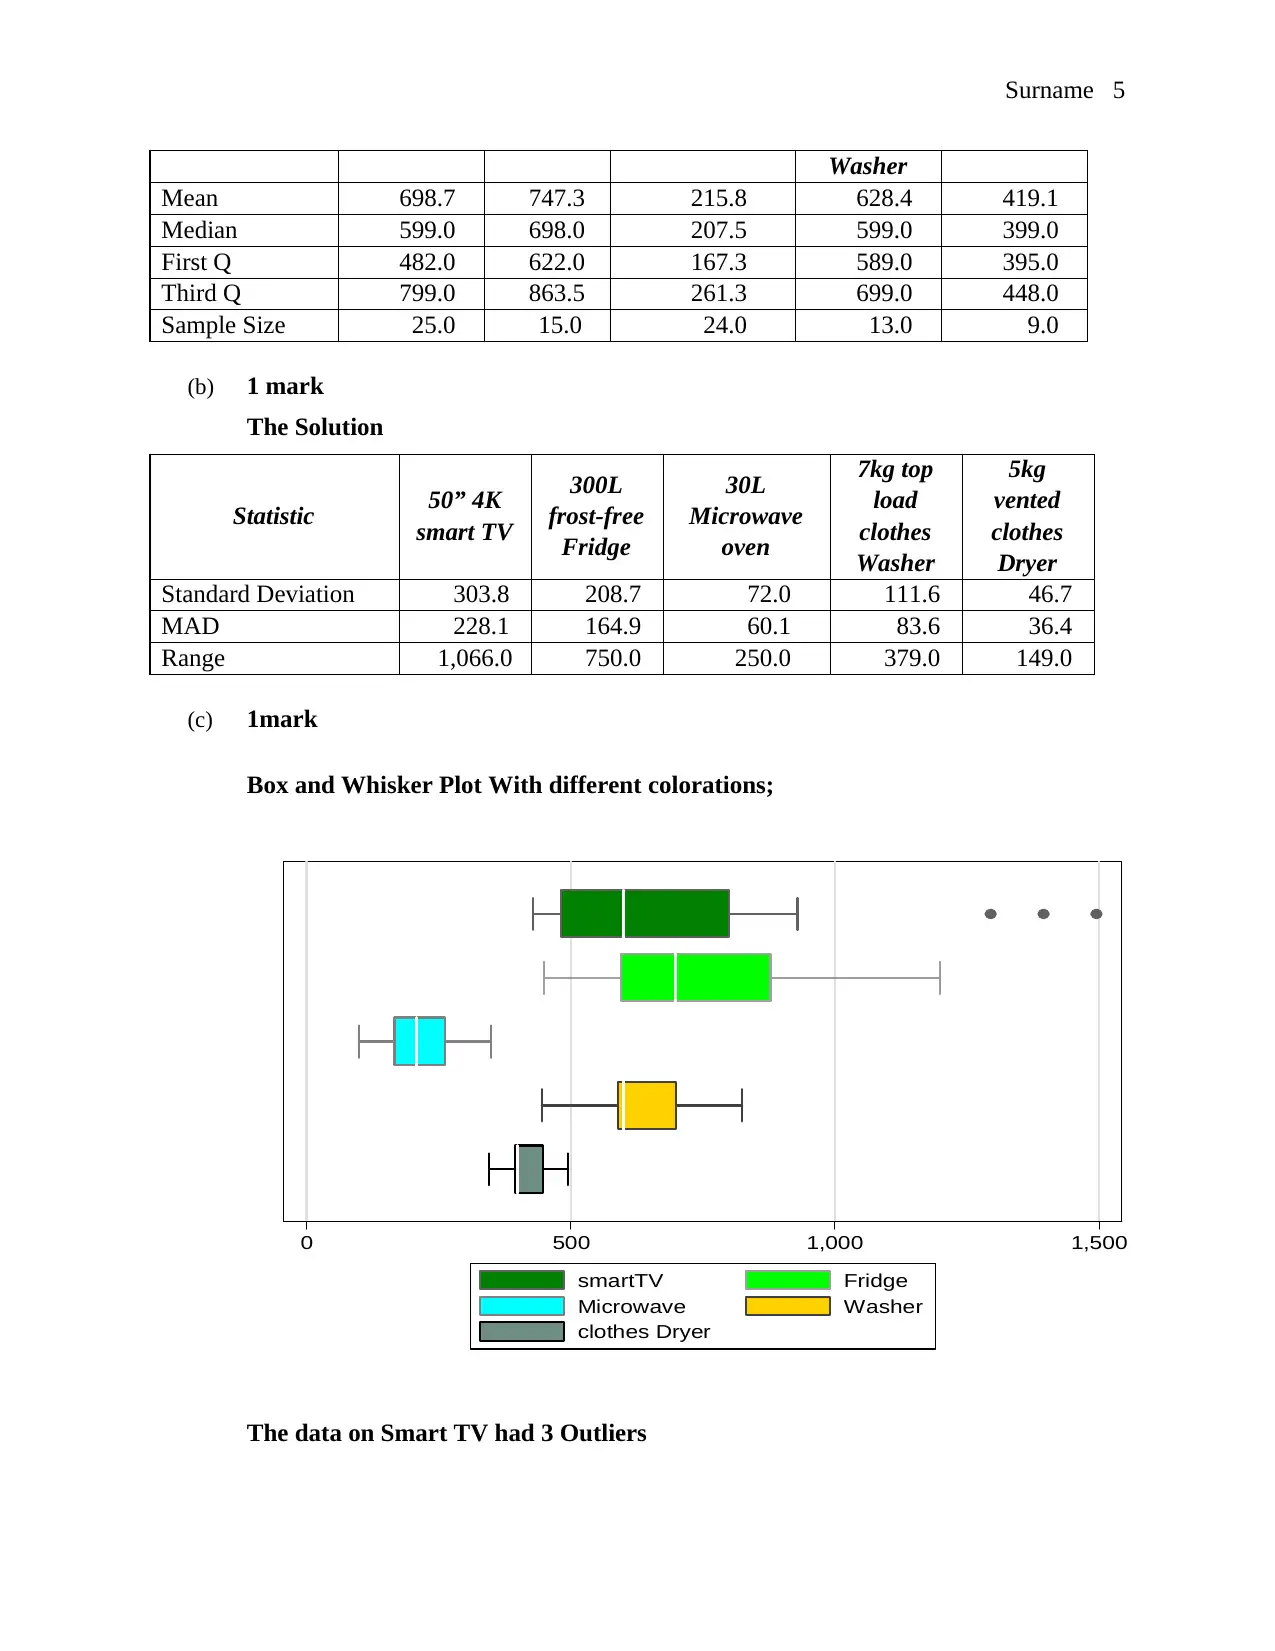
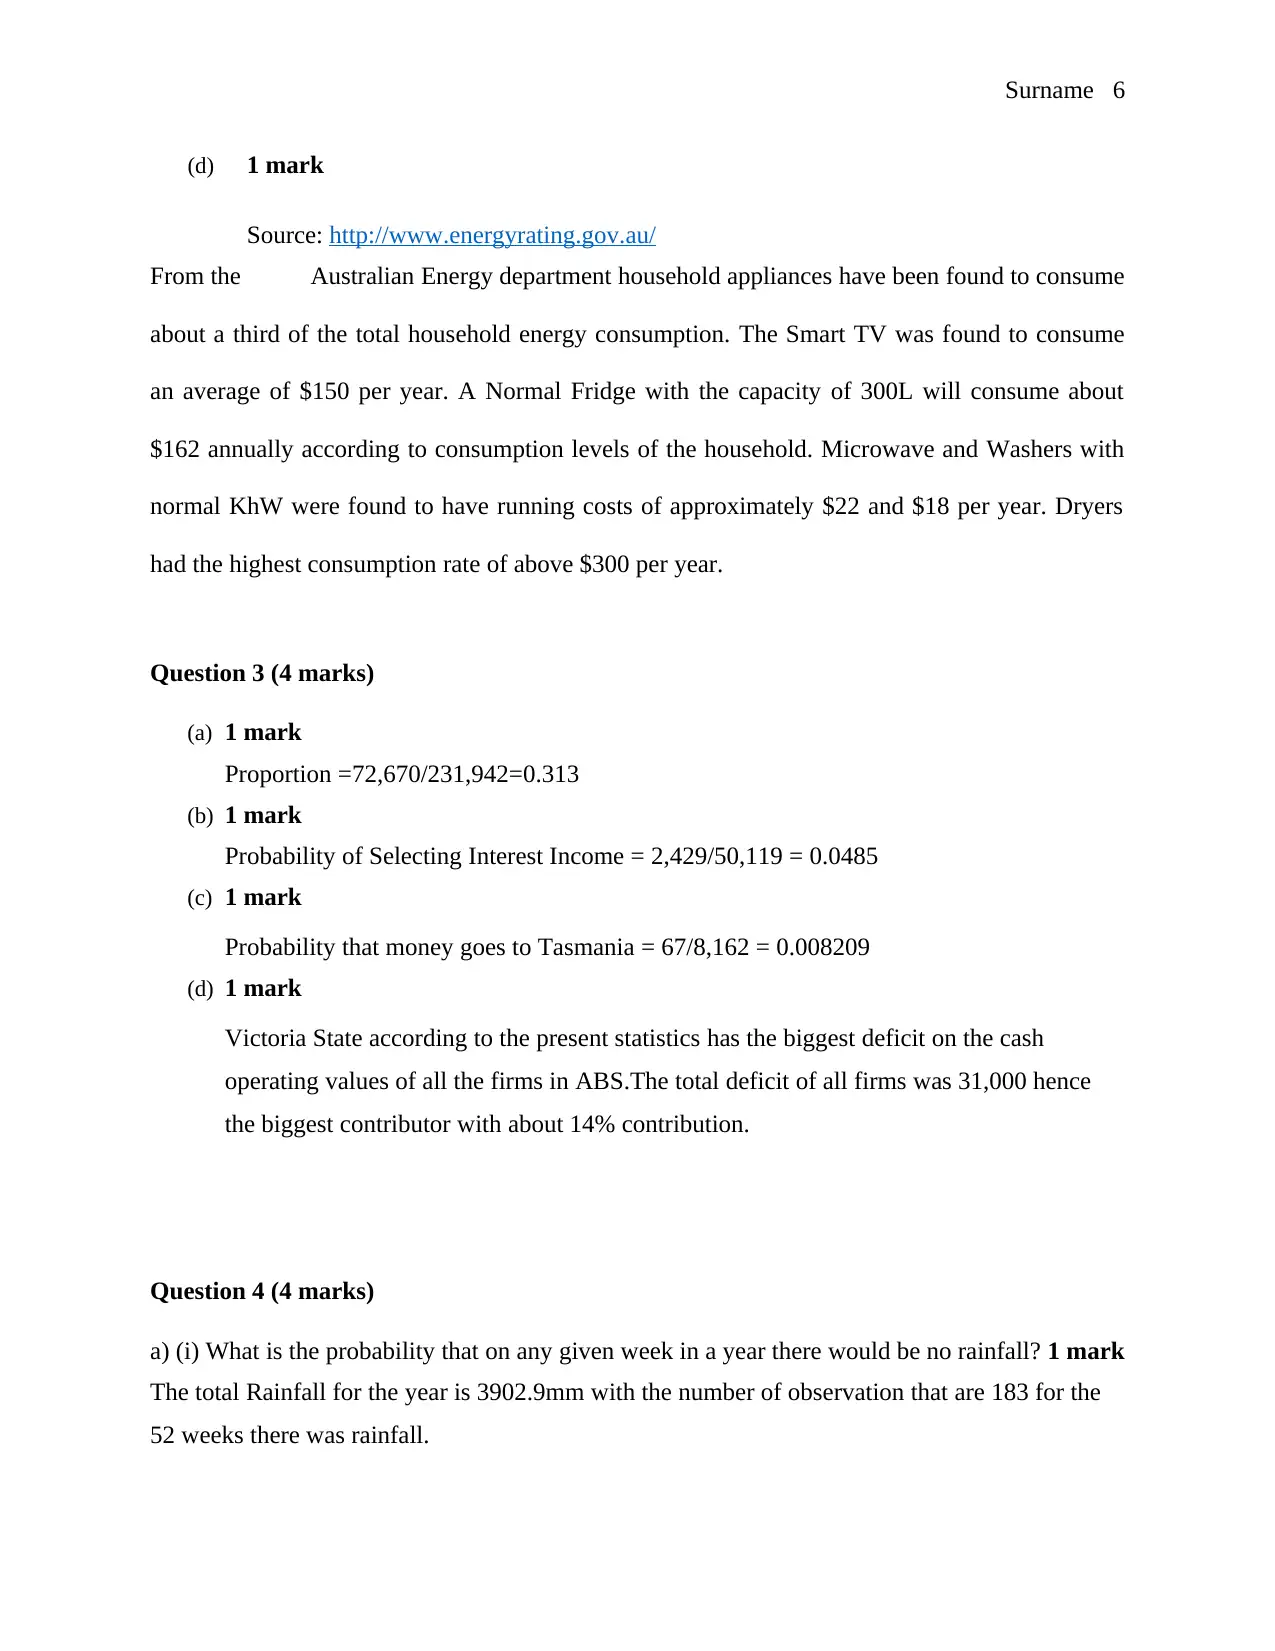
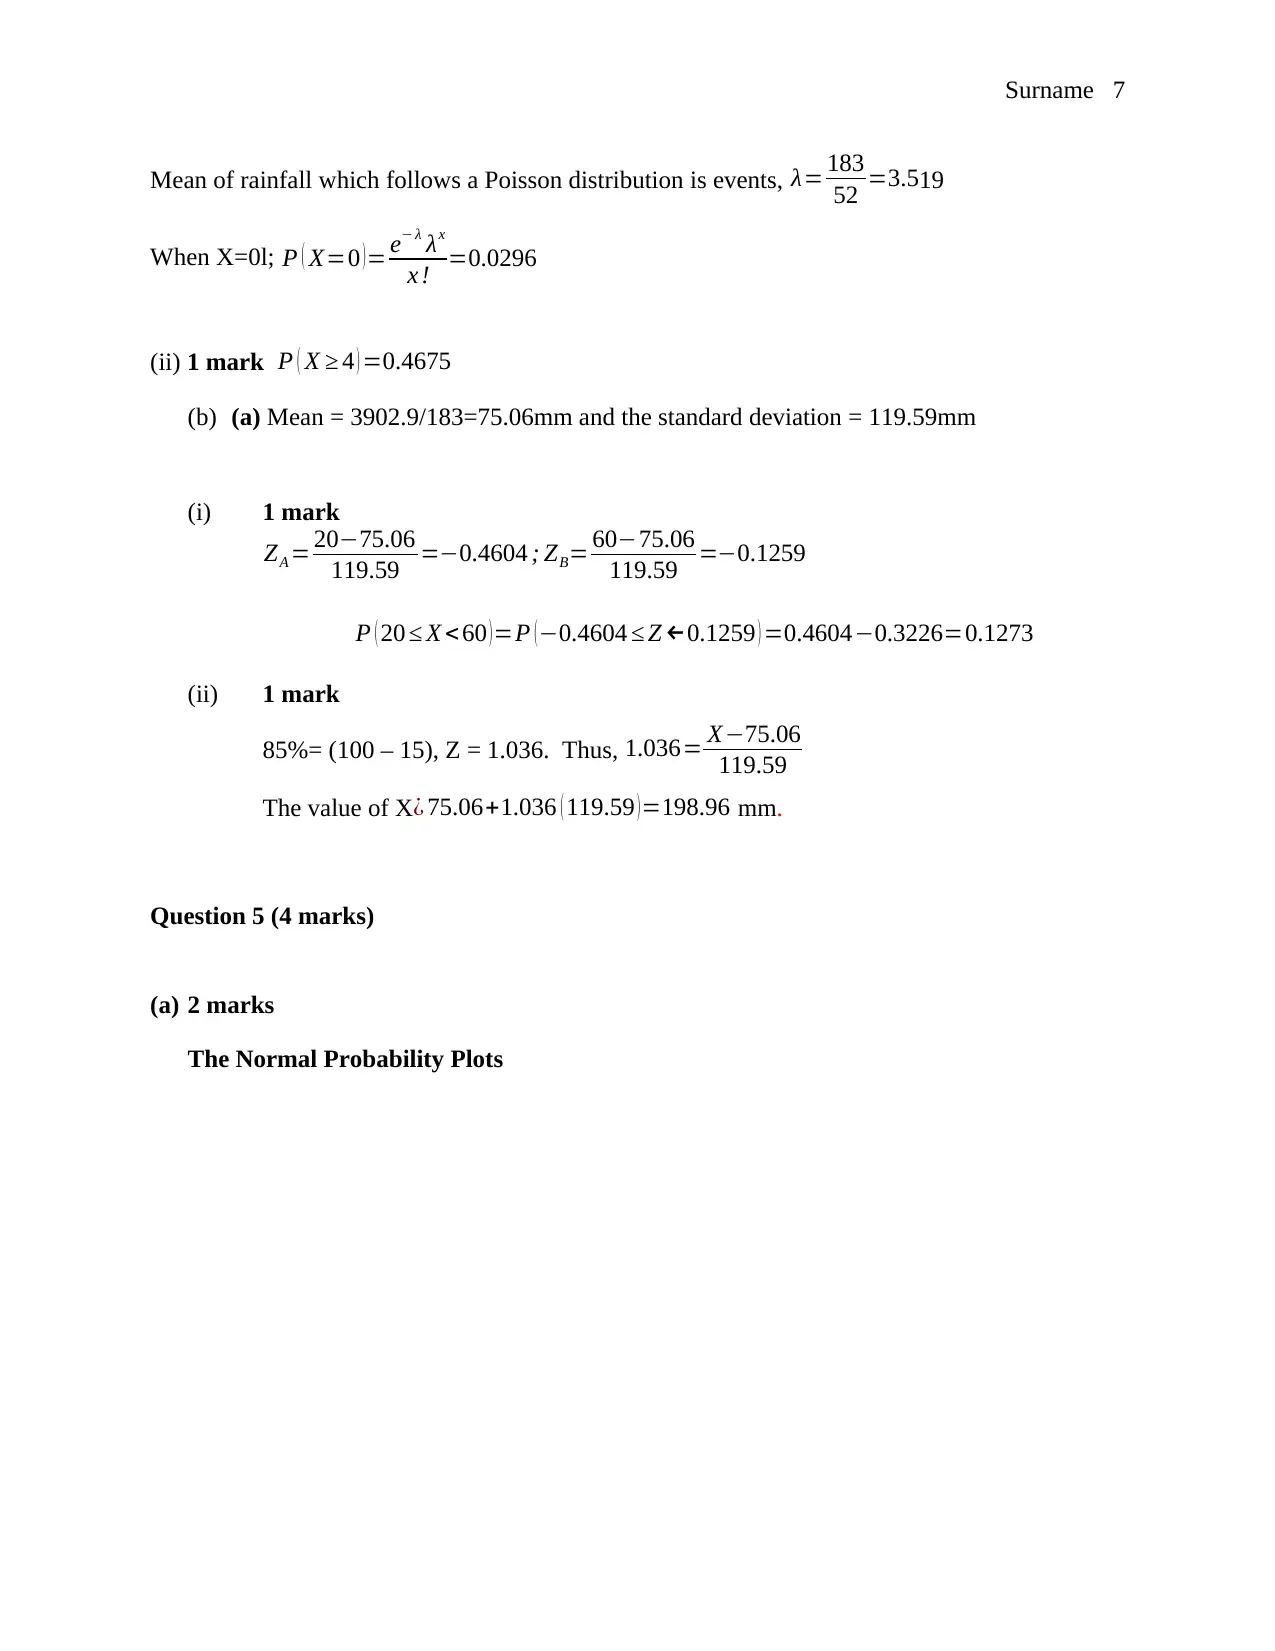
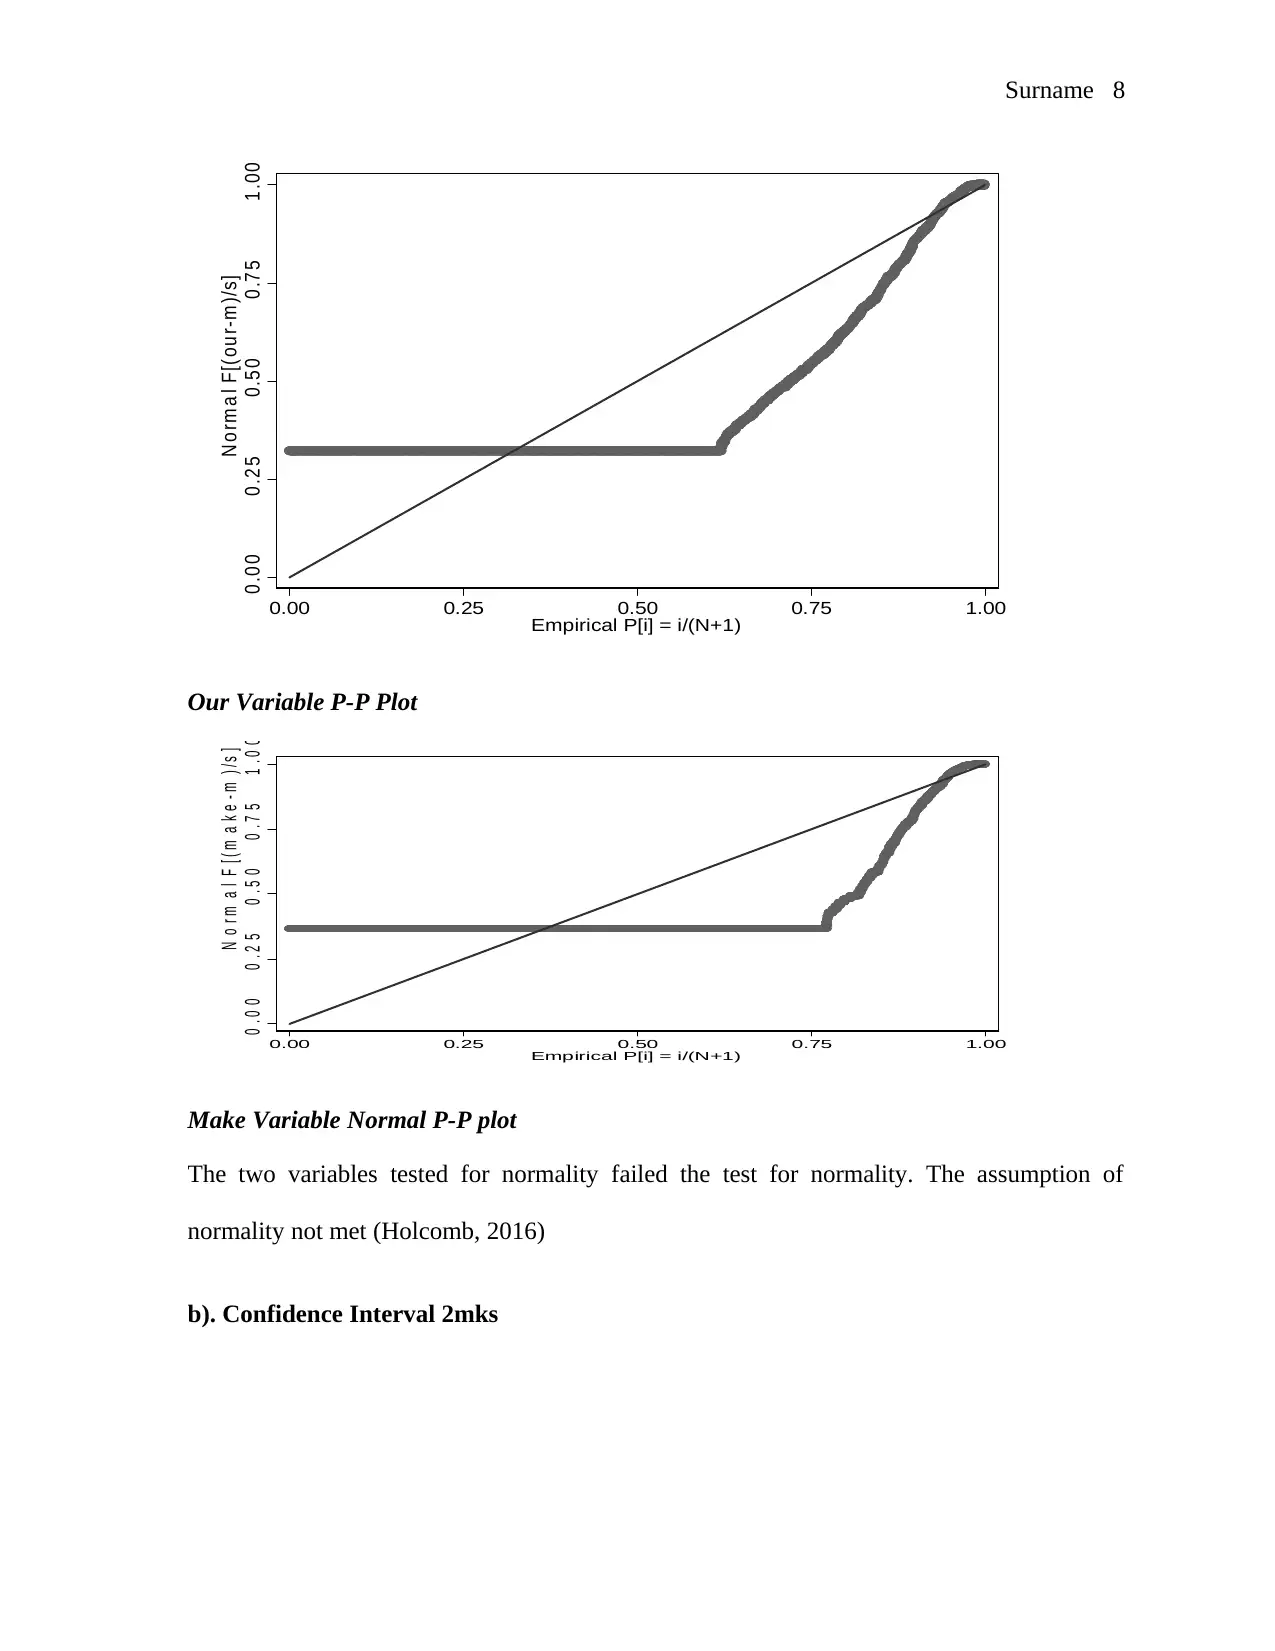
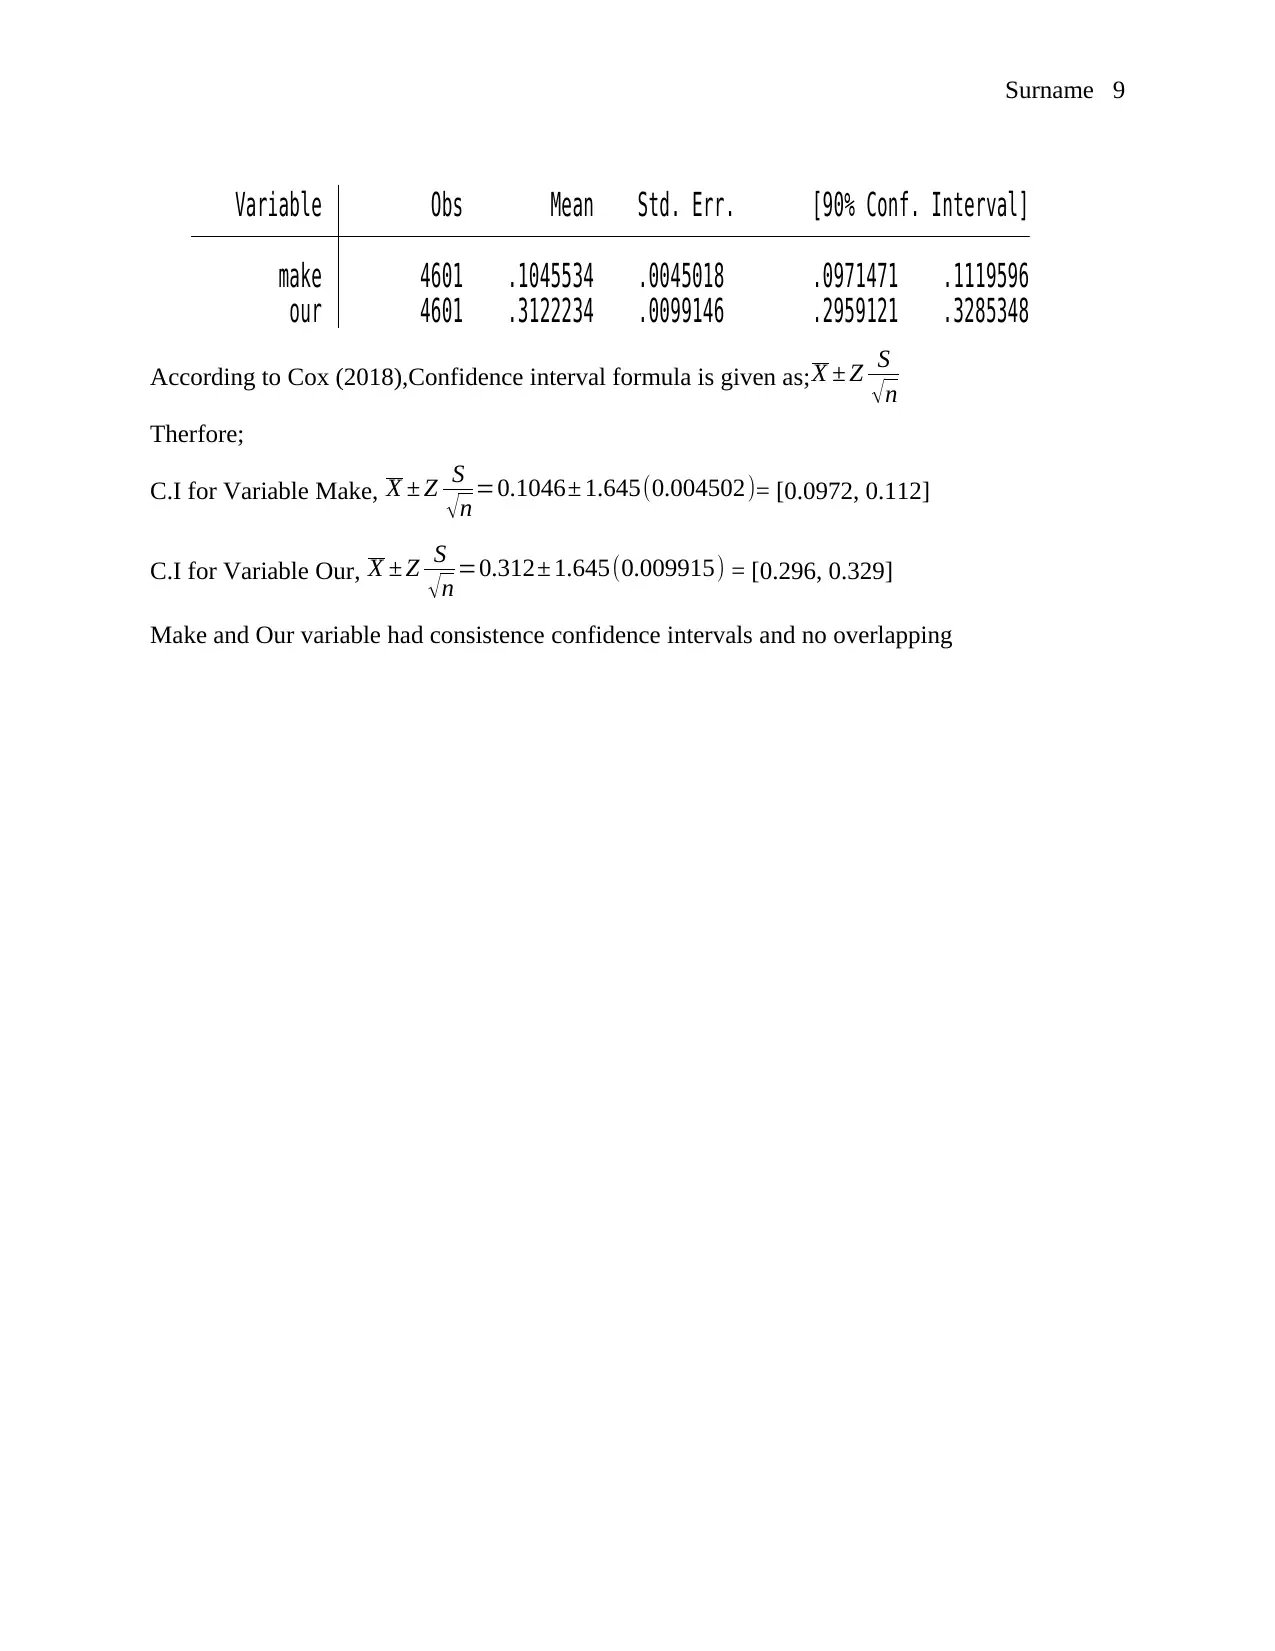
This statistics assignment solution covers various aspects of statistical analysis relevant to managerial decision-making. It begins with an analysis of Sydney Airport and Atlas Arteria share prices, including stem-and-leaf diagrams, market capitalization comparisons, and financial metrics like PE ratios and dividend rates. The assignment then explores the analysis of household appliance data, including the use of box and whisker plots and the impact of energy consumption. Further, it delves into probability calculations related to income, geographic distribution, and rainfall, incorporating concepts like Poisson distribution. Finally, the assignment concludes with an analysis of normality using probability plots and the calculation of confidence intervals for different variables. The solution provides detailed explanations and calculations, making it a comprehensive resource for students studying statistics.
Document Page
Surname 1
Student’s Name
Professor’s Name
Course
Date
Statistics for Managerial Decision
Question 1 (4 marks)
(a) 1 mark
The Opening Share Price for Sydney Airport in Transport Sector in ASX
Year Q1 Q2 Q3 Q4
2009 2.4 1.8 2.2 2.8
2010 3.0 3.1 2.7 2.9
2011 3.0 3.0 3.1 3.2
2012 2.7 2.9 2.9 3.2
2013 3.4 3.3 3.4 4.0
2014 3.8 4.2 4.2 4.3
2015 4.7 5.2 5.1 6.0
2016 6.4 6.7 6.9 7.0
2017 6.0 6.7 7.1 7.1
2018 7.1 6.7 7.2 6.9
The Opening Share Price for Atlas Arteria in Transport Sector in ASX
Year Q1 Q2 Q3 Q4
2009 0.5 0.6 0.7 0.5
2010 0.5 0.9 0.9 1.5
2011 1.5 1.9 1.7 1.3
2012 1.3 1.7 1.5 1.4
2013 1.6 1.5 1.9 2.4
2014 2.7 2.9 3.2 2.8
2015 3.2 3.2 3.1 3.8
2016 4.0 4.7 5.1 5.0
2017 5.0 5.1 5.5 5.4
2018 6.3 5.8 6.4 7.0
tabler-icon-diamond-filled.svg

Paraphrase This Document

Need a fresh take? Get an instant paraphrase of this document with our AI Paraphraser
Document Page
Surname 2
Stem and Leaf Diagram showing ALX and SYD Leaves
(b) 1 mark
Frequency Distribution
Boundaries SYD ALX
0-<2 1 19
2-<4 20 9
4-<6 8 9
6-<8 11 3
0-2 2-4 4-6 6-8
0
5
10
15
20
ALX Frequency Polygon and SYD Histogram
SYD ALX
Boundary
Frequency/Count
(c) 1 mark
Document Page
Surname 3
Companies with at least AUD100 million
Company Name
MARKETCAPITAL
(In Millions.”000000)
NZX 3,020.5
Corp Travel Limited 1,891.2
Flight Centre Travel 4,702.9
Qantas Airways 9,595.8
Sealink 381.4
SYD Airport 19,040.0
NZX Corp Travel
Limited
Flight
Centre
Travel
Qantas
Airways
Sealink SYD
Airport
-
5,000.0
10,000.0
15,000.0
20,000.0
MARKET CAPITAL
Transport Firm
Market Capital(In Millions)
(d) I marks
The statistics of the year 2019 and 2018 reveal Sydney Airport market share with a capital of
of 18.11 B AUD.The 3 year monthly Beta value of this share is 0.77.In the general, the share
price is at 8.01 with a PE ratio of 45.31.The Forward dividend rate is4.87% with a earning date
of August 2019.
The summary of Atlas Arteria show the share price at 7.87.It has a PE Ratio of 374.76 and
EPS 0.02 and forward dividend rate of 3.81% .This share has no specific share earning date.
Document Page
Surname 4
The SYD share is at a higher price. The beta value of this share is also lower than ALX.This
implies that it is less risker to invest in SYD. The dividend rate of SYD is also higher with a
pronounced earning rate. I therefore advise one to invest in SYD.
Question 2 (4 marks)
(a) 1 Mark
50” 4K
smart TV
300L
frost-free
Fridge
30L
Microwave
oven
7kg top load
clothes Washer
5kg vented
clothes Dryer
439.99 699 180 589 399
499.99 449 119 445 395
880 678 129 598 495
499 849 99 744 398
895 1199 139 824 395
595 787 249 699 448
429 694 333 579 418
699 698 200 649 346
519.99 878 168 449 478
1495 489 185 769
454 595 170 599
629 538 233 597
602 999 165 628
481.95 649 215
498 1009 176
434 246
752 280
599 140
469.95 259
799 288
480.15 348
695.99 268
929.33 349
1395 242
1295
The summary statistics
Statistic 50” 4K
smart TV
300L
frost-free
Fridge
30L Microwave
oven
7kg top
load
clothes
5kg vented
clothes
Dryer
tabler-icon-diamond-filled.svg

Paraphrase This Document

Need a fresh take? Get an instant paraphrase of this document with our AI Paraphraser
Document Page
Surname 5
Washer
Mean 698.7 747.3 215.8 628.4 419.1
Median 599.0 698.0 207.5 599.0 399.0
First Q 482.0 622.0 167.3 589.0 395.0
Third Q 799.0 863.5 261.3 699.0 448.0
Sample Size 25.0 15.0 24.0 13.0 9.0
(b) 1 mark
The Solution
Statistic 50” 4K
smart TV
300L
frost-free
Fridge
30L
Microwave
oven
7kg top
load
clothes
Washer
5kg
vented
clothes
Dryer
Standard Deviation 303.8 208.7 72.0 111.6 46.7
MAD 228.1 164.9 60.1 83.6 36.4
Range 1,066.0 750.0 250.0 379.0 149.0
(c) 1mark
Box and Whisker Plot With different colorations;
0 500 1,000 1,500
smartTV Fridge
Microwave Washer
clothes Dryer
The data on Smart TV had 3 Outliers
Document Page
Surname 6
(d) 1 mark
Source: http://www.energyrating.gov.au/
From the Australian Energy department household appliances have been found to consume
about a third of the total household energy consumption. The Smart TV was found to consume
an average of $150 per year. A Normal Fridge with the capacity of 300L will consume about
$162 annually according to consumption levels of the household. Microwave and Washers with
normal KhW were found to have running costs of approximately $22 and $18 per year. Dryers
had the highest consumption rate of above $300 per year.
Question 3 (4 marks)
(a) 1 mark
Proportion =72,670/231,942=0.313
(b) 1 mark
Probability of Selecting Interest Income = 2,429/50,119 = 0.0485
(c) 1 mark
Probability that money goes to Tasmania = 67/8,162 = 0.008209
(d) 1 mark
Victoria State according to the present statistics has the biggest deficit on the cash
operating values of all the firms in ABS.The total deficit of all firms was 31,000 hence
the biggest contributor with about 14% contribution.
Question 4 (4 marks)
a) (i) What is the probability that on any given week in a year there would be no rainfall? 1 mark
The total Rainfall for the year is 3902.9mm with the number of observation that are 183 for the
52 weeks there was rainfall.
Document Page
Surname 7
Mean of rainfall which follows a Poisson distribution is events, λ= 183
52 =3.519
When X=0l; P ( X=0 )= e λ λx
x ! =0.0296
(ii) 1 mark P ( X 4 ) =0.4675
(b) (a) Mean = 3902.9/183=75.06mm and the standard deviation = 119.59mm
(i) 1 mark
ZA = 2075.06
119.59 =0.4604 ; ZB= 6075.06
119.59 =0.1259
P ( 20 X < 60 ) =P ( 0.4604 Z 0.1259 ) =0.46040.3226=0.1273
(ii) 1 mark
85%= (100 – 15), Z = 1.036. Thus, 1.036= X75.06
119.59
The value of X¿ 75.06+1.036 ( 119.59 )=198.96 mm.
Question 5 (4 marks)
(a) 2 marks
The Normal Probability Plots
tabler-icon-diamond-filled.svg

Paraphrase This Document

Need a fresh take? Get an instant paraphrase of this document with our AI Paraphraser
Document Page
Surname 8
0 .0 0 0 .2 5 0 .5 0 0 .7 5 1 .0 0
N orm a l F [(ou r-m )/s]
0.00 0.25 0.50 0.75 1.00
Empirical P[i] = i/(N+1)
Our Variable P-P Plot
0 . 0 0 0 . 2 5 0 . 5 0 0 . 7 5 1 . 0 0
N o r m a l F [ ( m a k e - m ) / s ]
0.00 0.25 0.50 0.75 1.00
Empirical P[i] = i/(N+1)
Make Variable Normal P-P plot
The two variables tested for normality failed the test for normality. The assumption of
normality not met (Holcomb, 2016)
b). Confidence Interval 2mks
Document Page
Surname 9
our 4601 .3122234 .0099146 .2959121 .3285348
make 4601 .1045534 .0045018 .0971471 .1119596
Variable Obs Mean Std. Err. [90% Conf. Interval]
According to Cox (2018),Confidence interval formula is given as;X ± Z S
n
Therfore;
C.I for Variable Make, X ± Z S
n =0.1046± 1.645(0.004502)= [0.0972, 0.112]
C.I for Variable Our, X ± Z S
n =0.312± 1.645(0.009915) = [0.296, 0.329]
Make and Our variable had consistence confidence intervals and no overlapping
Document Page
Surname 10
Works Cited
Cox, D.R., 2018. Applied statistics-principles and examples. Routledge
Holcomb, Z.C., 2016. Fundamentals of descriptive statistics. Routledge.
chevron_up_icon
1 out of 10
circle_padding
hide_on_mobile
zoom_out_icon
[object Object]