Analysis of Australian Tax Lodgement Processes: Statistics Report
VerifiedAdded on 2020/05/28
|22
|3069
|147
Report
AI Summary
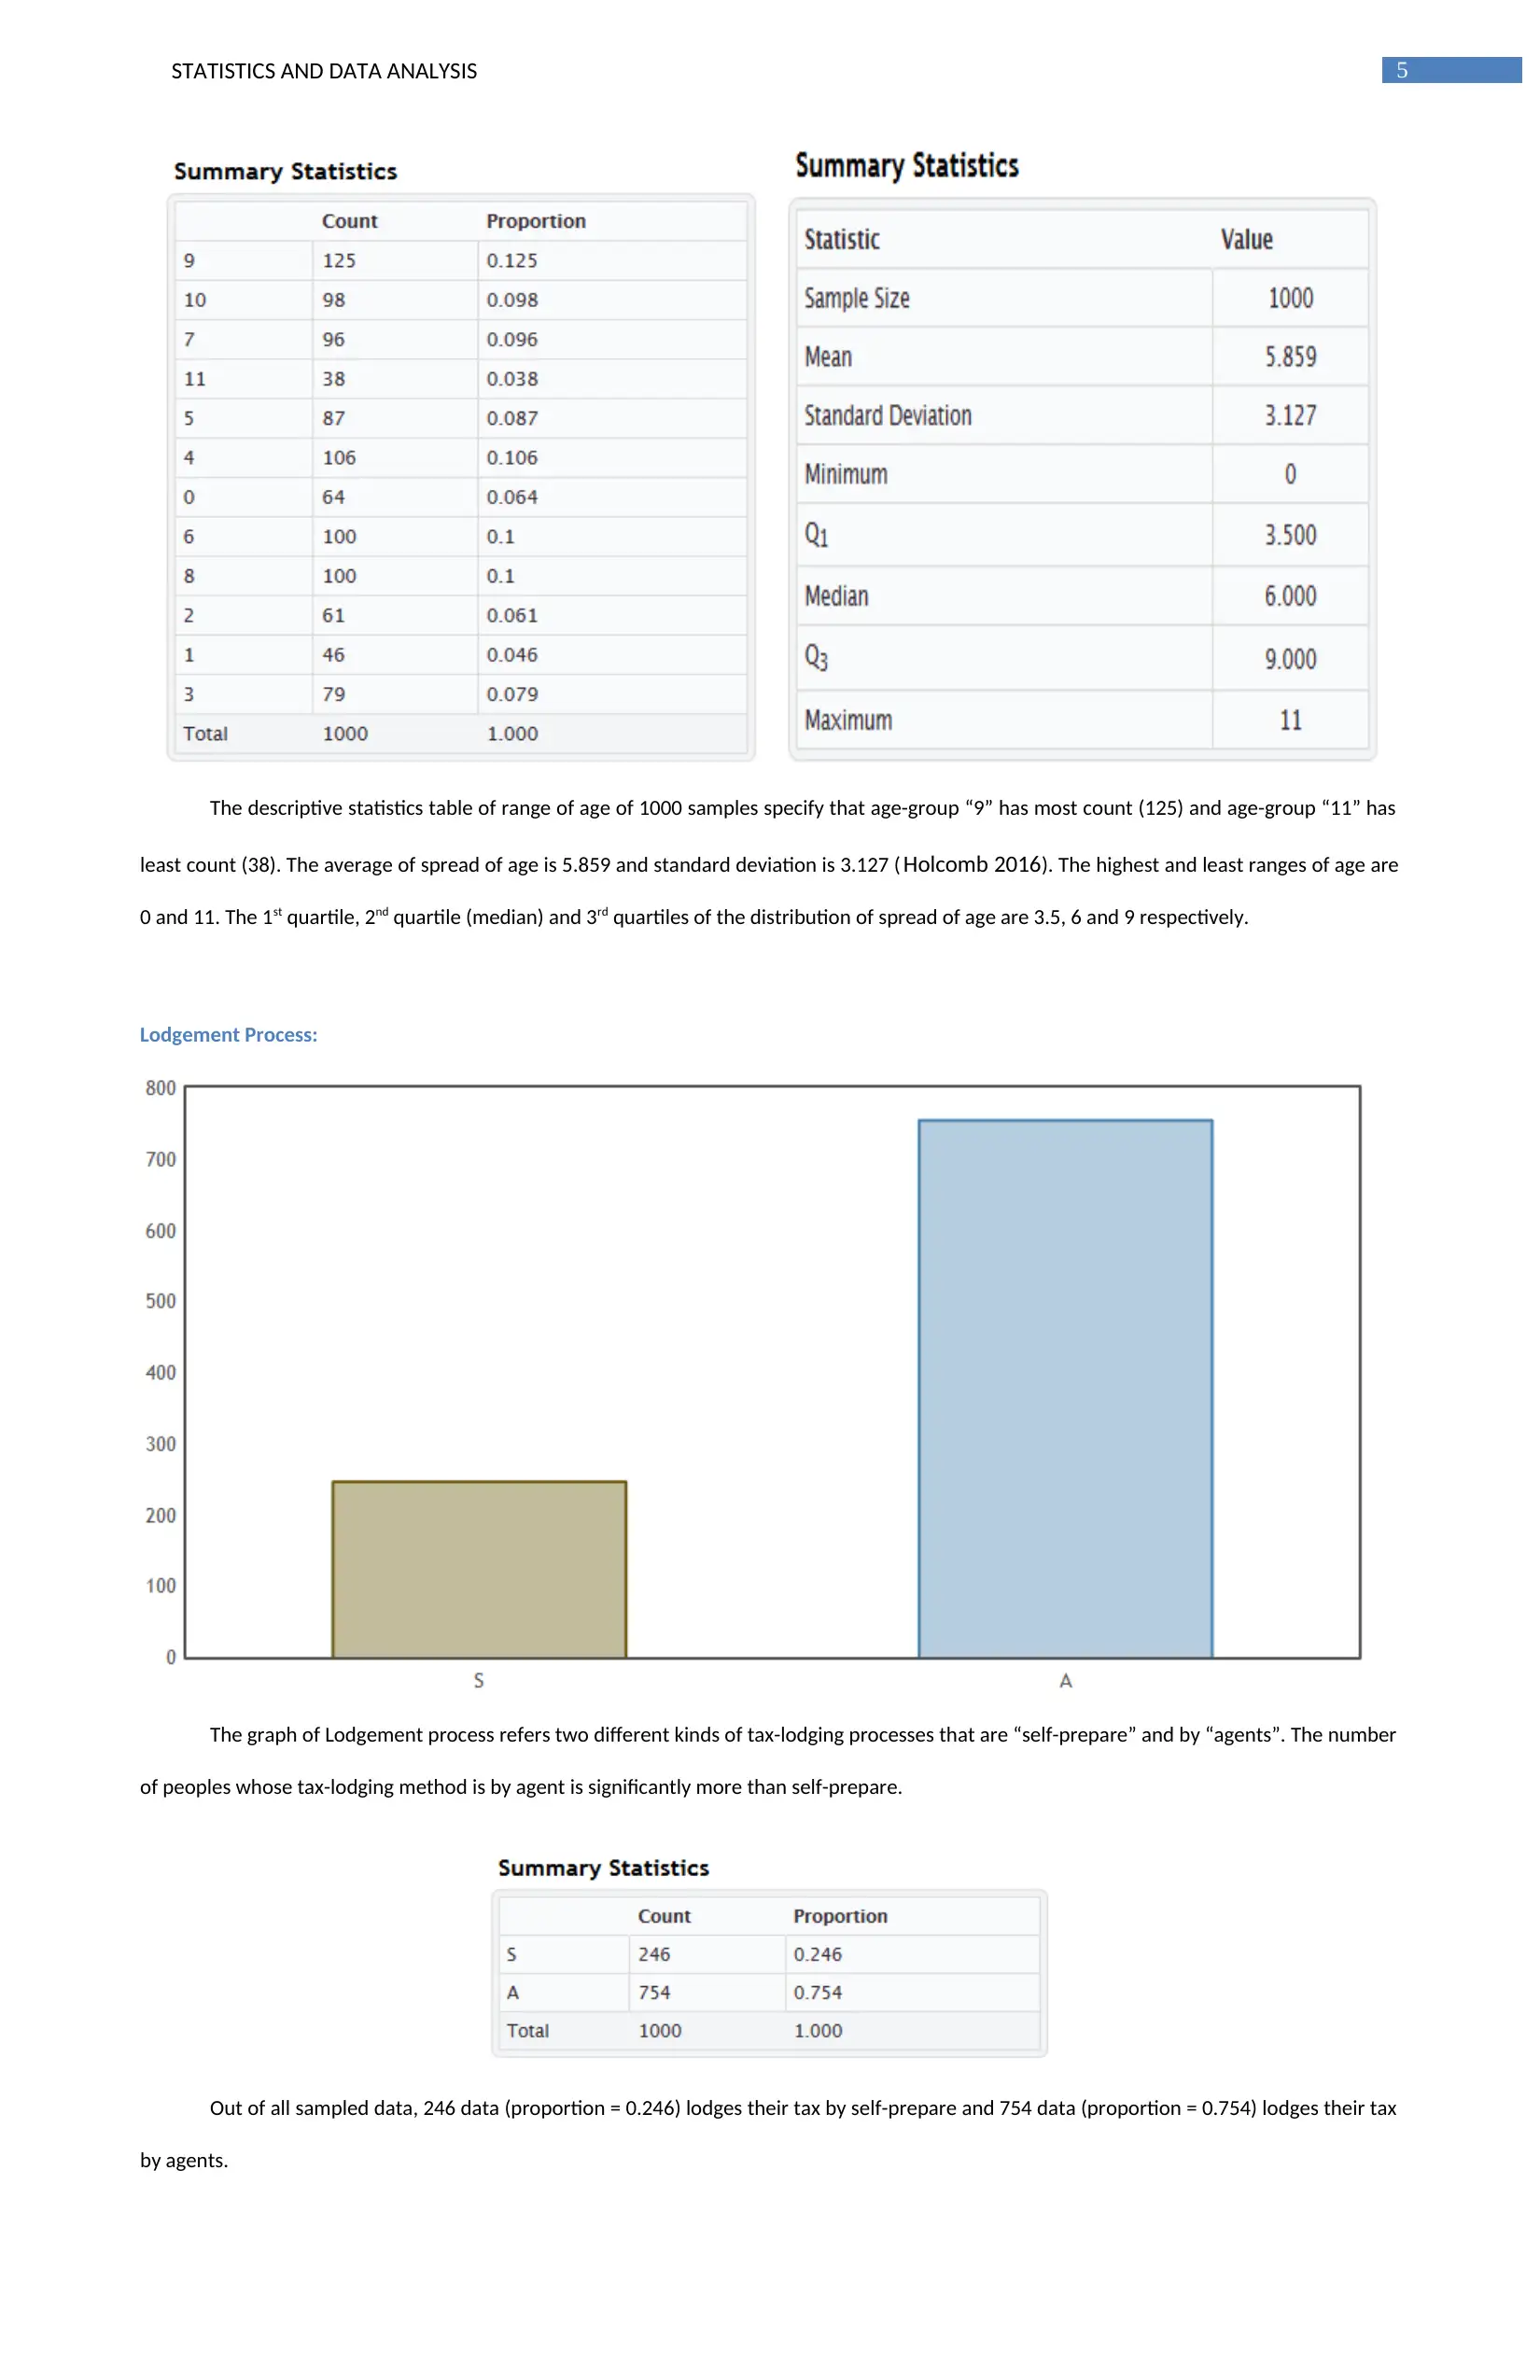
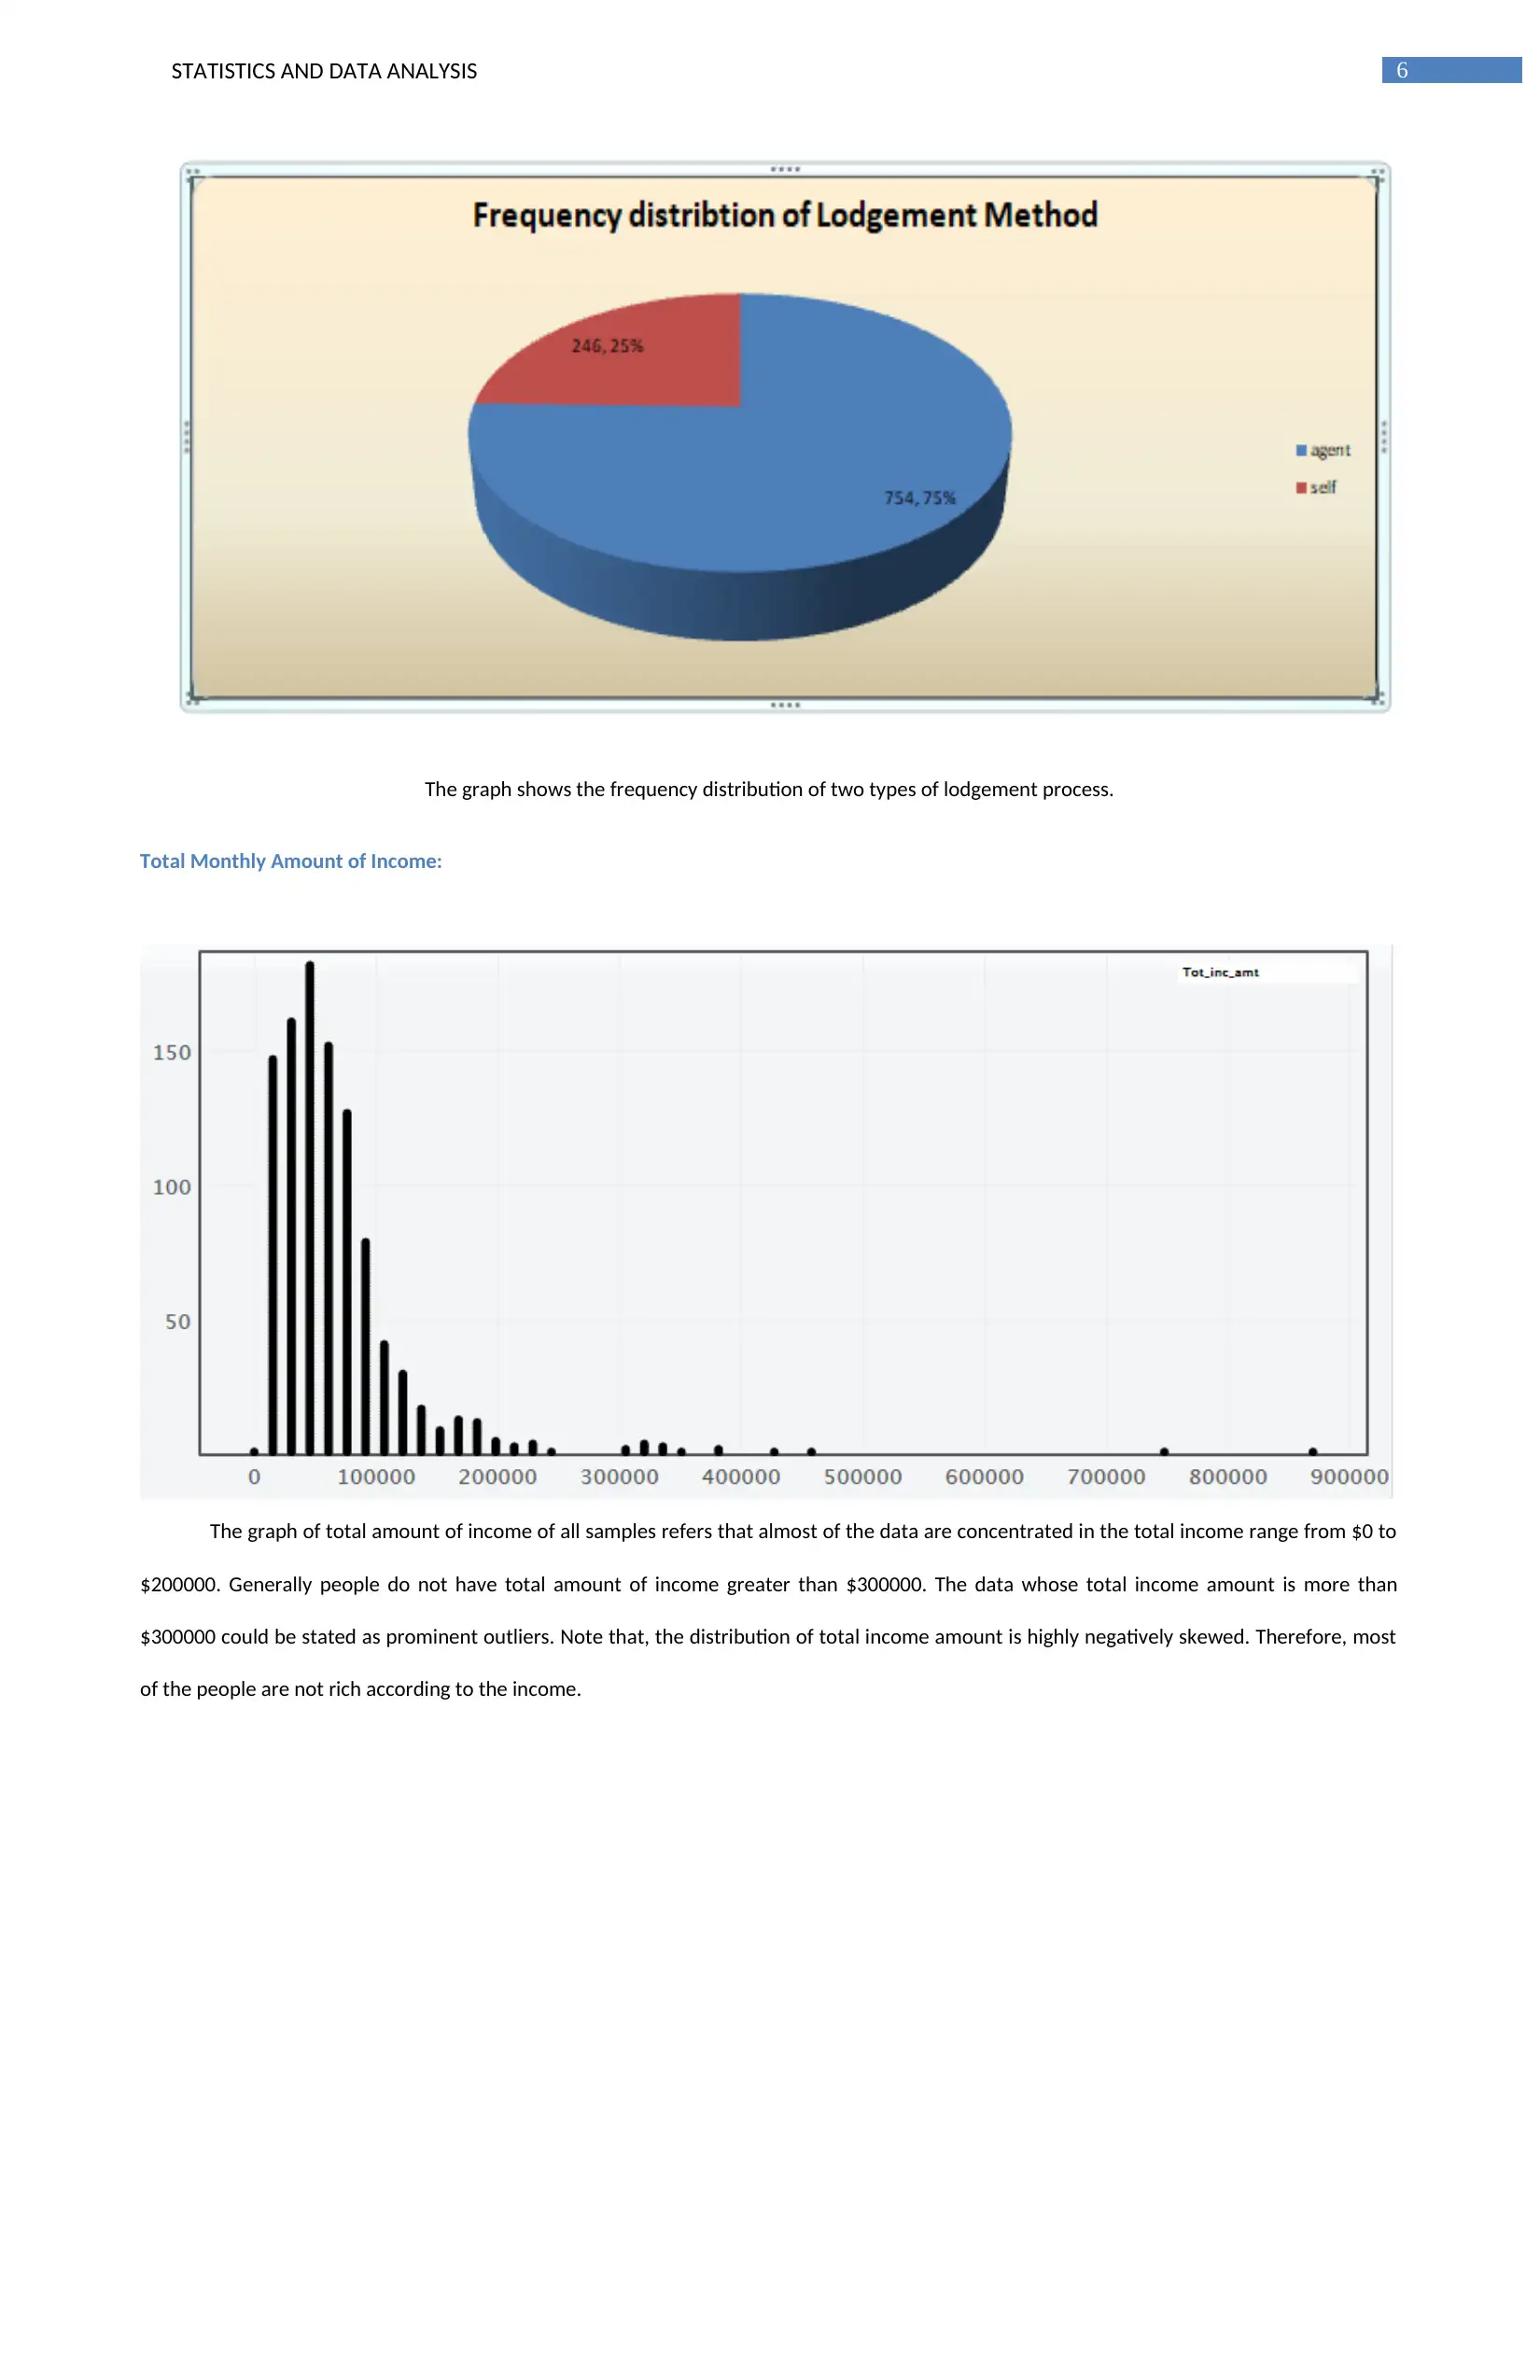
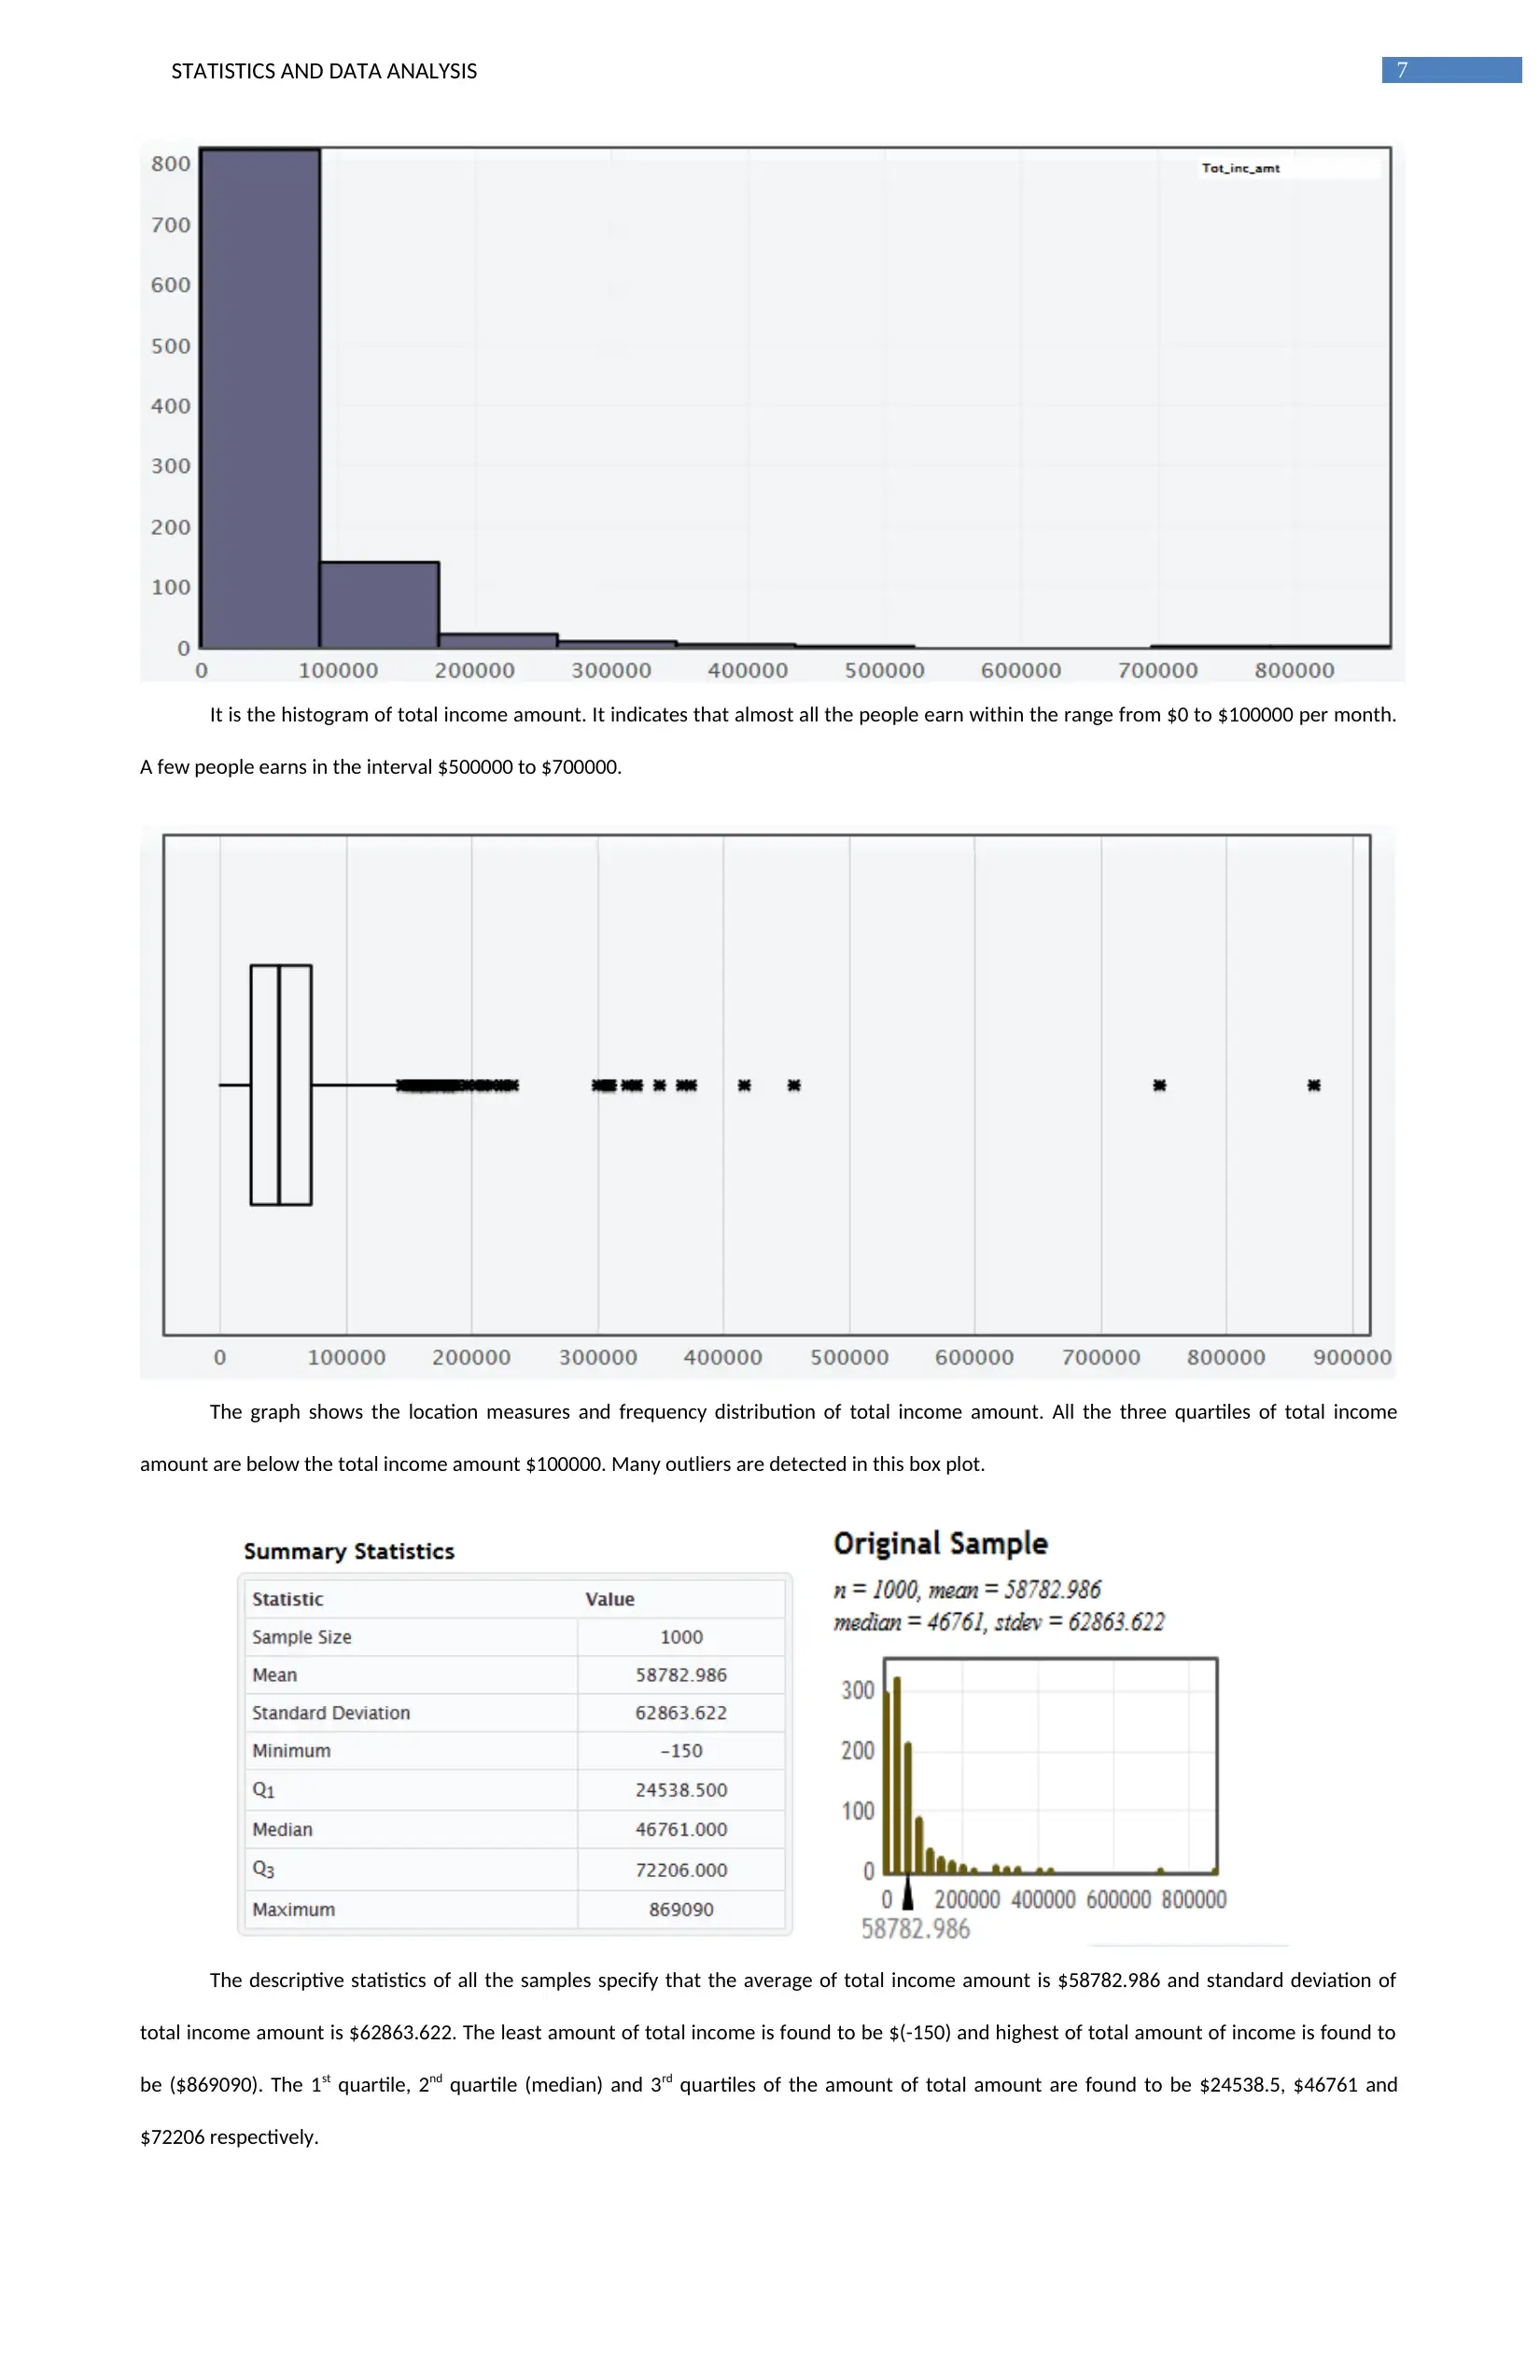
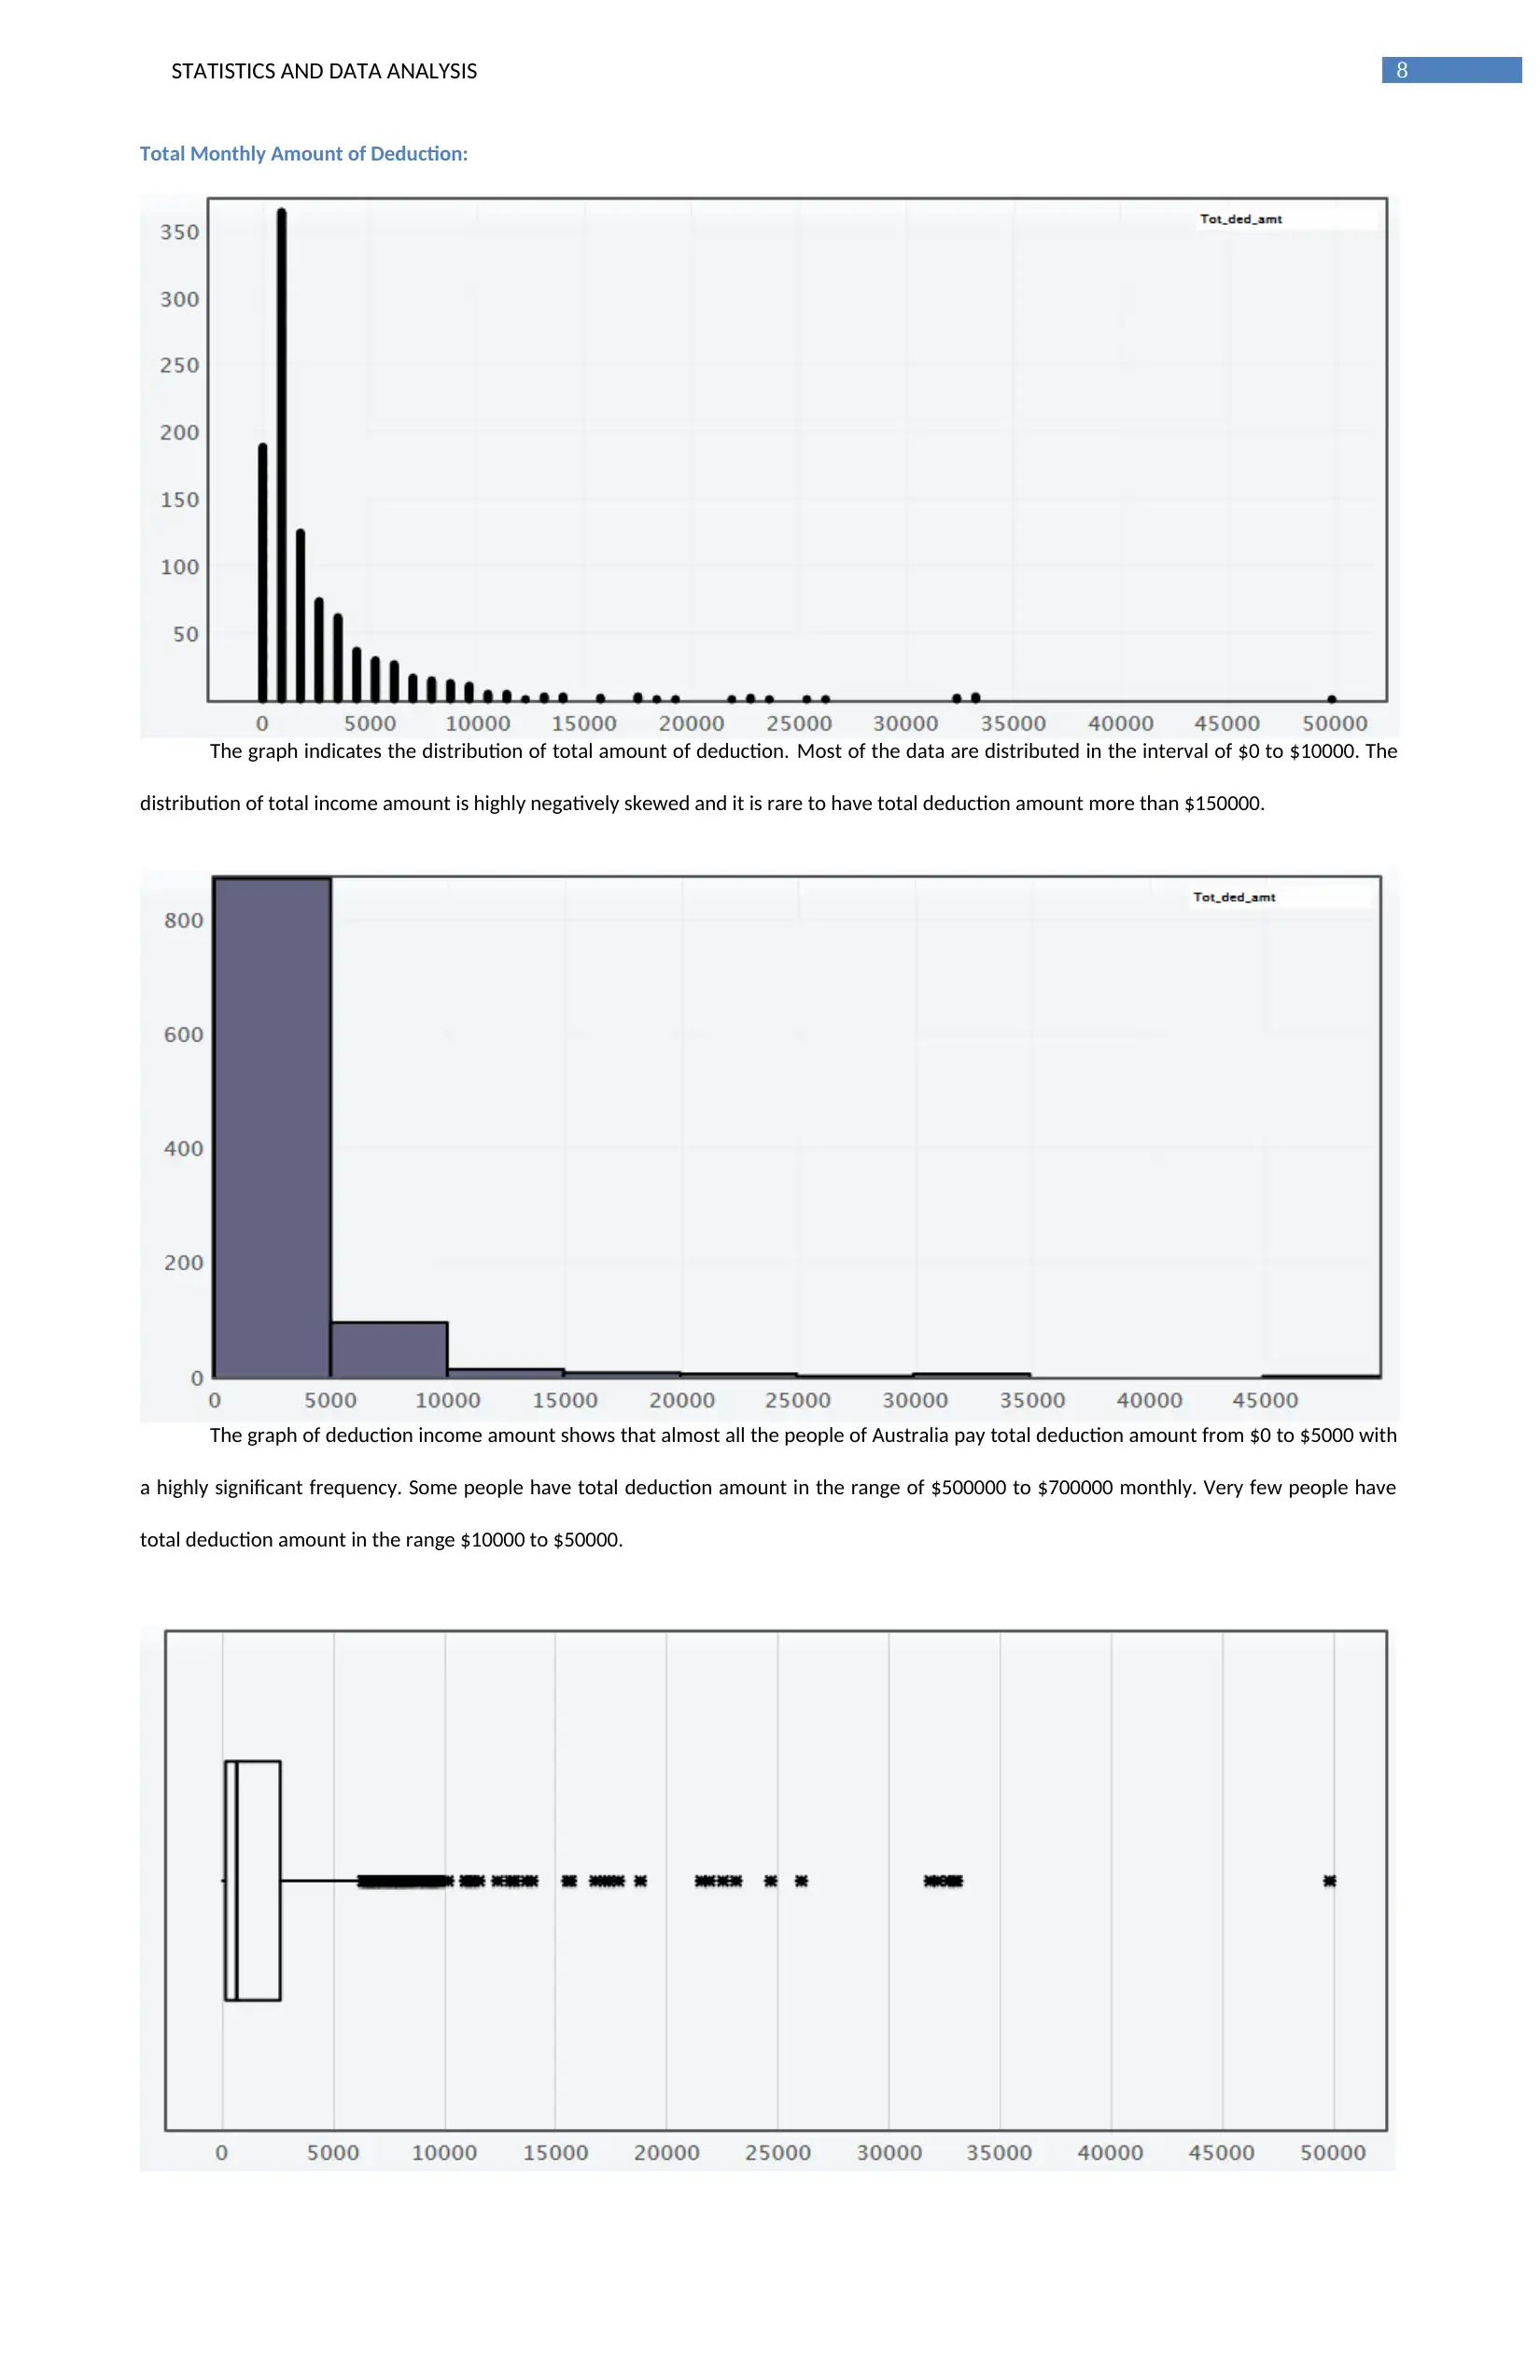
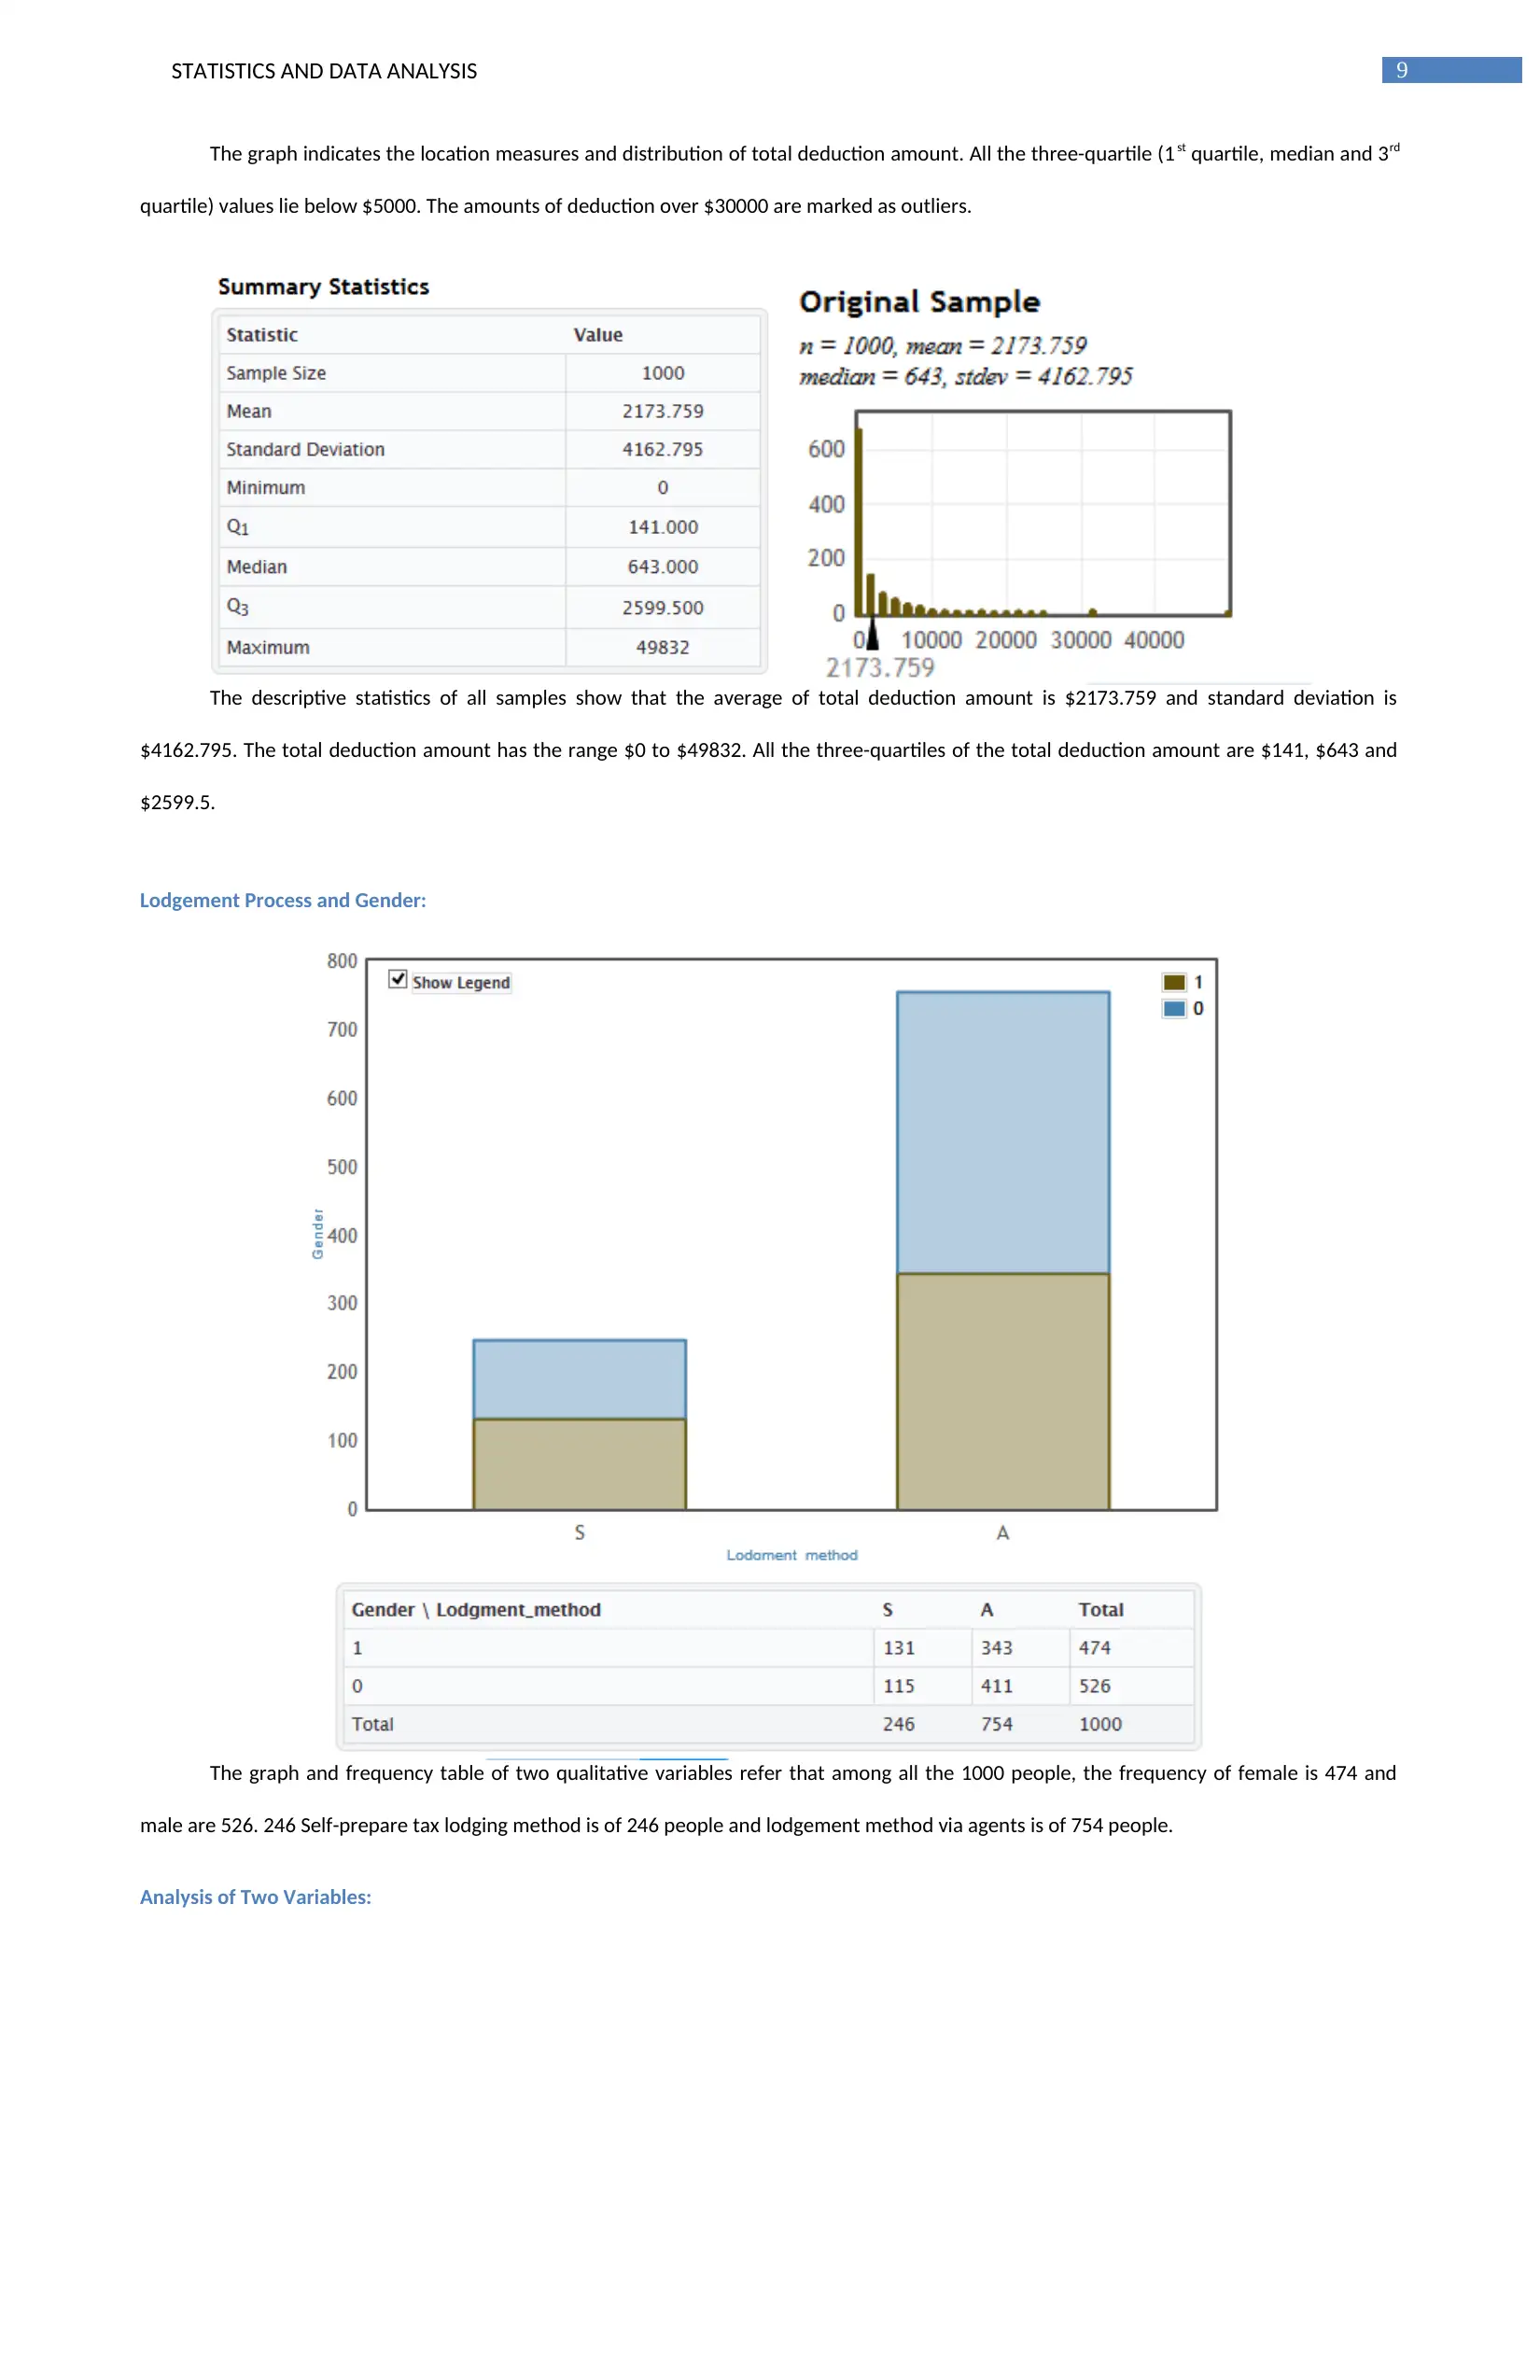
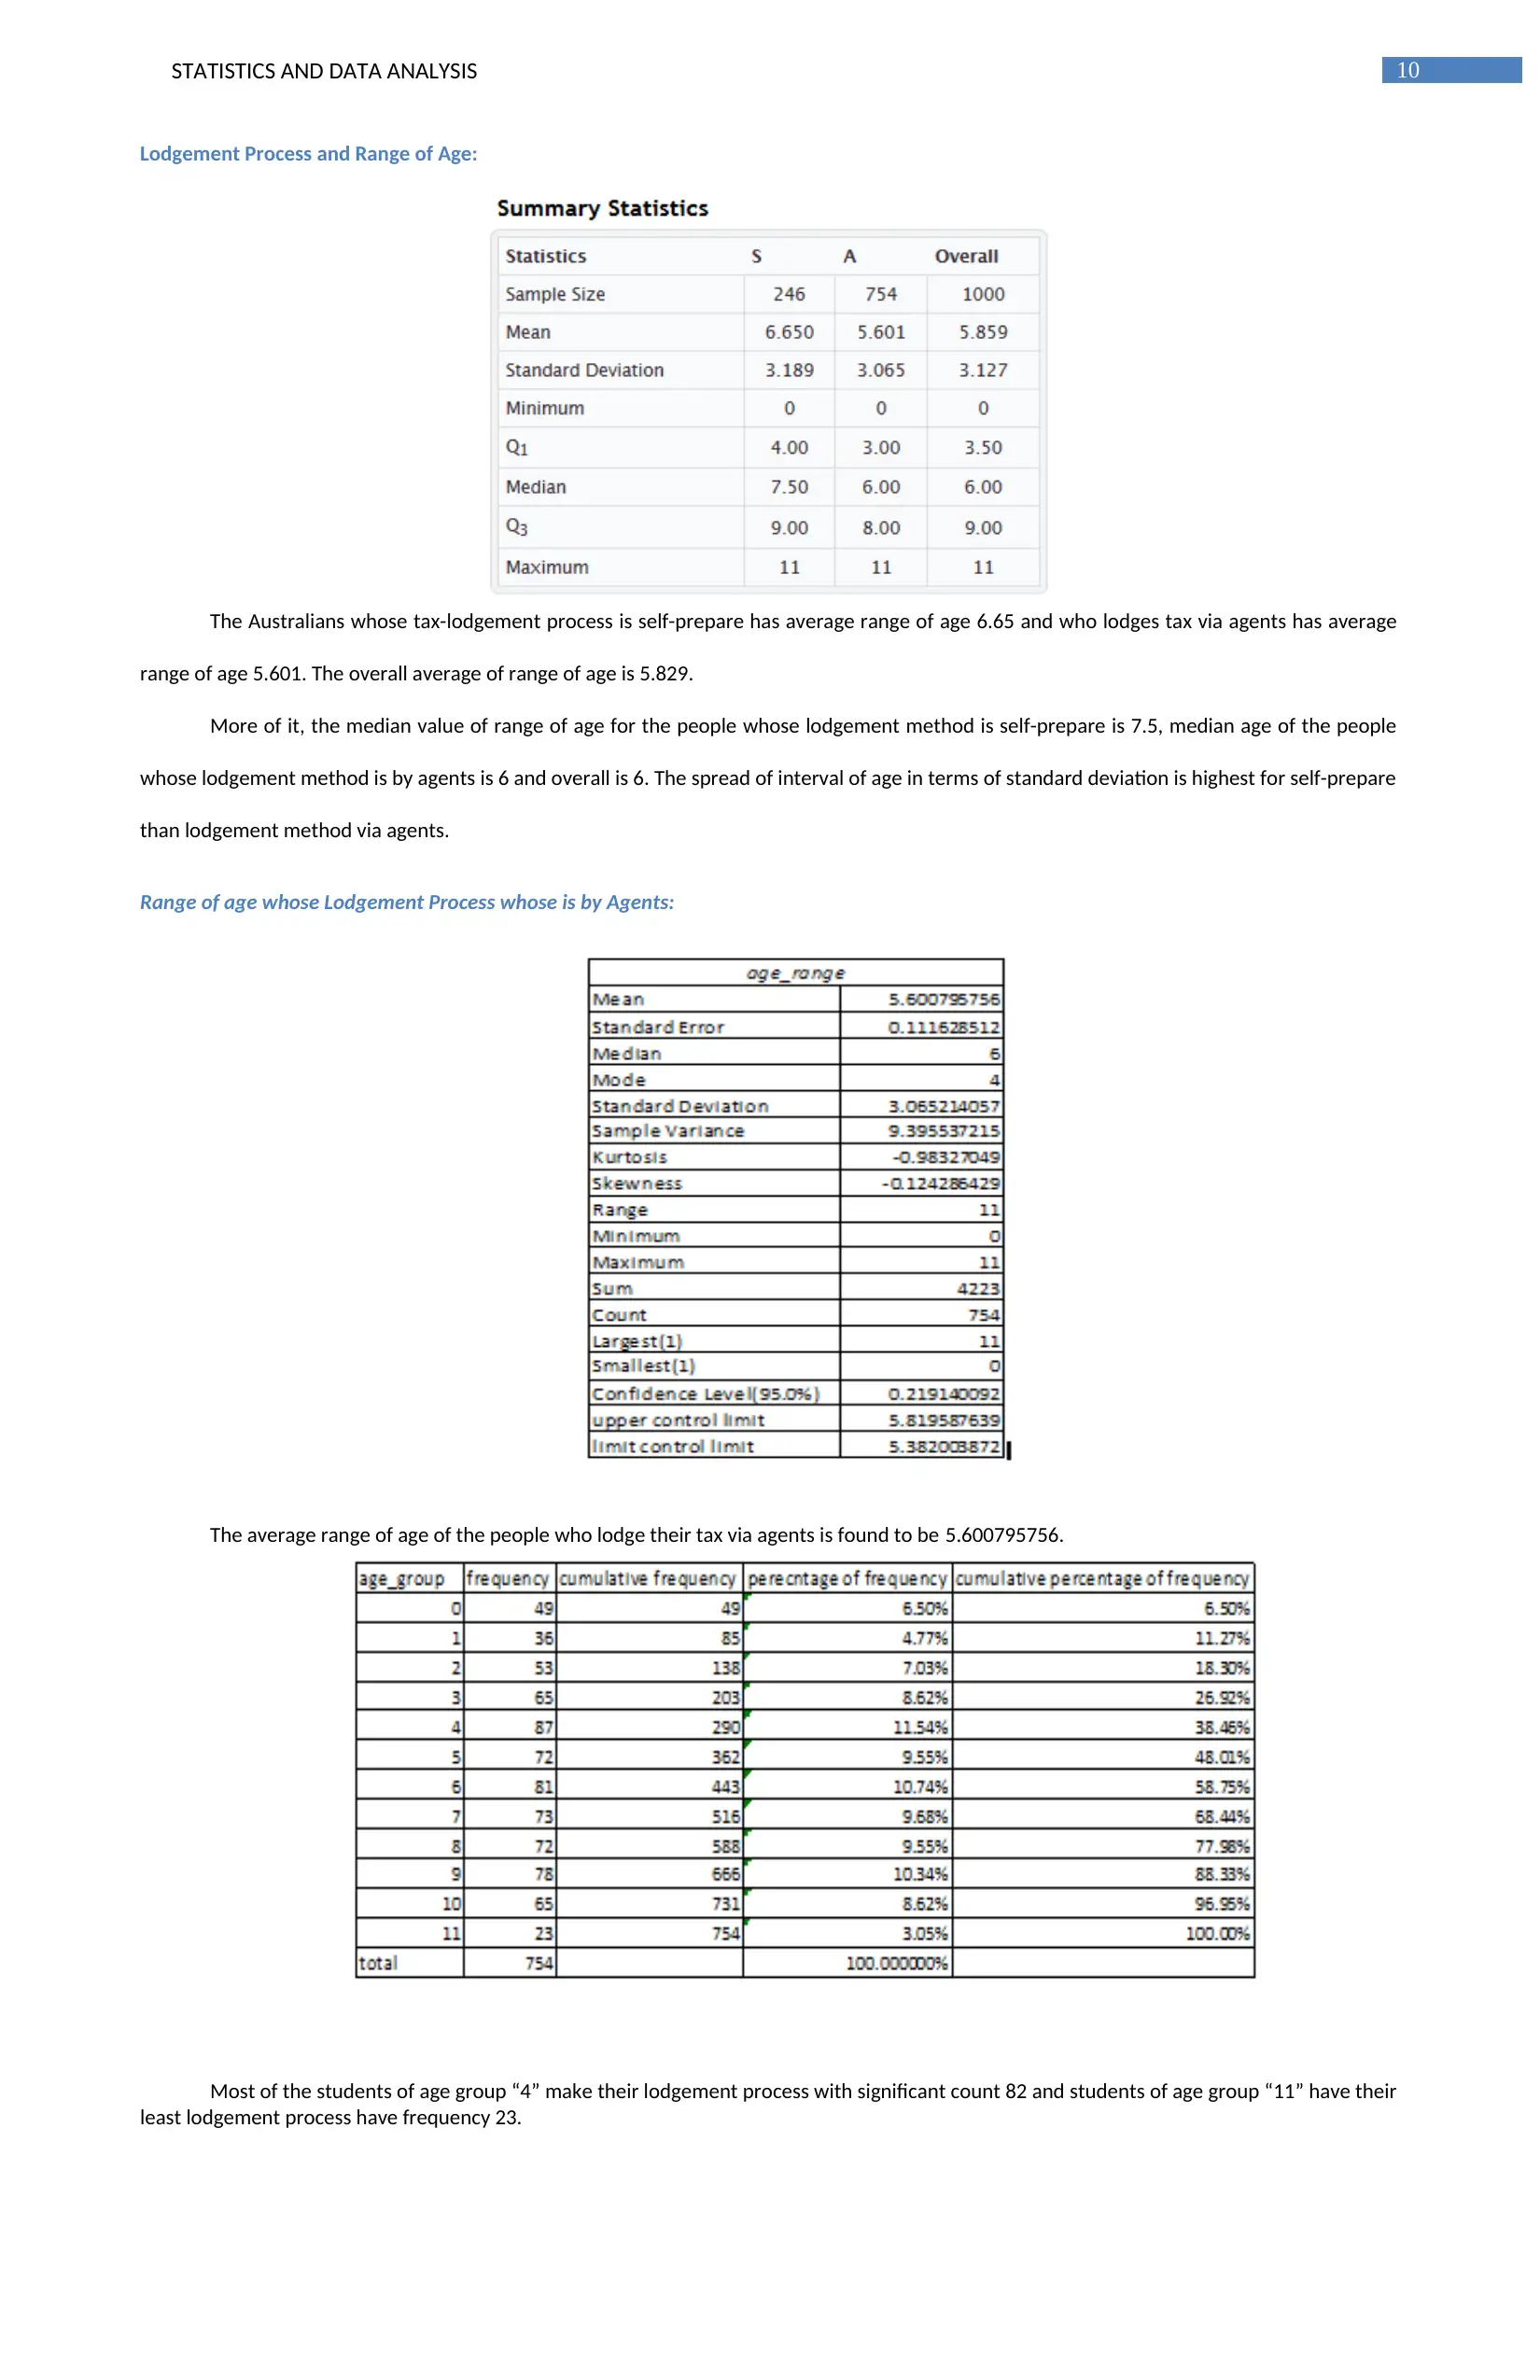
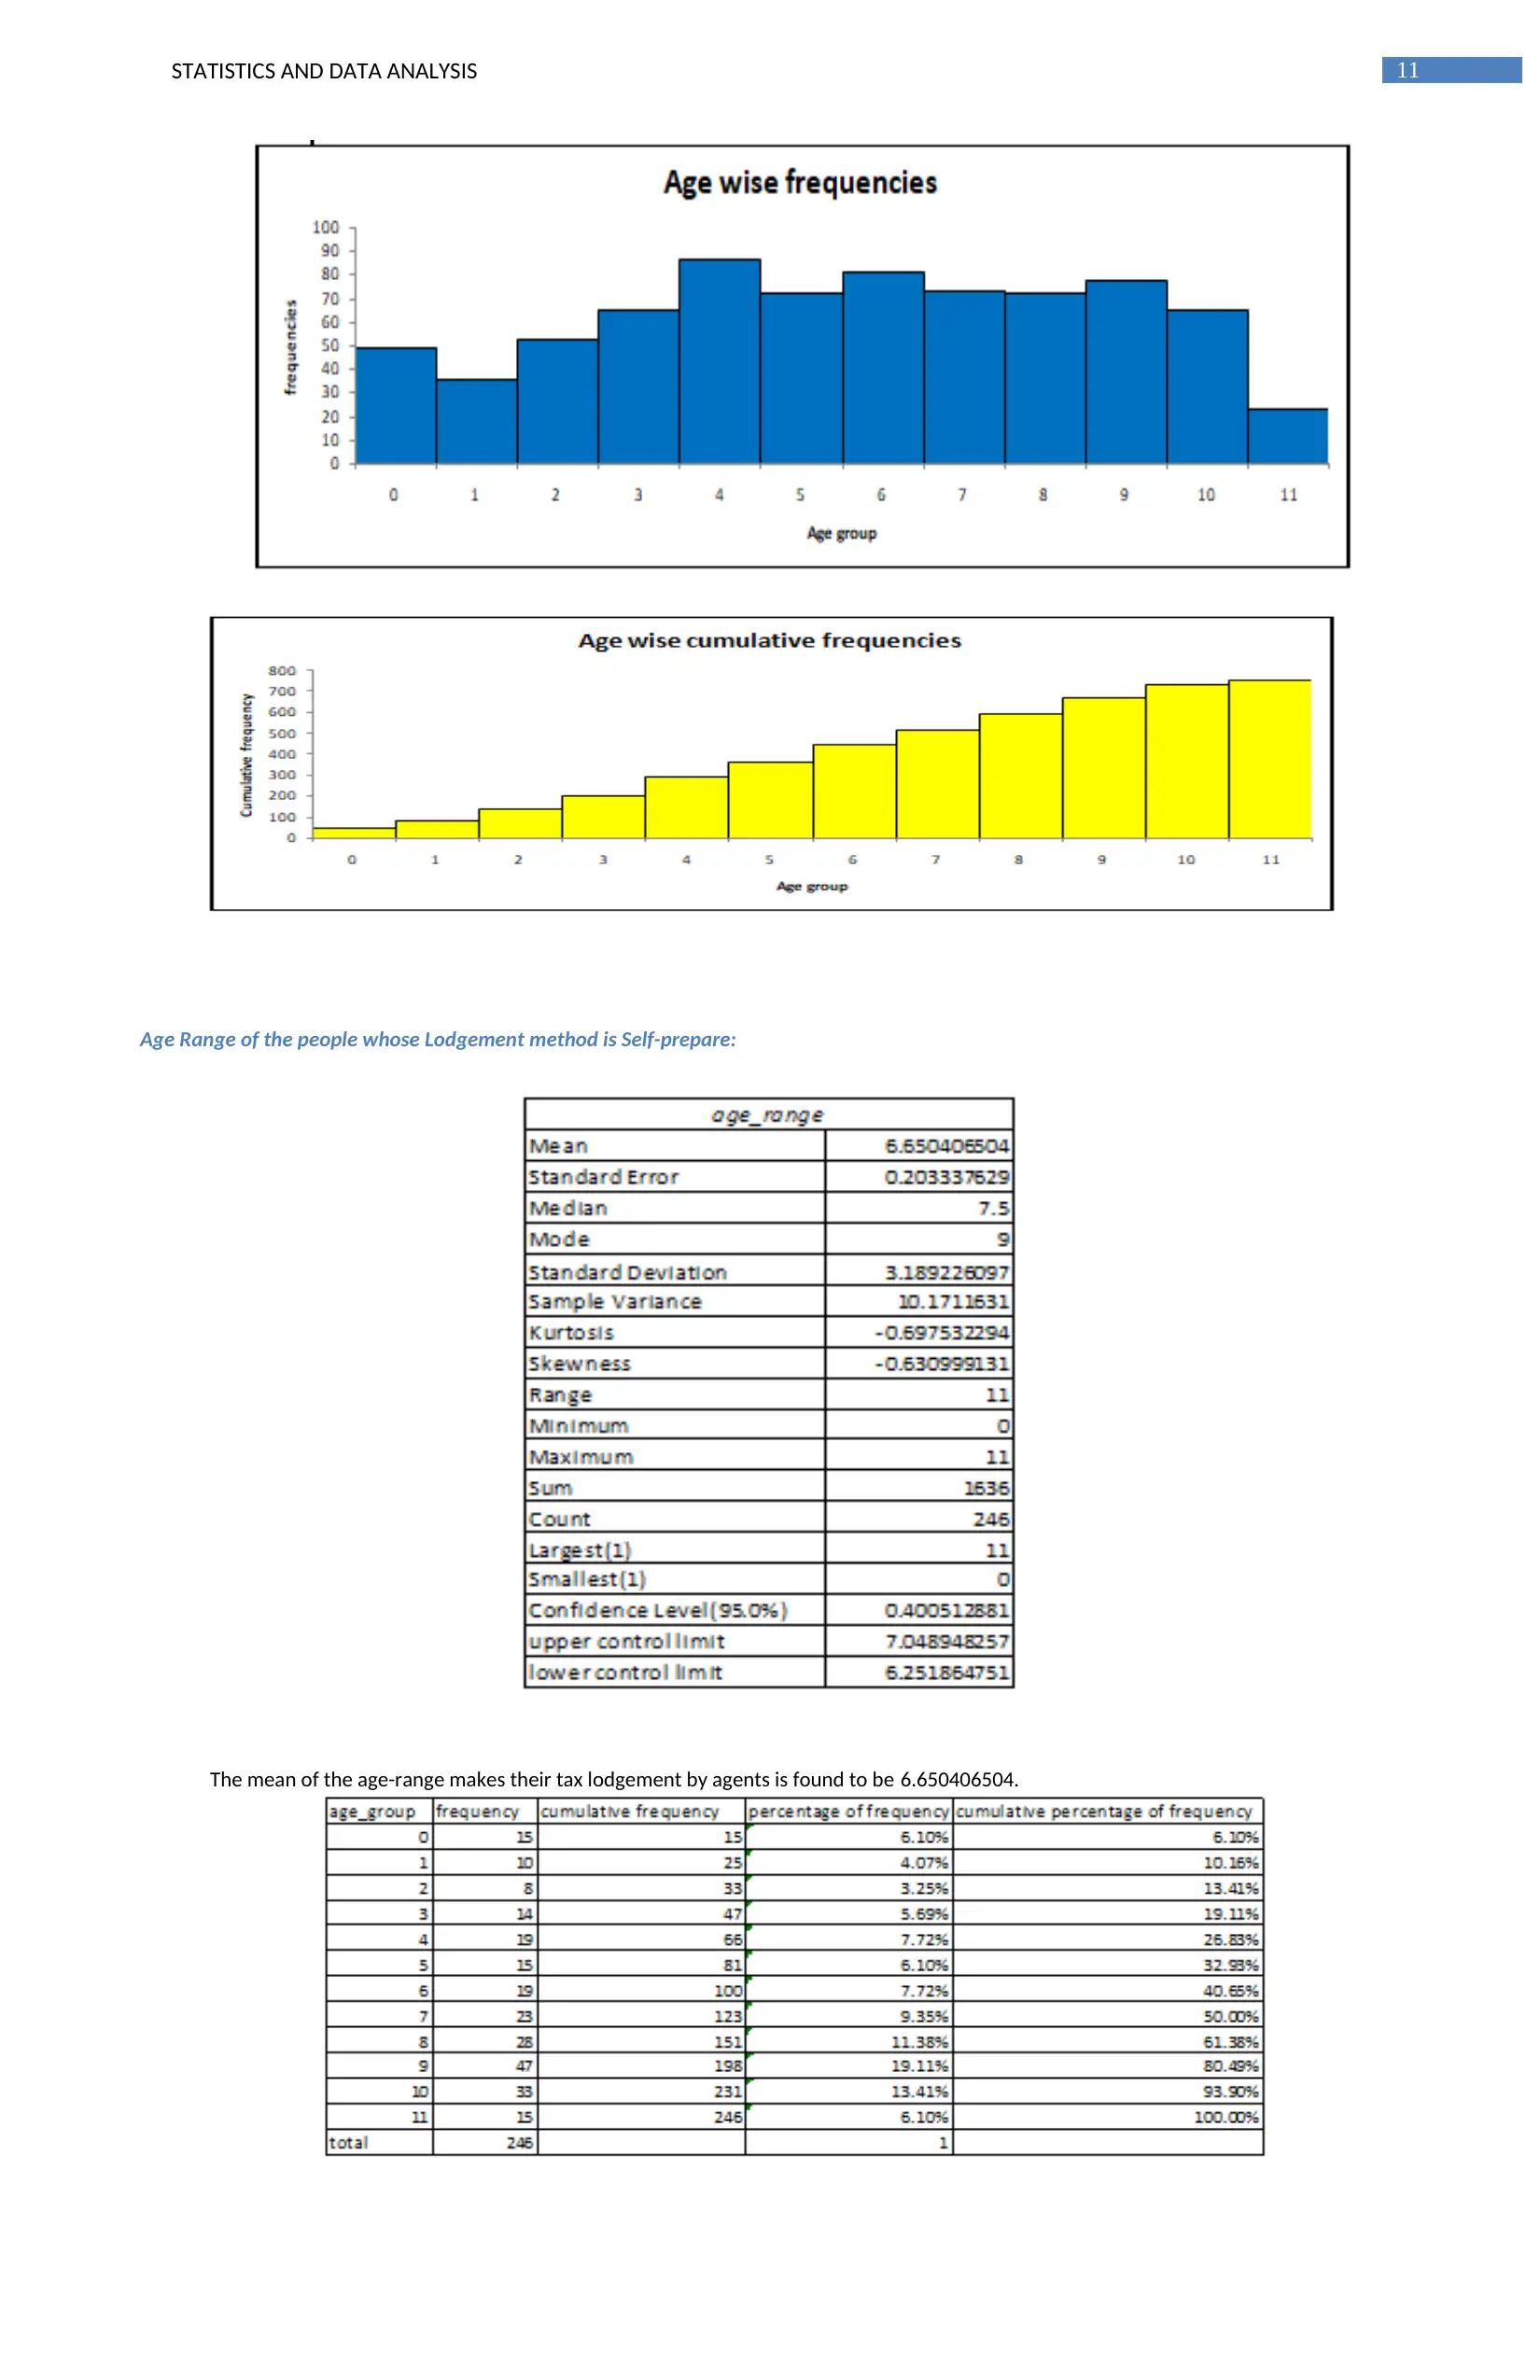
This report presents a comprehensive statistical analysis of Australian tax lodgement data, examining various aspects of the process. The analysis encompasses a dataset of 1000 samples, exploring both numerical and categorical variables such as gender, age range, lodgement process (self-prepared vs. agent), total monthly income, and total monthly deductions. The study utilizes "Statkey" and MSExcel for data analysis, including descriptive statistics, frequency distributions, and hypothesis testing, such as tests for single means, proportions, and ANOVA. Key findings include the distribution of genders, age ranges, and lodgement methods, as well as correlations between income and deduction amounts. The report also investigates relationships between lodgement processes and variables like age and income, providing insights into the characteristics of taxpayers and their preferred methods of filing. The report uses various statistical tools like bar charts, box plots, and regression analysis to draw conclusions about the data, providing a detailed examination of the relationships between different variables and drawing conclusions on hypothesis testing.

Running head: STATISTICS AND DATA ANALYSIS
Statistics and Data Analysis
Name of the Student:
Name of the University:
Author’s note:
Statistics and Data Analysis
Name of the Student:
Name of the University:
Author’s note:
Paraphrase This Document
Need a fresh take? Get an instant paraphrase of this document with our AI Paraphraser

1STATISTICS AND DATA ANALYSIS
Table of Contents
Background:.................................................................................................................................................................................................2
Description of Data:.....................................................................................................................................................................................2
Used Software:.............................................................................................................................................................................................2
Analysis of Data:.........................................................................................................................................................................................3
Analysis of Single Variables...................................................................................................................................................................3
Gender:................................................................................................................................................................................................3
Age range:............................................................................................................................................................................................3
Lodgement Process:.............................................................................................................................................................................5
Total Monthly Amount of Income:......................................................................................................................................................6
Total Monthly Amount of Deduction:.................................................................................................................................................8
Lodgement Process and Gender:.........................................................................................................................................................9
Analysis of Two Variables:.....................................................................................................................................................................9
Lodgement Process and Range of Age:.............................................................................................................................................10
Lodgement Process and total monthly amount of income:...............................................................................................................12
Lodgement Process and monthly total amount of deduction:...........................................................................................................14
Total Monthly Amount of Income vs. Total Monthly Amount of Deduction:..................................................................................15
Testing of Hypothesis:...........................................................................................................................................................................16
Lodgement Processes:.......................................................................................................................................................................16
Total monthly Income Amount:........................................................................................................................................................17
Total monthly Deduction Amount:....................................................................................................................................................17
Tests of analysis of variance (ANOVA):...........................................................................................................................................18
Student’s Paired two samples t-test:..................................................................................................................................................19
Conclusion:................................................................................................................................................................................................19
References:................................................................................................................................................................................................20

2STATISTICS AND DATA ANALYSIS
Background:
After the finishing of financial year, Australians lodge their income tax. Mainly in two ways that are by self-preparer and registered tax-
paying agents, Australians lodge their income tax return. We are discussing and analysing briefly in this research report various inherent facts of
lodgement processes lodges to the Australian Taxation Office (ATO).
The report analyses the dataset. The dataset includes of few numerical and categorical variables like Gender, range of age, Lodgement
process, Total income amount and Total deduction amount. The proportion of Australians who like to lodge a tax return with the help of a tax
agent is a matter of interest. The variability among the age groups with respect to the lodging group is also observed. An essential relation
between “total income” and “lodgement method” is being investigated. Finally, it is a matter of fact whether there is a relevance between total
income and deduction amount or not.
Description of Data:
Internet resources helped to gather the data set. Hence, the dataset is secondary in nature. A total of 1000 samples are present in the
dataset. Gender and Lodgement process are ordinal variables, range of age, total amount of income and total amount of deduction are the
quantitative variables.
Used Software:
“Statkey” online software is used to accomplish the analysis. For analysis part of all the five variables, “One quantitative variable”, “One
categorical variable”, “”One quantitative variable and one categorical variable”, “Two Categorical Variables” and “Two Quantitative Variables”
are selected. Then, some randomised testing of hypothesis that are “Test for Single Mean”, “Test for Single Proportion”, “Test for Difference in
Means” as well as “Test for Difference in Proportions” are carried out. Lastly, some sophisticated randomized tests “ANOVA for Difference in
Means” and “ANOVA for Regression” are executed for reflection part.
More to say that we have used “MSExcel” for accomplishing the analysis. Primarily, “Analysis ToolPack” named as “Data Analysis” in
MSExcel is installed for advanced analysis. With the help of it, bar charts, box plots, linear regression analysis and hypothesis testing are
incorporated with the installed “Data analysis tool”.
⊘ This is a preview!⊘
Do you want full access?
Subscribe today to unlock all pages.

Trusted by 1+ million students worldwide

3STATISTICS AND DATA ANALYSIS
Analysis of Data:
Analysis of Single Variables
Gender:
The graph provides the frequency distribution of two types of genders. Note that, “1” indicates “Female” and “2” indicates “Male”. The
heights of bars are proportional to the frequencies of both the genders.
Out of 1000 data, the number of “Female” (1) is 474 having proportion 0.474, whereas the number of “Male” (0) is 0.526 having the
proportion 0.526.
The pie chart shows the distribution of frequencies of both types of Genders
Range of Age:
Paraphrase This Document
Need a fresh take? Get an instant paraphrase of this document with our AI Paraphraser

4STATISTICS AND DATA ANALYSIS
The graph of spread of age of 1000 observations shows that the spread of age of the peoples varies from 0 to 11. The spread of ages of
group “9” has highest count (> 120) whereas the spread of ages of group “11” has lowest count (< 40).
The histogram of range of ages shows the distribution of ages of all the 1000 samples. Most of the samples have range of age from 10 to
11. Least occurrence of the range of ages is in the interval of spread of age from 1 to 2.
The box plot provides the “Five number summary” of range of ages. It refers the distribution and location measures of all the samples.

5STATISTICS AND DATA ANALYSIS
The descriptive statistics table of range of age of 1000 samples specify that age-group “9” has most count (125) and age-group “11” has
least count (38). The average of spread of age is 5.859 and standard deviation is 3.127 ( Holcomb 2016). The highest and least ranges of age are
0 and 11. The 1st quartile, 2nd quartile (median) and 3rd quartiles of the distribution of spread of age are 3.5, 6 and 9 respectively.
Lodgement Process:
The graph of Lodgement process refers two different kinds of tax-lodging processes that are “self-prepare” and by “agents”. The number
of peoples whose tax-lodging method is by agent is significantly more than self-prepare.
Out of all sampled data, 246 data (proportion = 0.246) lodges their tax by self-prepare and 754 data (proportion = 0.754) lodges their tax
by agents.
⊘ This is a preview!⊘
Do you want full access?
Subscribe today to unlock all pages.

Trusted by 1+ million students worldwide

6STATISTICS AND DATA ANALYSIS
The graph shows the frequency distribution of two types of lodgement process.
Total Monthly Amount of Income:
The graph of total amount of income of all samples refers that almost of the data are concentrated in the total income range from $0 to
$200000. Generally people do not have total amount of income greater than $300000. The data whose total income amount is more than
$300000 could be stated as prominent outliers. Note that, the distribution of total income amount is highly negatively skewed. Therefore, most
of the people are not rich according to the income.
Paraphrase This Document
Need a fresh take? Get an instant paraphrase of this document with our AI Paraphraser

7STATISTICS AND DATA ANALYSIS
It is the histogram of total income amount. It indicates that almost all the people earn within the range from $0 to $100000 per month.
A few people earns in the interval $500000 to $700000.
The graph shows the location measures and frequency distribution of total income amount. All the three quartiles of total income
amount are below the total income amount $100000. Many outliers are detected in this box plot.
The descriptive statistics of all the samples specify that the average of total income amount is $58782.986 and standard deviation of
total income amount is $62863.622. The least amount of total income is found to be $(-150) and highest of total amount of income is found to
be ($869090). The 1st quartile, 2nd quartile (median) and 3rd quartiles of the amount of total amount are found to be $24538.5, $46761 and
$72206 respectively.

8STATISTICS AND DATA ANALYSIS
Total Monthly Amount of Deduction:
The graph indicates the distribution of total amount of deduction. Most of the data are distributed in the interval of $0 to $10000. The
distribution of total income amount is highly negatively skewed and it is rare to have total deduction amount more than $150000.
The graph of deduction income amount shows that almost all the people of Australia pay total deduction amount from $0 to $5000 with
a highly significant frequency. Some people have total deduction amount in the range of $500000 to $700000 monthly. Very few people have
total deduction amount in the range $10000 to $50000.
⊘ This is a preview!⊘
Do you want full access?
Subscribe today to unlock all pages.

Trusted by 1+ million students worldwide

9STATISTICS AND DATA ANALYSIS
The graph indicates the location measures and distribution of total deduction amount. All the three-quartile (1 st quartile, median and 3rd
quartile) values lie below $5000. The amounts of deduction over $30000 are marked as outliers.
The descriptive statistics of all samples show that the average of total deduction amount is $2173.759 and standard deviation is
$4162.795. The total deduction amount has the range $0 to $49832. All the three-quartiles of the total deduction amount are $141, $643 and
$2599.5.
Lodgement Process and Gender:
The graph and frequency table of two qualitative variables refer that among all the 1000 people, the frequency of female is 474 and
male are 526. 246 Self-prepare tax lodging method is of 246 people and lodgement method via agents is of 754 people.
Analysis of Two Variables:
Paraphrase This Document
Need a fresh take? Get an instant paraphrase of this document with our AI Paraphraser

10STATISTICS AND DATA ANALYSIS
Lodgement Process and Range of Age:
The Australians whose tax-lodgement process is self-prepare has average range of age 6.65 and who lodges tax via agents has average
range of age 5.601. The overall average of range of age is 5.829.
More of it, the median value of range of age for the people whose lodgement method is self-prepare is 7.5, median age of the people
whose lodgement method is by agents is 6 and overall is 6. The spread of interval of age in terms of standard deviation is highest for self-prepare
than lodgement method via agents.
Range of age whose Lodgement Process whose is by Agents:
The average range of age of the people who lodge their tax via agents is found to be 5.600795756.
Most of the students of age group “4” make their lodgement process with significant count 82 and students of age group “11” have their
least lodgement process have frequency 23.

11STATISTICS AND DATA ANALYSIS
Age Range of the people whose Lodgement method is Self-prepare:
The mean of the age-range makes their tax lodgement by agents is found to be 6.650406504.
Age Range of the people whose Lodgement method is Self-prepare:
The mean of the age-range makes their tax lodgement by agents is found to be 6.650406504.
⊘ This is a preview!⊘
Do you want full access?
Subscribe today to unlock all pages.

Trusted by 1+ million students worldwide
1 out of 22
Related Documents

Your All-in-One AI-Powered Toolkit for Academic Success.
+13062052269
info@desklib.com
Available 24*7 on WhatsApp / Email
Unlock your academic potential
Copyright © 2020–2025 A2Z Services. All Rights Reserved. Developed and managed by ZUCOL.