Statistics Test 3: Analysis of Variance and Statistical Significance
VerifiedAdded on  2022/08/29
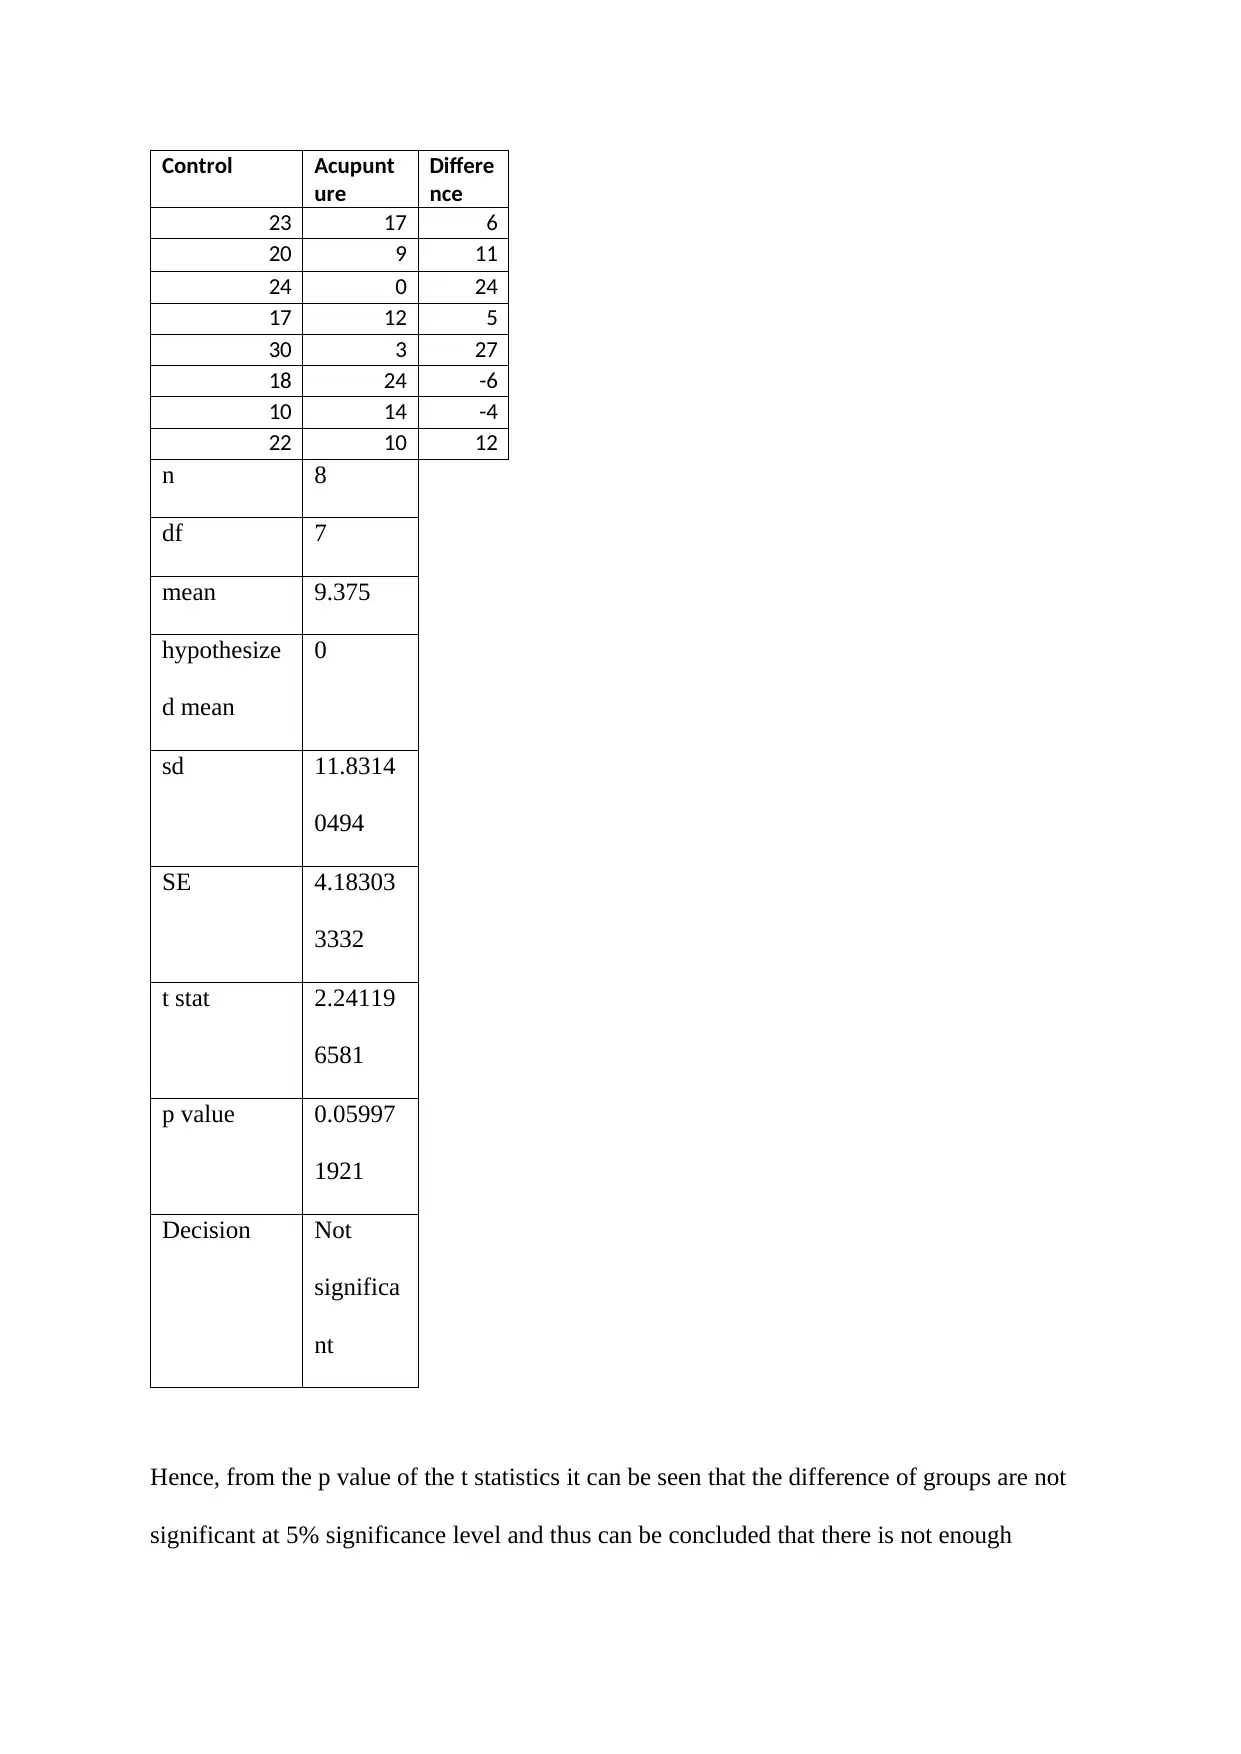
|10
|1341
|41
Homework Assignment
AI Summary
This document presents a comprehensive solution to a statistics test, addressing various statistical concepts. The assignment begins with calculating variance and standard deviation for given sample data. It then delves into hypothesis testing using paired t-tests to analyze the effect of acupuncture on vaping habits, detailing the null and alternative hypotheses, significance levels, and p-values to determine statistical significance. The solution further explores the relationship between t-values and the probability of rejecting the null hypothesis. Independent sample t-tests are employed to compare language skills between first-born children and triplets. Additionally, the assignment includes an analysis of forgetting scores using paired t-tests, comparisons between repeated and independent measures, and an explanation of statistical versus practical significance. The document concludes with a paired t-test analysis to assess performance differences under two conditions.

Running head: STATISTICS
STATISTICS
Name of the Student
Name of the University
Author Note
STATISTICS
Name of the Student
Name of the University
Author Note
Paraphrase This Document
Need a fresh take? Get an instant paraphrase of this document with our AI Paraphraser

1.
Given, the sample size of first sample n1 = 8
Sum of square SS1 = 56
Second sample has sample size n2 = 10
Sum of square SS2 = 108
Hence, variance of first sample Var1 = 56/8 = 7
Thus standard deviation first s1 = 2.646
Similarly for second sample Var2 = 108/10 = 10.8
Thus standard deviation of second sample s2 = 3.286
2.
As the control and acupuncture groups are formed from same people hence the people in two
group are related. Also, as the population standard deviation of the groups are unknown and
hence paired t test is applied here.
Null hypothesis(H0): The average difference between control group and acupuncture group
in the population is zero.
Alternative hypothesis (H1): There is significant difference between the control and
acupuncture group in population.
Chosen significance level: 0.05.
From the alternative hypothesis the paired t test is a two tailed t test and the test summary is
given below.

Control Acupunt
ure
Differe
nce
23 17 6
20 9 11
24 0 24
17 12 5
30 3 27
18 24 -6
10 14 -4
22 10 12
n 8
df 7
mean 9.375
hypothesize
d mean
0
sd 11.8314
0494
SE 4.18303
3332
t stat 2.24119
6581
p value 0.05997
1921
Decision Not
significa
nt
Hence, from the p value of the t statistics it can be seen that the difference of groups are not
significant at 5% significance level and thus can be concluded that there is not enough
⊘ This is a preview!⊘
Do you want full access?
Subscribe today to unlock all pages.

Trusted by 1+ million students worldwide

evident to reject the null or the average difference between control group and acupuncture
group in the population is zero.
3.
The t critical value for a particular level of significance and degree of freedom is fixed and a
positive number. Now, the test statistics if negative then result will always be significant or
the null hypothesis will always be rejected. However, for positive p value if the value is less
than the t critical value then the null hypothesis is rejected. Now, as t statistics value become
large and positive the probability of rejecting the null hypothesis reduces. Hence, with
increase in t statistics reduces the chance of rejecting the null hypothesis or the significance
level for reject the null increases or confidence level of the test reduces.
4.
As the first born children and triplet children in the sample are not related hence in this case
independent sample t test is applied assuming unequal variance of measure of language skill
for two populations which are assumed to be approximately normally distributed.
Null hypothesis The average measure of language skill of first born child is same as that of a
triplet child.
Alternative hypothesis: The average measure of language skill of first born child is
significantly different from that of a triplet child.
The test is two tailed from the alternative hypothesis and the significant level is assumed to
be 0.05.
Test summary:
t-Test: Two-Sample Assuming Unequal Variances
Paraphrase This Document
Need a fresh take? Get an instant paraphrase of this document with our AI Paraphraser

Single child Triple
t
Mean 8 4
Variance 2.5 3.5
Observations 5 5
Hypothesized Mean
Difference
0
df 8
t Stat 3.651483717
P(T<=t) one-tail 0.003240227
t Critical one-tail 1.859548038
P(T<=t) two-tail 0.006480453
t Critical two-tail 2.306004135
As the two tailed p value of the test is less than 0.05 hence the result is significant. Thus it
can be concluded that the average measure of language skill of first born child is significantly
different from that of a triplet child.
5.
a.
Null hypothesis: The average awake score is more than equal to average asleep score or there
is more or equal forgetting during day or evening.
Alternative hypothesis: The average awake score is less than average asleep score or there is
less forgetting during day or evening.

Scores range Frequency(Awake) Frequency
(Asleep)
upto 10 0 0
more than 10 to
20
12 11
more than 20 to
30
0 0
more than 30 to
40
0 0
more than 40 to
50
0 0
more than 50 to
60
0 1
upto 10 more than
10 to 20 more than
20 to 30 more than
30 to 40 more than
40 to 50 more than
50 to 60
0
2
4
6
8
10
12
14
Frequency histogram
Frequency(Awake) Frequency (Asleep)
Scores range
Frequency
⊘ This is a preview!⊘
Do you want full access?
Subscribe today to unlock all pages.

Trusted by 1+ million students worldwide

From the distribution of scores what is displayed in the above chart it can be seen that the
difference of frequencies of two groups Awake and Asleep are not large and hence there is
less chance of rejecting the null hypothesis.
b.
Now, paired t test is used to answer the research question. From the alternative hypothesis the
test is a left tailed test and the significance level is considered 0.05.
t-Test: Paired Two Sample for Means
Asleep
scores
Awake
scores
Mean 15 16
Variance 1.272727273 122.3636364
Observations 12 12
Pearson Correlation -
0.029138919
Hypothesized Mean
Difference
0
df 11
t Stat -
0.310630372
P(T<=t) one-tail 0.38094414
t Critical one-tail 1.795884819
P(T<=t) two-tail 0.761888281
Paraphrase This Document
Need a fresh take? Get an instant paraphrase of this document with our AI Paraphraser

t Critical two-tail 2.20098516
The p value of the one tail test is found to 0.38 which is more than 5% of significance level
and thus the null hypothesis cannot be rejected. Hence, it can be concluded that there is no
conclusive evidence to conclude there is less forgetting during day or evening.
6. The main advantage of repeated measures over independent measures is that as same
subjects are used in measurement hence the number of subjects is reduced overall. Also, in
repeated measures fewer people are needed for each measurement as all measurement
conditions are needed to be take part of or the time of data collection is reduced significantly.
7.
a. if independent measures design is used then for obtaining 10 scores for two groups 20
different people will be required.
b. if repeated measures design is used then for obtaining 10 scores for two groups only 10
people will be required.
8.
a. t = 2.53 and df = 24 (independent measure t test)
Number of subjects = 24 + 2 = 26.
b. The corresponding p value for t = 2.53 and df = 24 for two tailed test is p = 0.018382
As the p value is less than considered significance level of 0.05 hence there is significant
difference between the two samples.

c. When significance level is 0.01 then the p value is more than significance level and thus
the null hypothesis cannot be rejected or there is not sufficient evidence to conclude there is
significant difference between the two samples.
9.
Statistical significance means the significance of the statistical results that is often interpreted
by the p value or critical test statistics value and based on this a hypothesis statement is
accepted or rejected. Whereas practical significance is about the magnitude of an effect or
result. For an example in a statistical test if found that a 4 point difference in a 100 point scale
between two group are statistically significant. However, the result is not practically
significant as the difference is less than 5% of the total points.
10.
Paired t test as same subjects are used in different conditions.
Null hypothesis: The average performance in both conditions are same.
Alternative hypothesis: The average performance are significantly different in two
conditions.
Two tailed test from alternative hypothesis
mean -0.159
hypothesized
mean
0
n 10
df 9
sd 0.310034048
⊘ This is a preview!⊘
Do you want full access?
Subscribe today to unlock all pages.

Trusted by 1+ million students worldwide

SE 0.098041374
test stat -1.621764289
p value 0.139303669
decision Result not
significant
Hence, from the test results it can be stated that the different is not significant as the p value
is more than chosen significance level of 0.05 or there is not conclusive evidence to conclude
that average performance are significantly different in two conditions.
1 out of 10
Related Documents

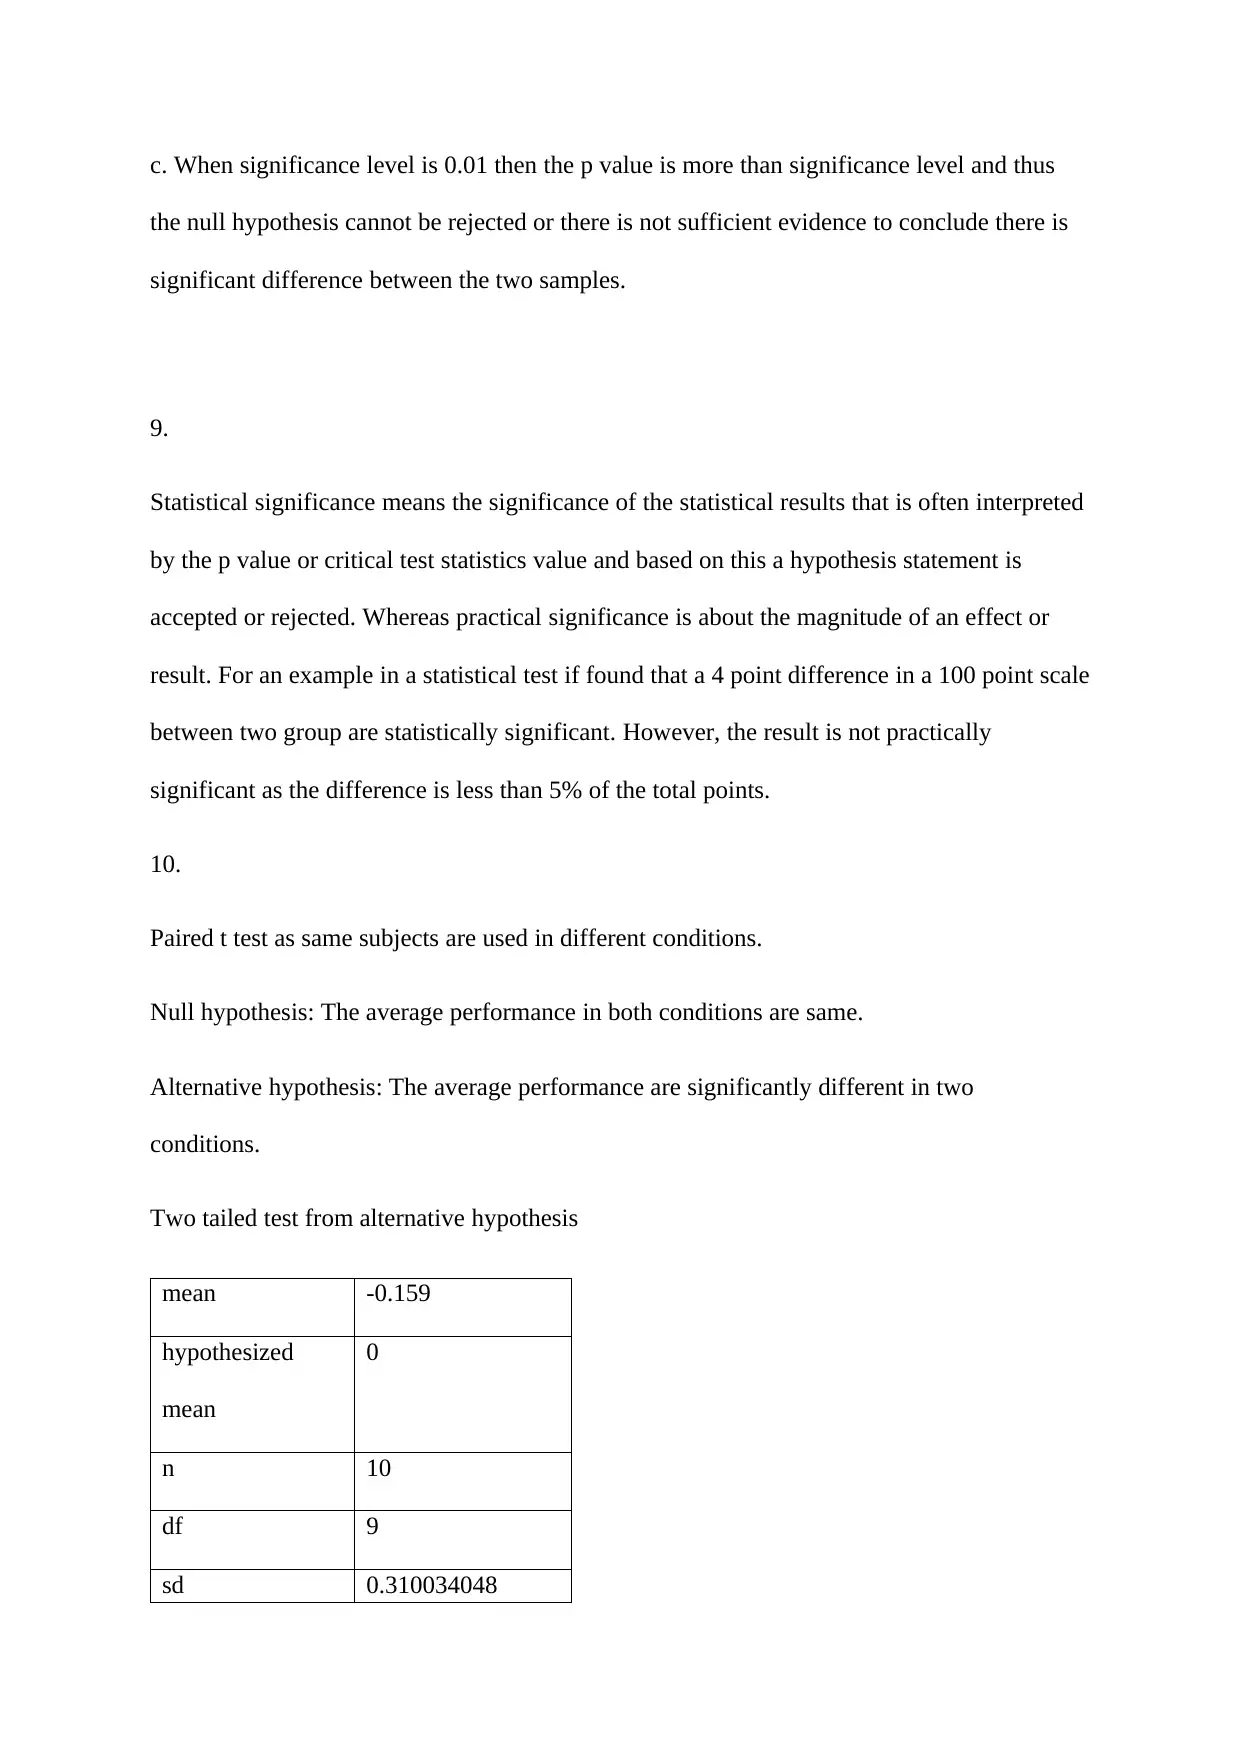
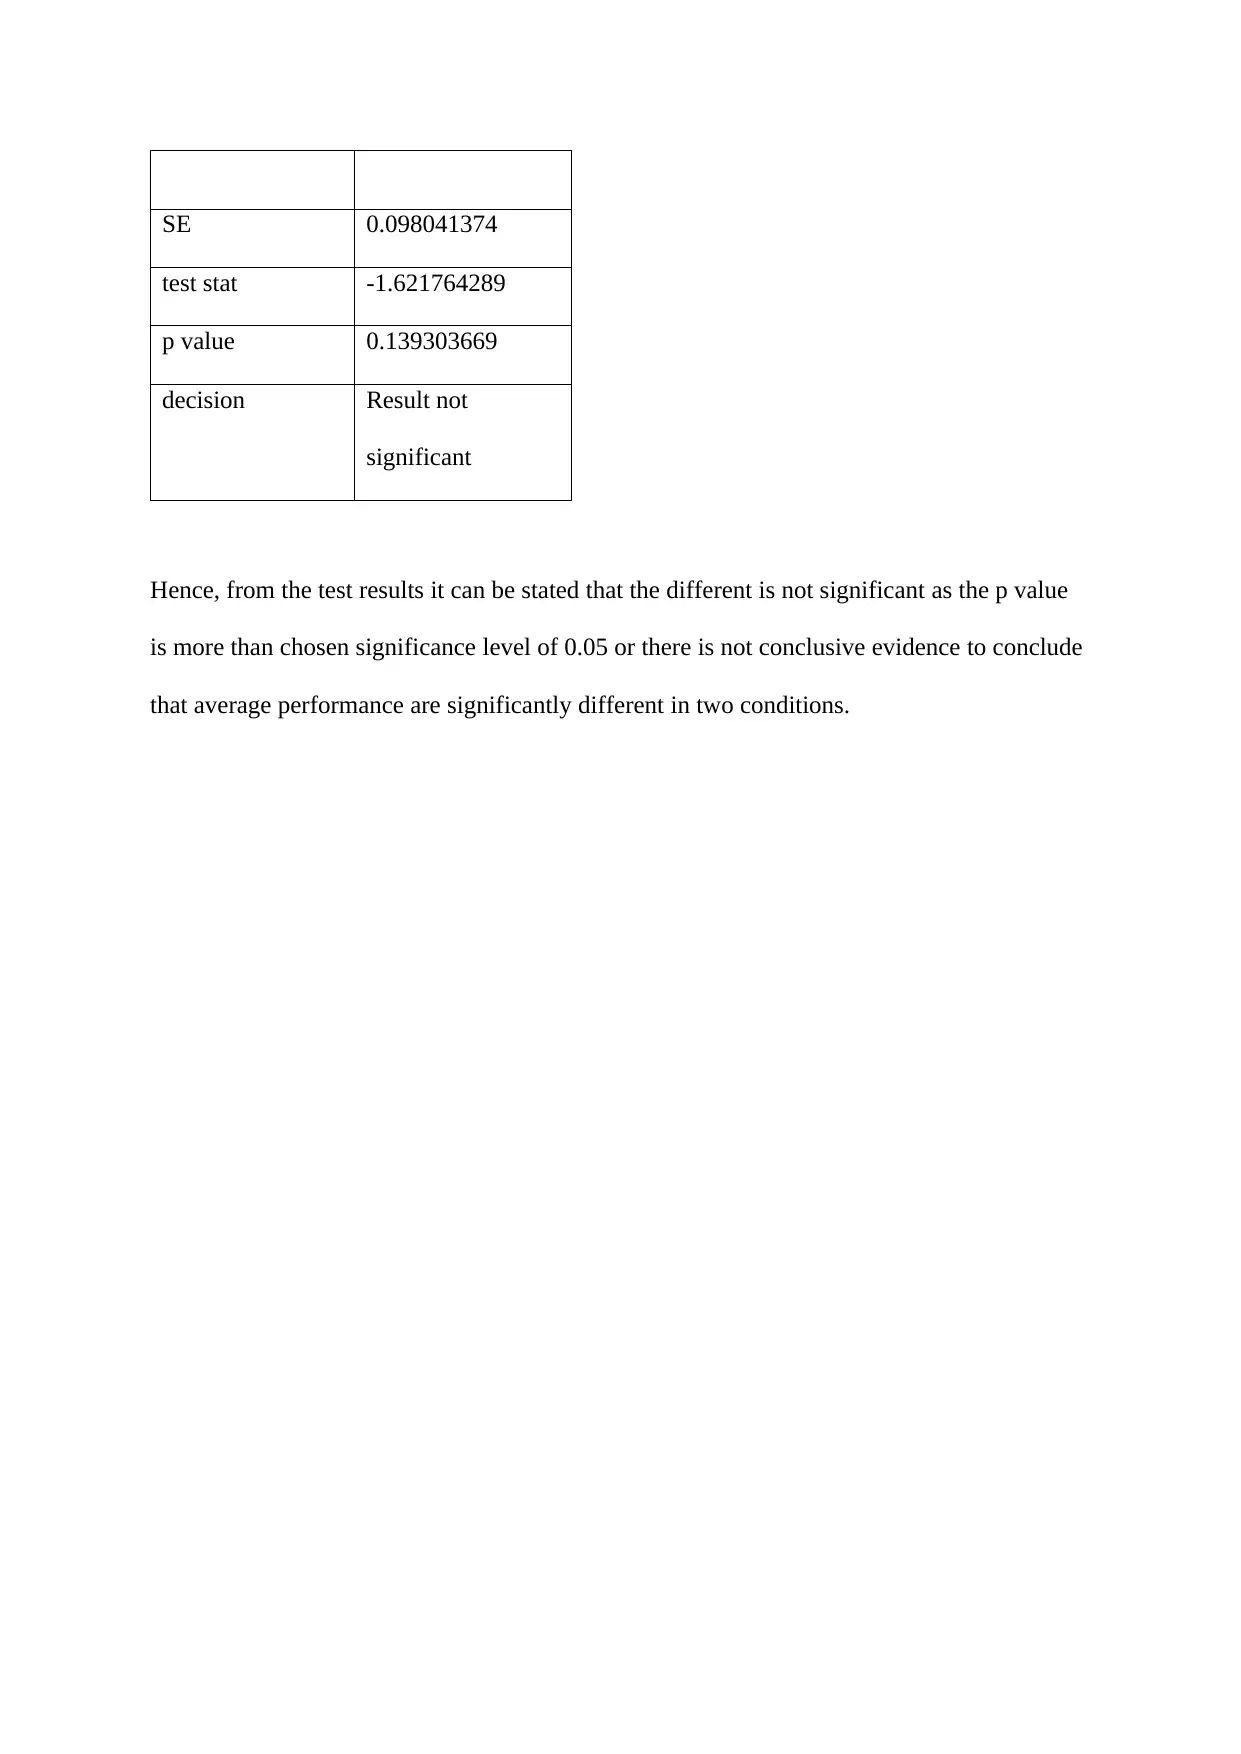
Your All-in-One AI-Powered Toolkit for Academic Success.
 +13062052269
info@desklib.com
Available 24*7 on WhatsApp / Email
Unlock your academic potential
Copyright © 2020–2025 A2Z Services. All Rights Reserved. Developed and managed by ZUCOL.