200032 Statistics for Business: Hypothesis Testing & Regression
VerifiedAdded on 2023/06/10
|8
|726
|67
Homework Assignment
AI Summary
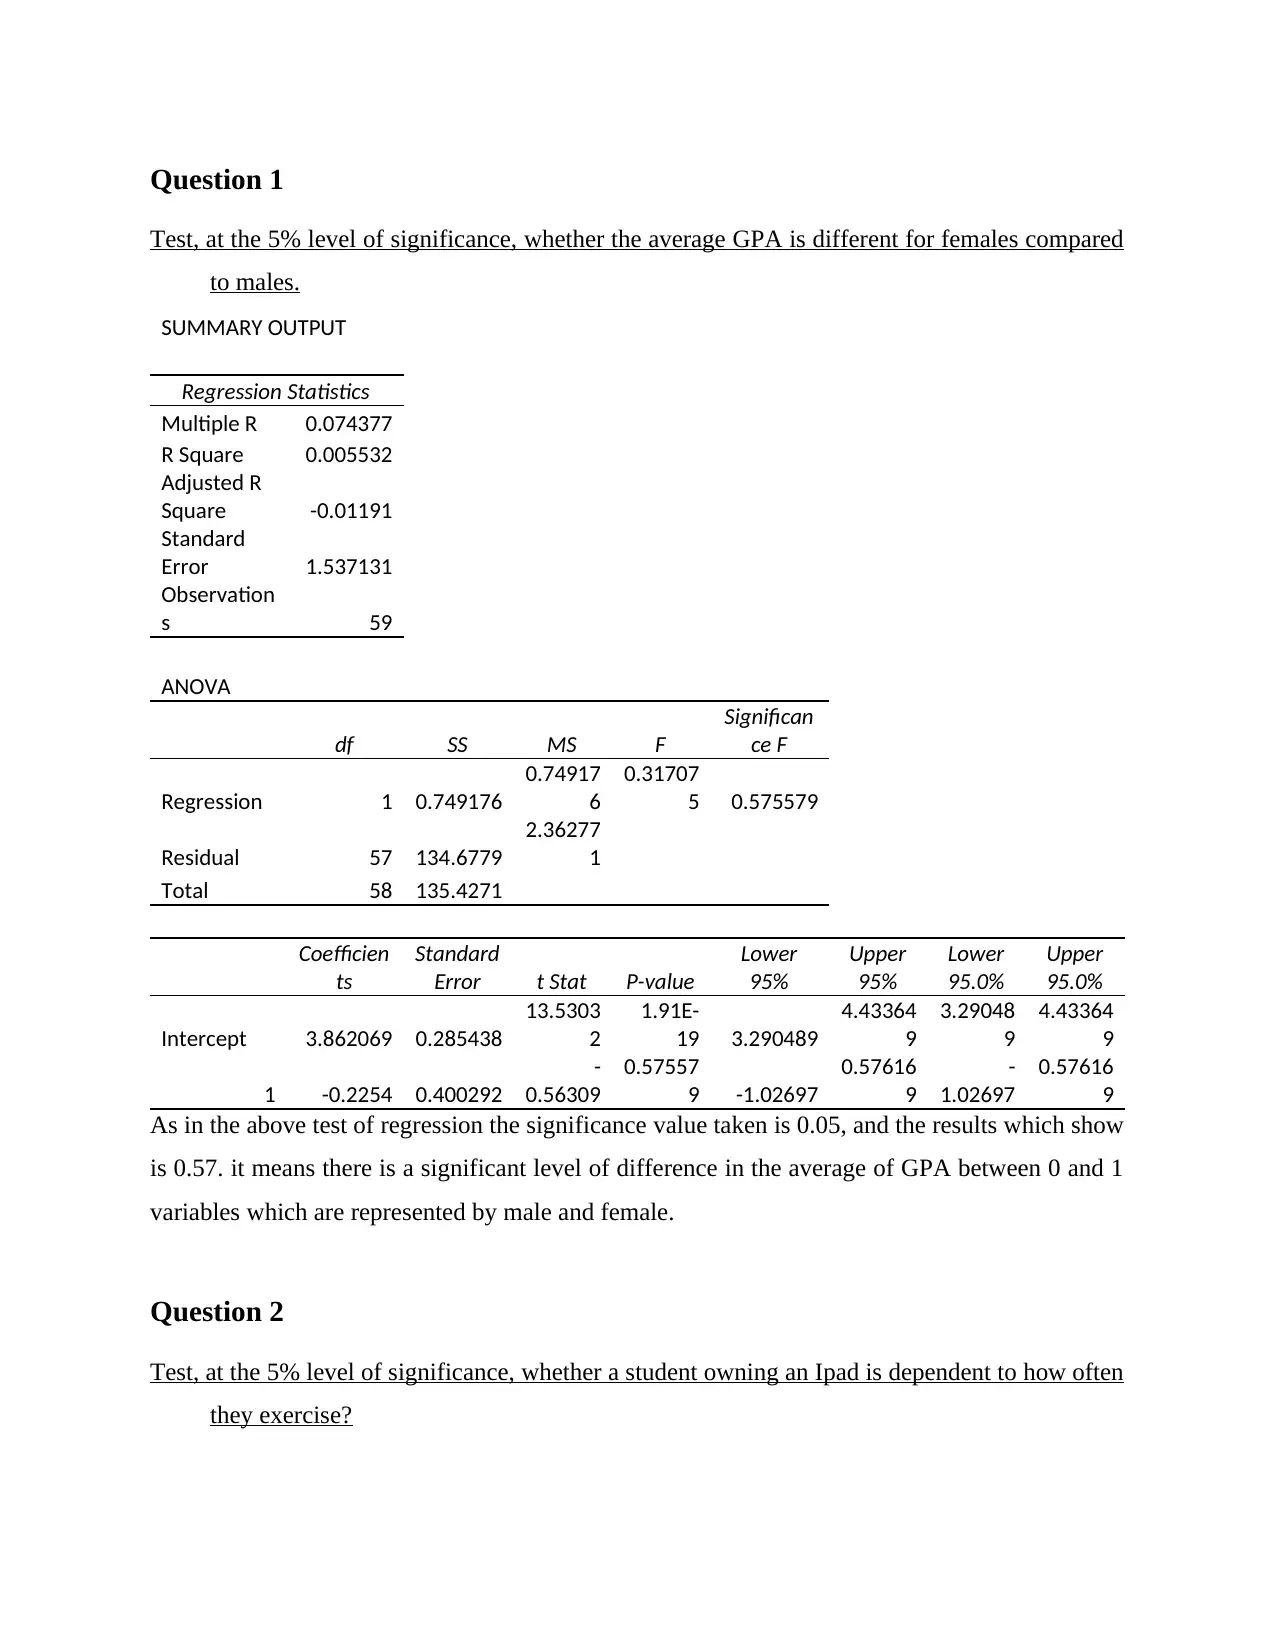
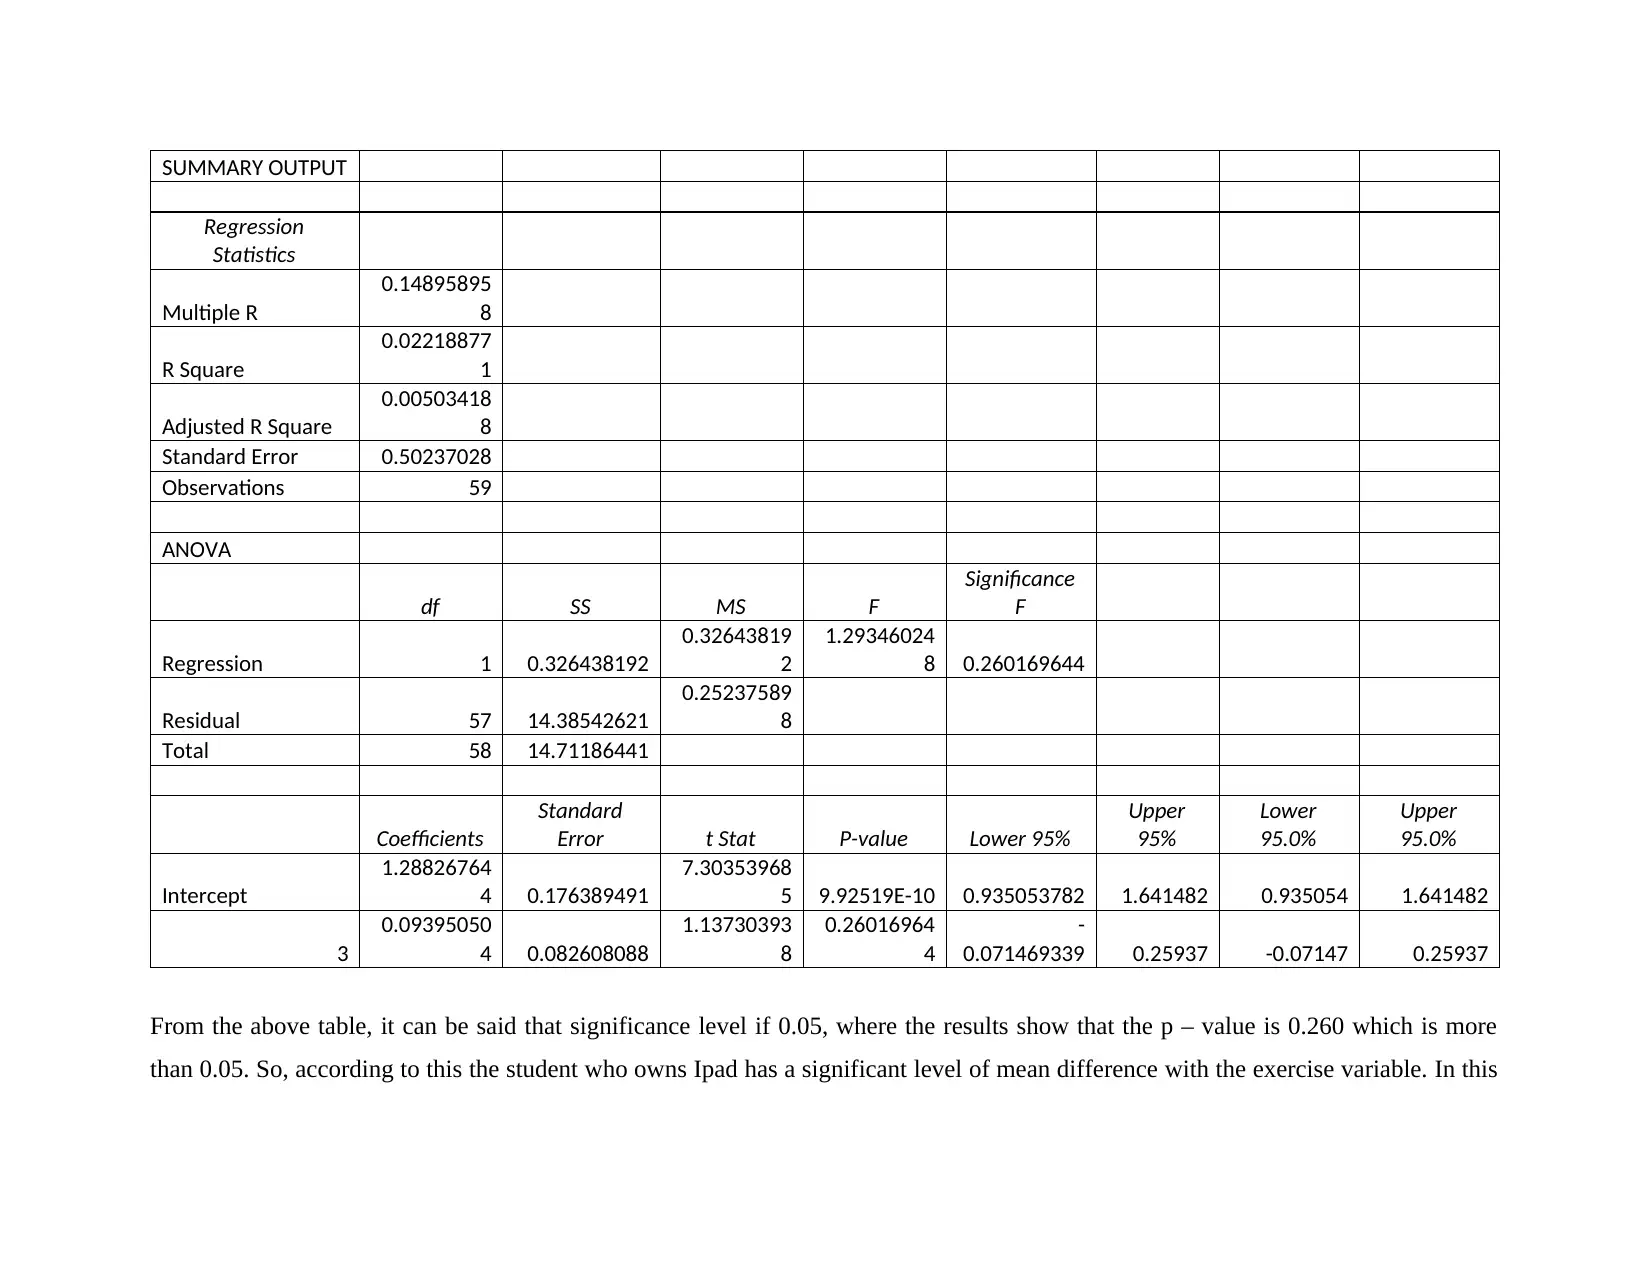
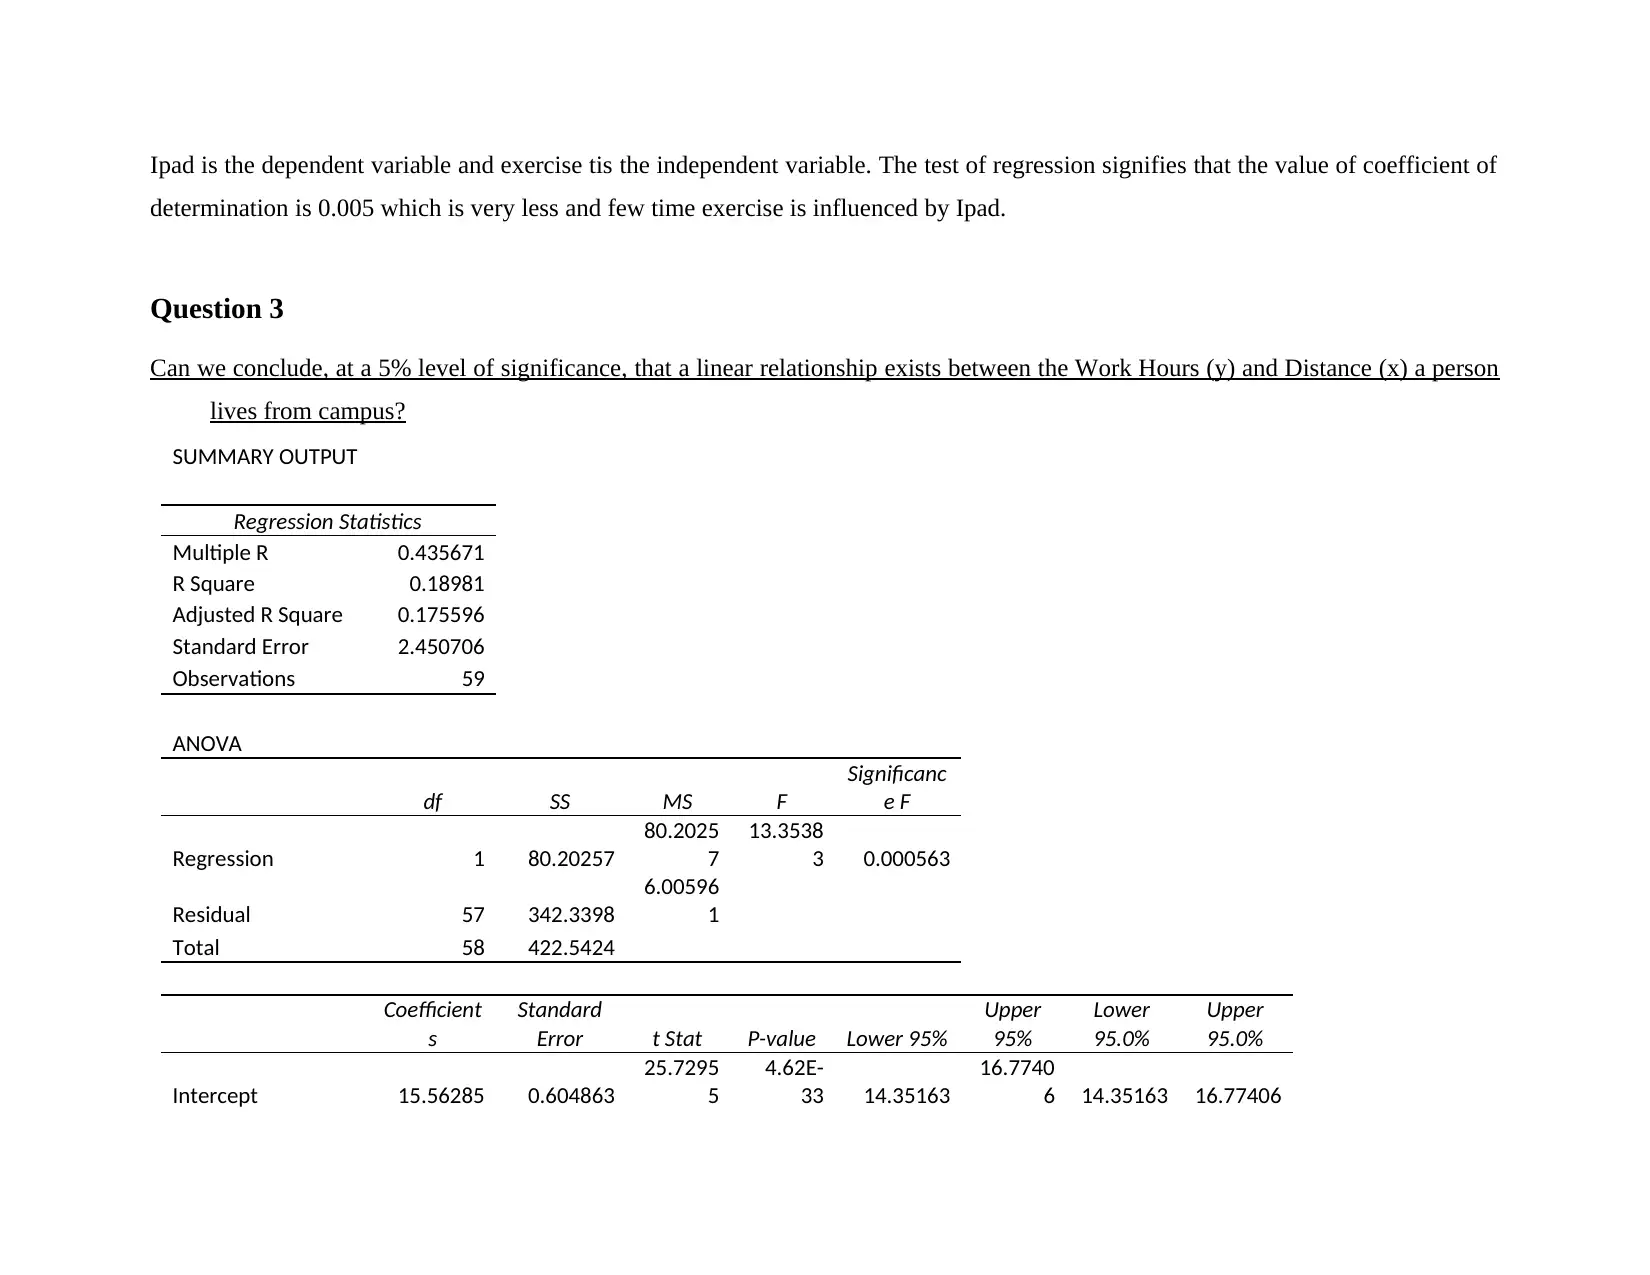
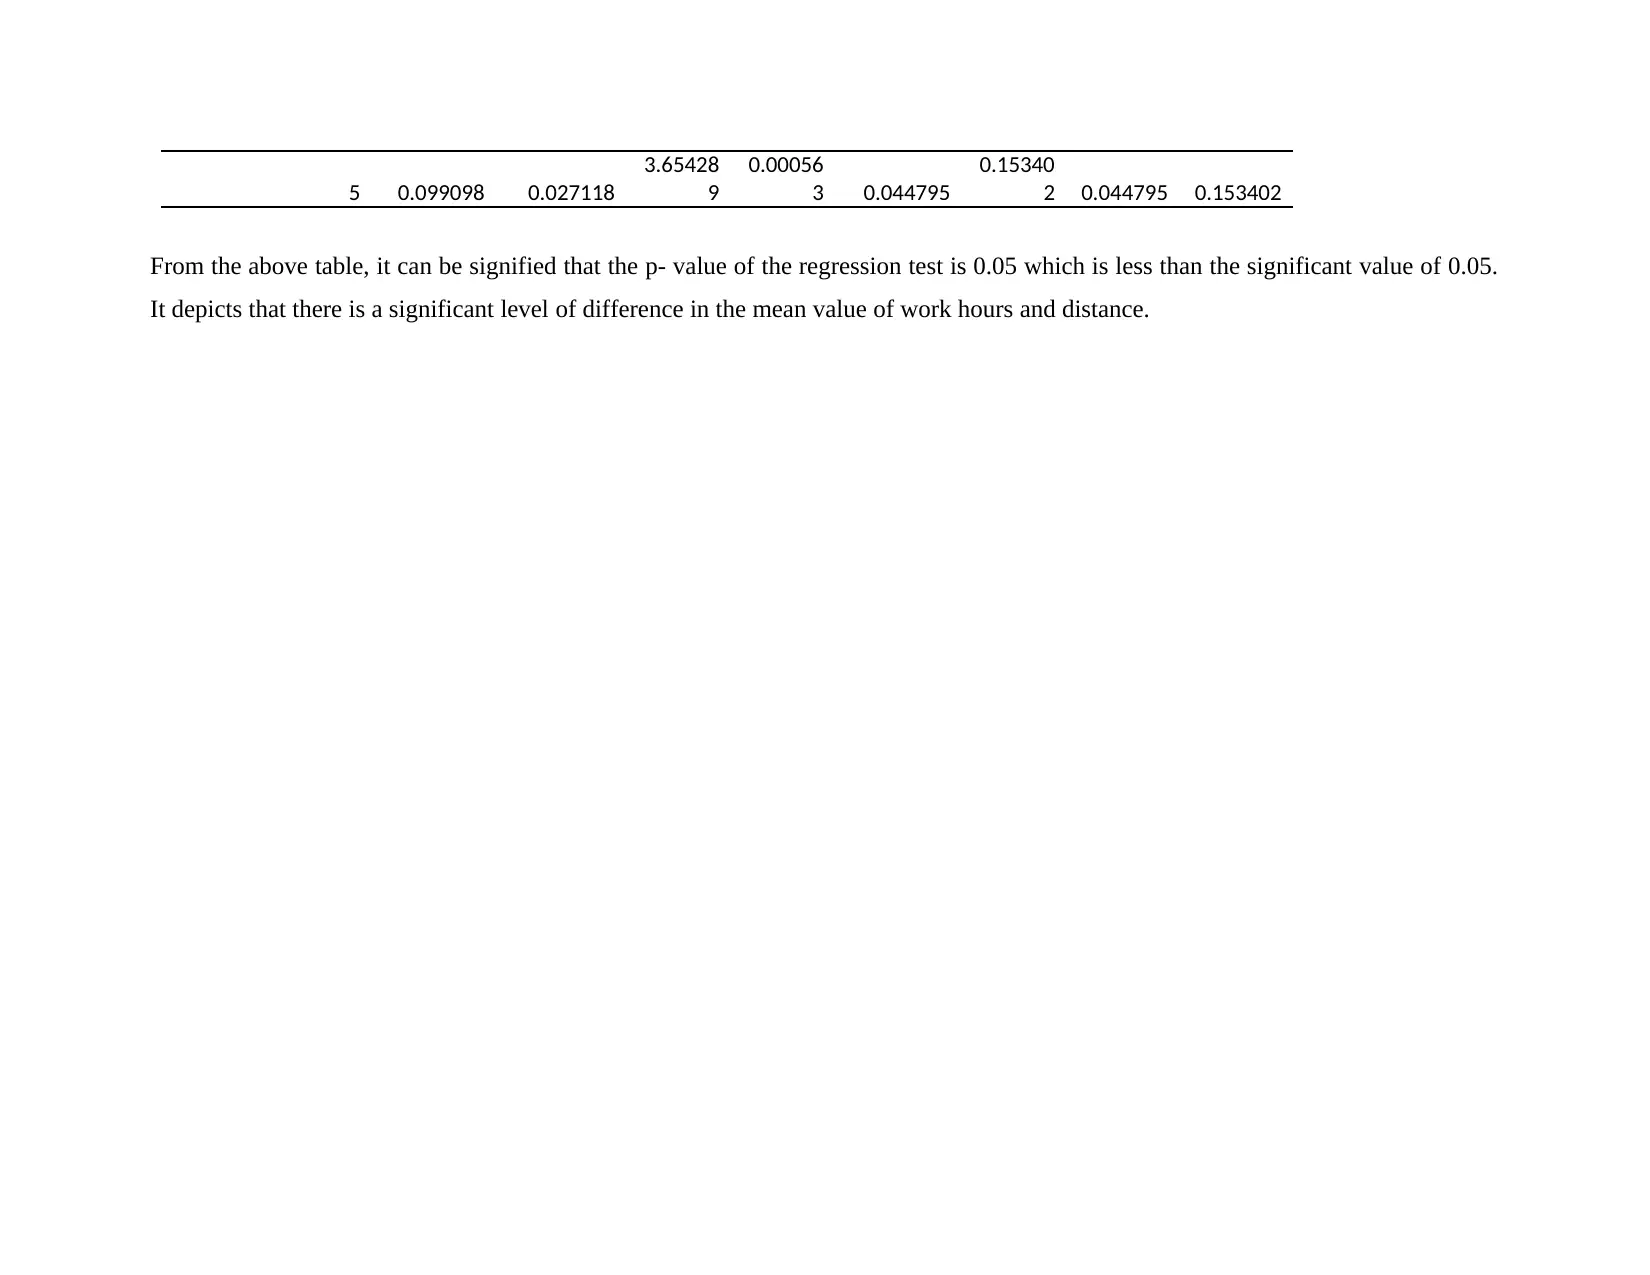
This assignment solution covers three statistical questions using hypothesis testing and regression analysis. The first question examines whether the average GPA differs significantly between males and females, concluding there is a significant difference based on the p-value. The second question investigates the dependence between owning an iPad and exercise frequency, finding no significant relationship. Finally, the third question analyzes the linear relationship between work hours and distance from campus, determining a significant relationship exists. Excel outputs are used to support the conclusions, with significance levels set at 5% for all tests. Desklib offers a range of study tools and solved assignments for students.

Statistics
Paraphrase This Document
Need a fresh take? Get an instant paraphrase of this document with our AI Paraphraser

Contents
Question 1........................................................................................................................................3
Test, at the 5% level of significance, whether the average GPA is different for females
compared to males.......................................................................................................................3
Question 2........................................................................................................................................3
Test, at the 5% level of significance, whether a student owning an Ipad is dependent to how
often they exercise?.....................................................................................................................3
Question 3........................................................................................................................................5
Can we conclude, at a 5% level of significance, that a linear relationship exists between the
Work Hours (y) and Distance (x) a person lives from campus?..................................................5
REFERENCES................................................................................................................................7

Question 1
Test, at the 5% level of significance, whether the average GPA is different for females compared
to males.
SUMMARY OUTPUT
Regression Statistics
Multiple R 0.074377
R Square 0.005532
Adjusted R
Square -0.01191
Standard
Error 1.537131
Observation
s 59
ANOVA
df SS MS F
Significan
ce F
Regression 1 0.749176
0.74917
6
0.31707
5 0.575579
Residual 57 134.6779
2.36277
1
Total 58 135.4271
Coefficien
ts
Standard
Error t Stat P-value
Lower
95%
Upper
95%
Lower
95.0%
Upper
95.0%
Intercept 3.862069 0.285438
13.5303
2
1.91E-
19 3.290489
4.43364
9
3.29048
9
4.43364
9
1 -0.2254 0.400292
-
0.56309
0.57557
9 -1.02697
0.57616
9
-
1.02697
0.57616
9
As in the above test of regression the significance value taken is 0.05, and the results which show
is 0.57. it means there is a significant level of difference in the average of GPA between 0 and 1
variables which are represented by male and female.
Question 2
Test, at the 5% level of significance, whether a student owning an Ipad is dependent to how often
they exercise?
⊘ This is a preview!⊘
Do you want full access?
Subscribe today to unlock all pages.

Trusted by 1+ million students worldwide

SUMMARY OUTPUT
Regression
Statistics
Multiple R
0.14895895
8
R Square
0.02218877
1
Adjusted R Square
0.00503418
8
Standard Error 0.50237028
Observations 59
ANOVA
df SS MS F
Significance
F
Regression 1 0.326438192
0.32643819
2
1.29346024
8 0.260169644
Residual 57 14.38542621
0.25237589
8
Total 58 14.71186441
Coefficients
Standard
Error t Stat P-value Lower 95%
Upper
95%
Lower
95.0%
Upper
95.0%
Intercept
1.28826764
4 0.176389491
7.30353968
5 9.92519E-10 0.935053782 1.641482 0.935054 1.641482
3
0.09395050
4 0.082608088
1.13730393
8
0.26016964
4
-
0.071469339 0.25937 -0.07147 0.25937
From the above table, it can be said that significance level if 0.05, where the results show that the p – value is 0.260 which is more
than 0.05. So, according to this the student who owns Ipad has a significant level of mean difference with the exercise variable. In this
Paraphrase This Document
Need a fresh take? Get an instant paraphrase of this document with our AI Paraphraser

Ipad is the dependent variable and exercise tis the independent variable. The test of regression signifies that the value of coefficient of
determination is 0.005 which is very less and few time exercise is influenced by Ipad.
Question 3
Can we conclude, at a 5% level of significance, that a linear relationship exists between the Work Hours (y) and Distance (x) a person
lives from campus?
SUMMARY OUTPUT
Regression Statistics
Multiple R 0.435671
R Square 0.18981
Adjusted R Square 0.175596
Standard Error 2.450706
Observations 59
ANOVA
df SS MS F
Significanc
e F
Regression 1 80.20257
80.2025
7
13.3538
3 0.000563
Residual 57 342.3398
6.00596
1
Total 58 422.5424
Coefficient
s
Standard
Error t Stat P-value Lower 95%
Upper
95%
Lower
95.0%
Upper
95.0%
Intercept 15.56285 0.604863
25.7295
5
4.62E-
33 14.35163
16.7740
6 14.35163 16.77406

5 0.099098 0.027118
3.65428
9
0.00056
3 0.044795
0.15340
2 0.044795 0.153402
From the above table, it can be signified that the p- value of the regression test is 0.05 which is less than the significant value of 0.05.
It depicts that there is a significant level of difference in the mean value of work hours and distance.
⊘ This is a preview!⊘
Do you want full access?
Subscribe today to unlock all pages.

Trusted by 1+ million students worldwide

REFERENCES
Books and Journals
Lei, W.S. and et.al., 2021. Standardized Weibull statistics of ceramic strength. Ceramics International, 47(4), pp.4972-4993.
Lohr, S., 2019. Measuring crime: Behind the statistics. Chapman and Hall/CRC.
Xu, D., Wu, Z. and Huang, Y., 2019. A new adaptive Kalman filter with inaccurate noise statistics. Circuits, Systems, and Signal
Processing, 38(9), pp.4380-4404.
Paraphrase This Document
Need a fresh take? Get an instant paraphrase of this document with our AI Paraphraser

1 out of 8
Related Documents
Your All-in-One AI-Powered Toolkit for Academic Success.
+13062052269
info@desklib.com
Available 24*7 on WhatsApp / Email
Unlock your academic potential
Copyright © 2020–2025 A2Z Services. All Rights Reserved. Developed and managed by ZUCOL.


