Desklib Statistics: Worksheet 2 Solutions - Tables and Graphs Analysis
VerifiedAdded on 2022/08/29
|12
|602
|19
Homework Assignment
AI Summary
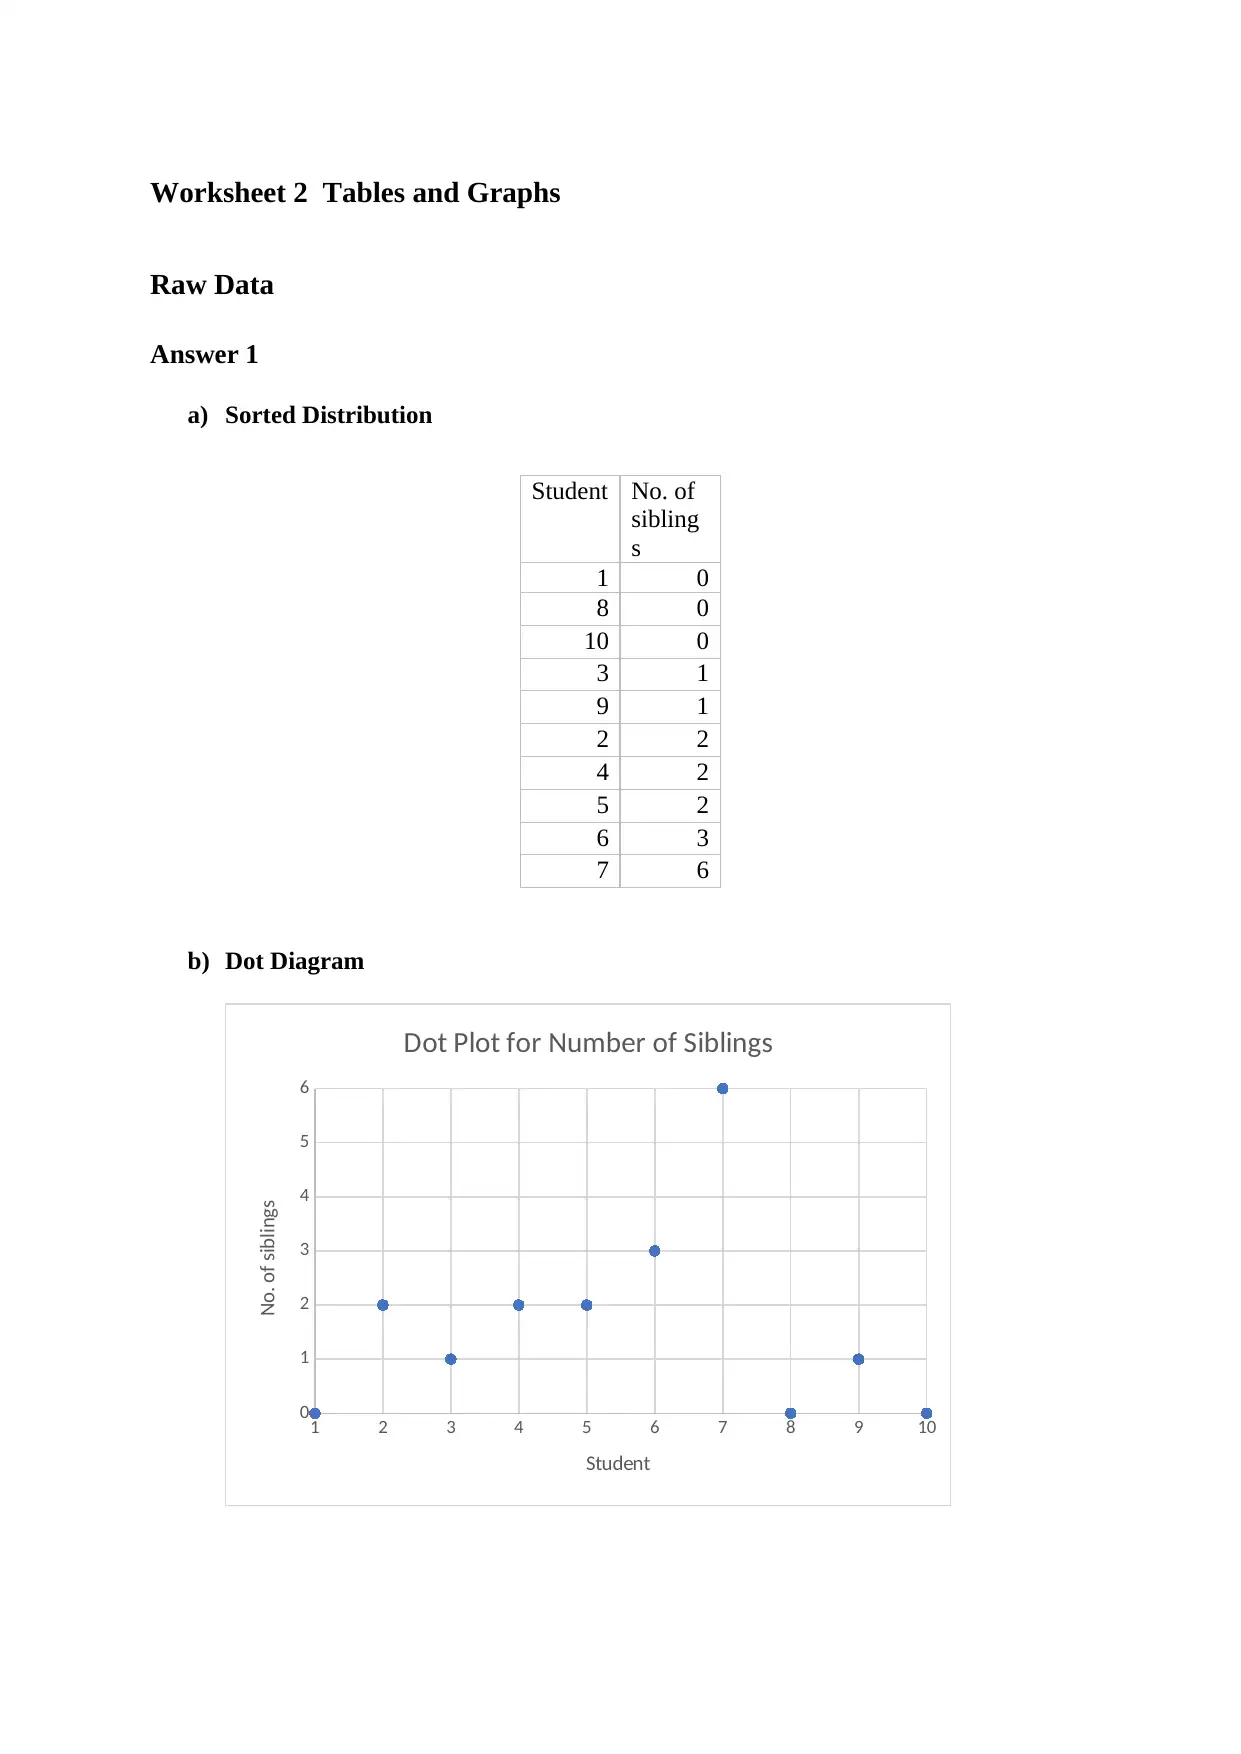
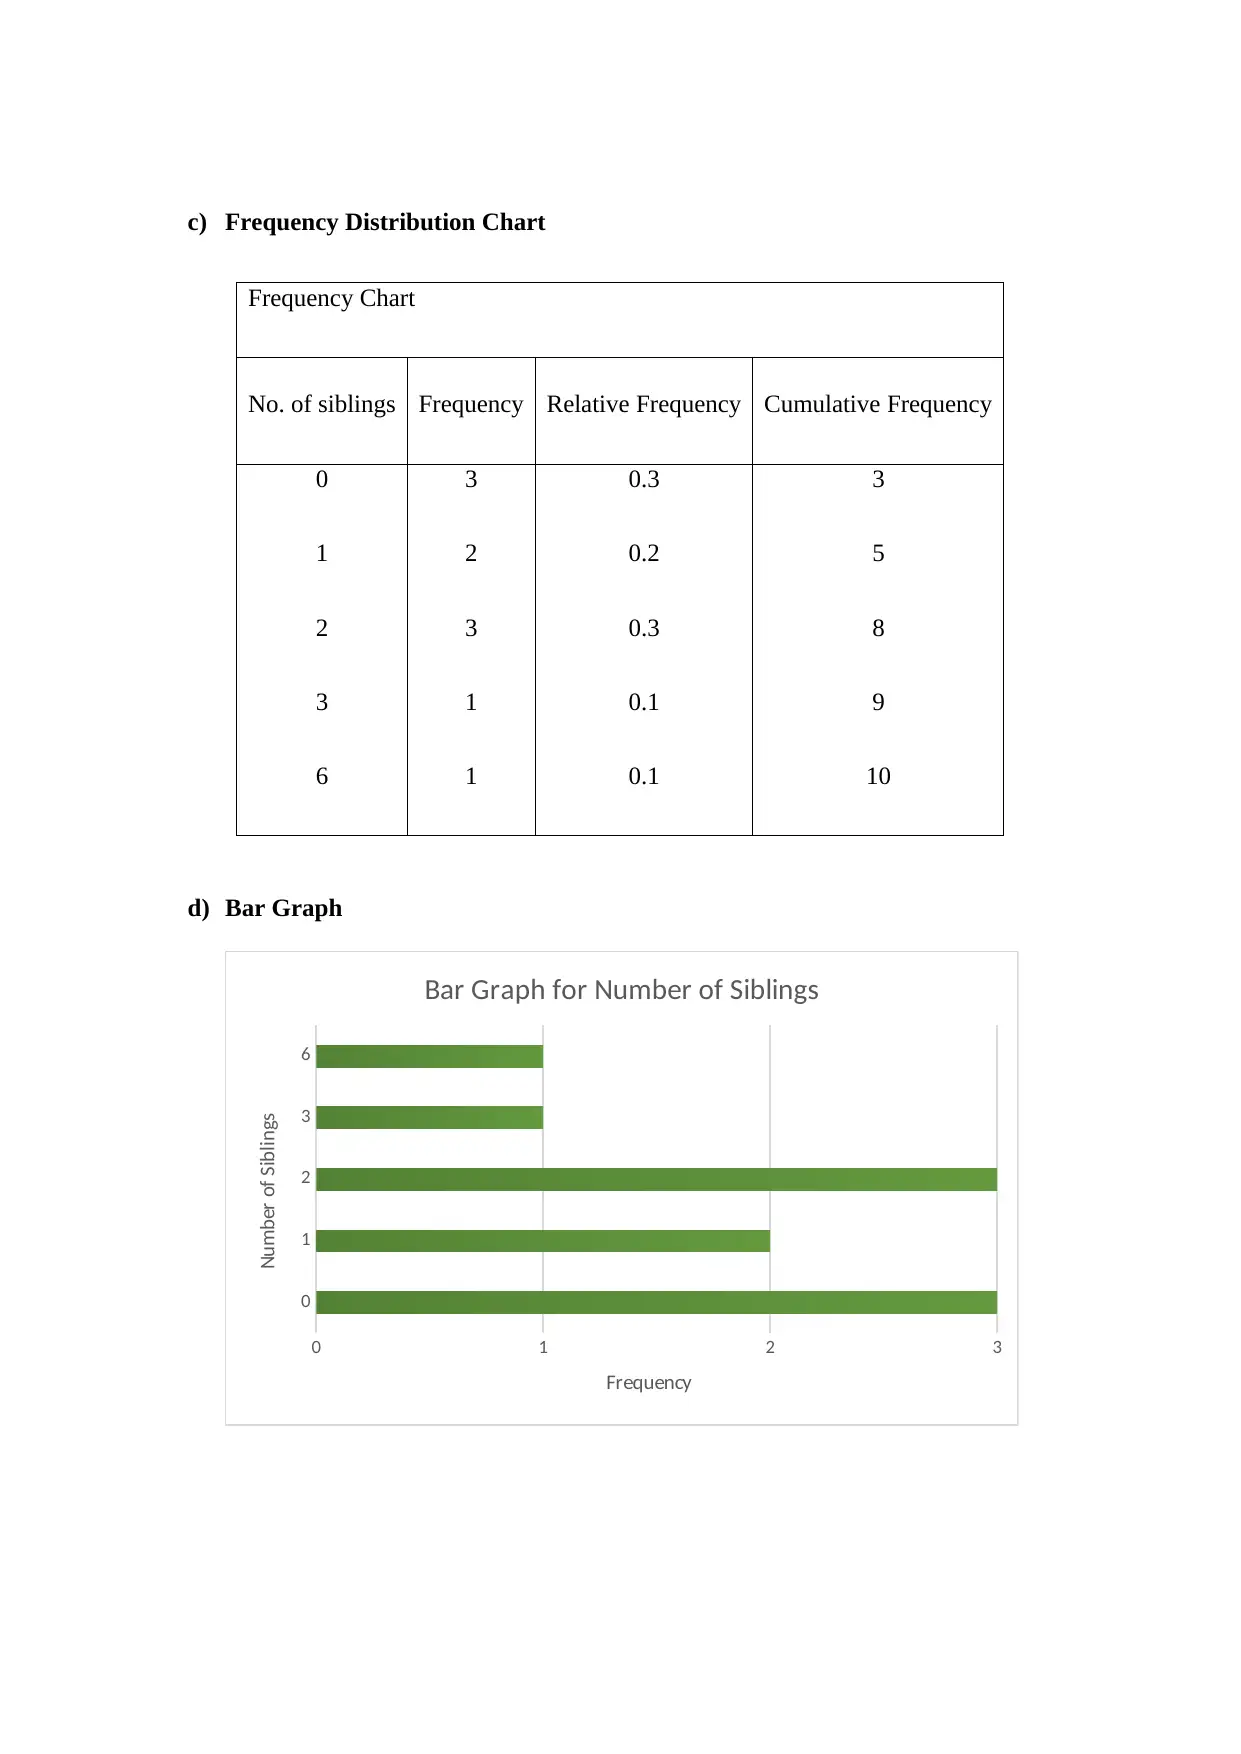
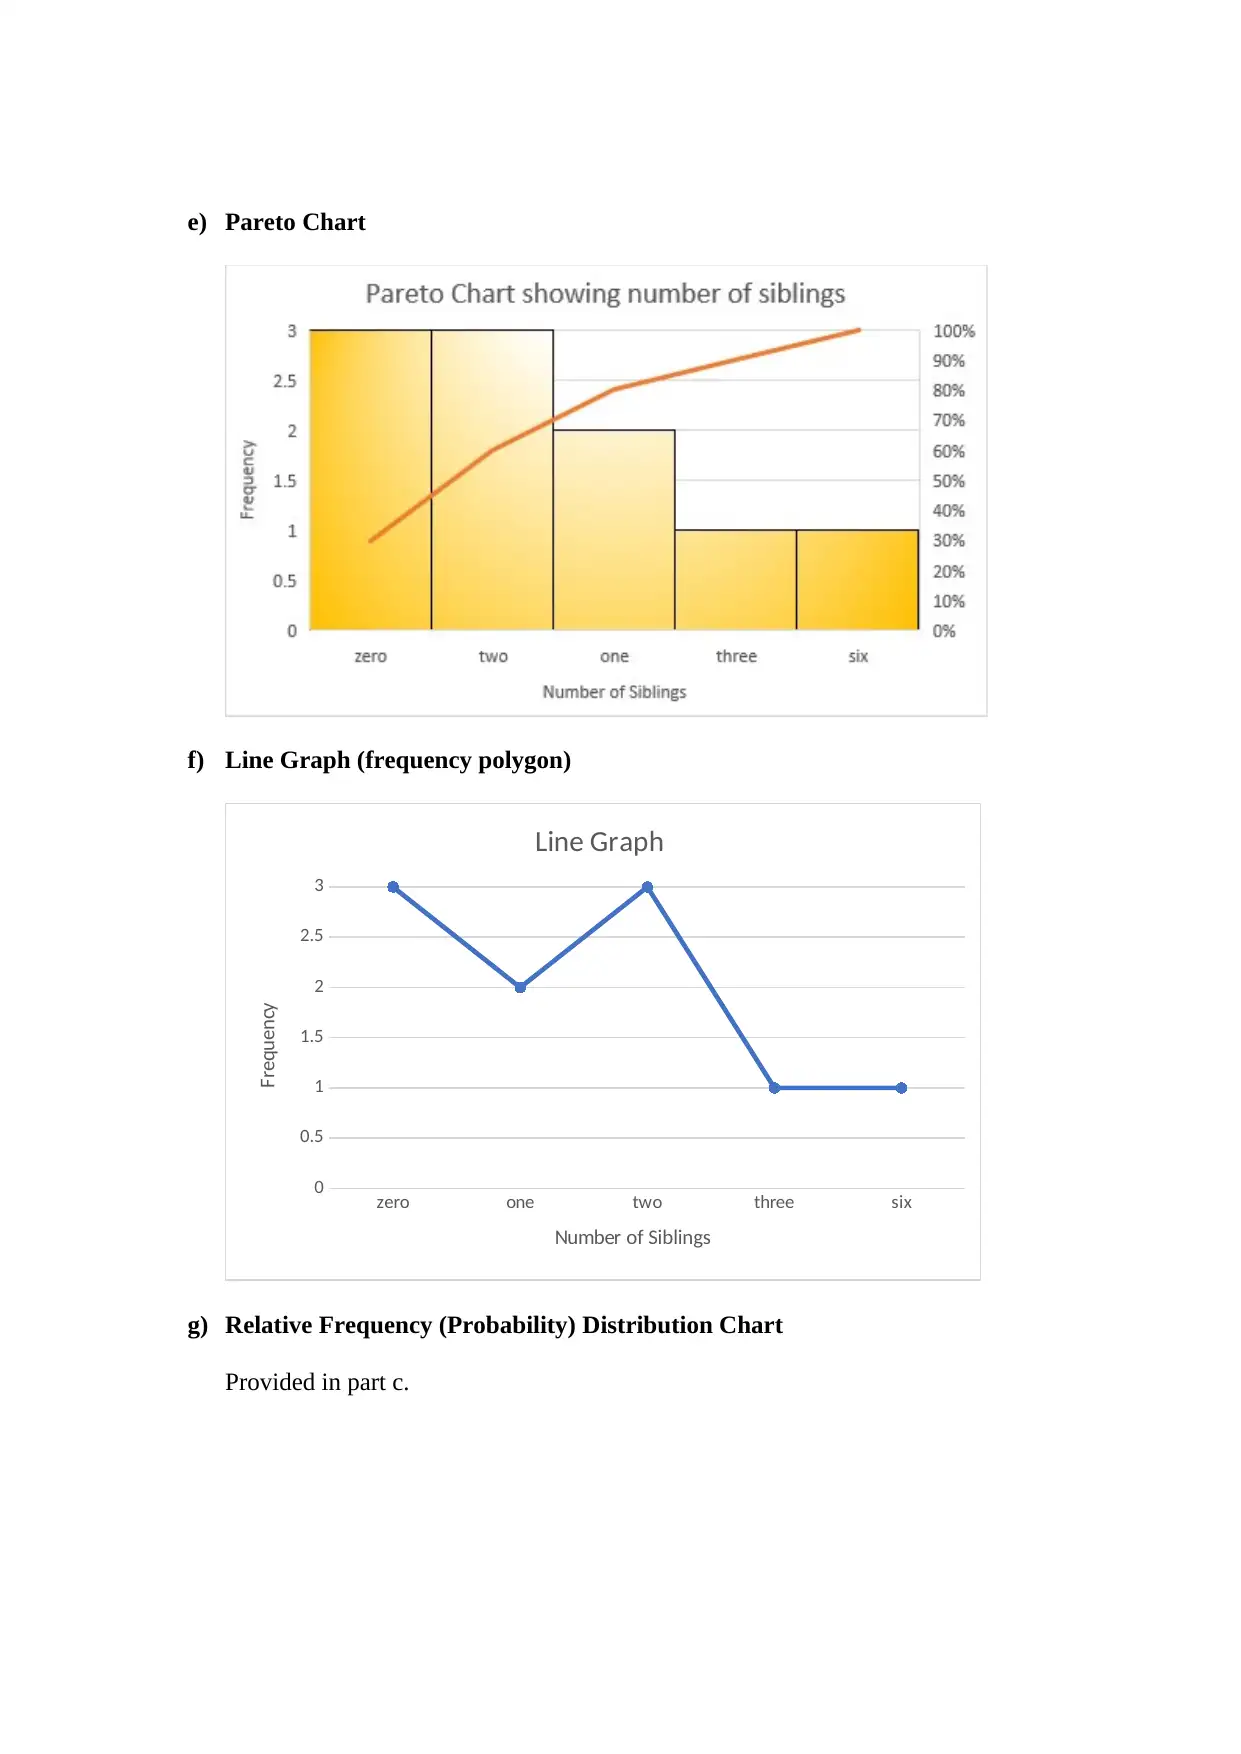
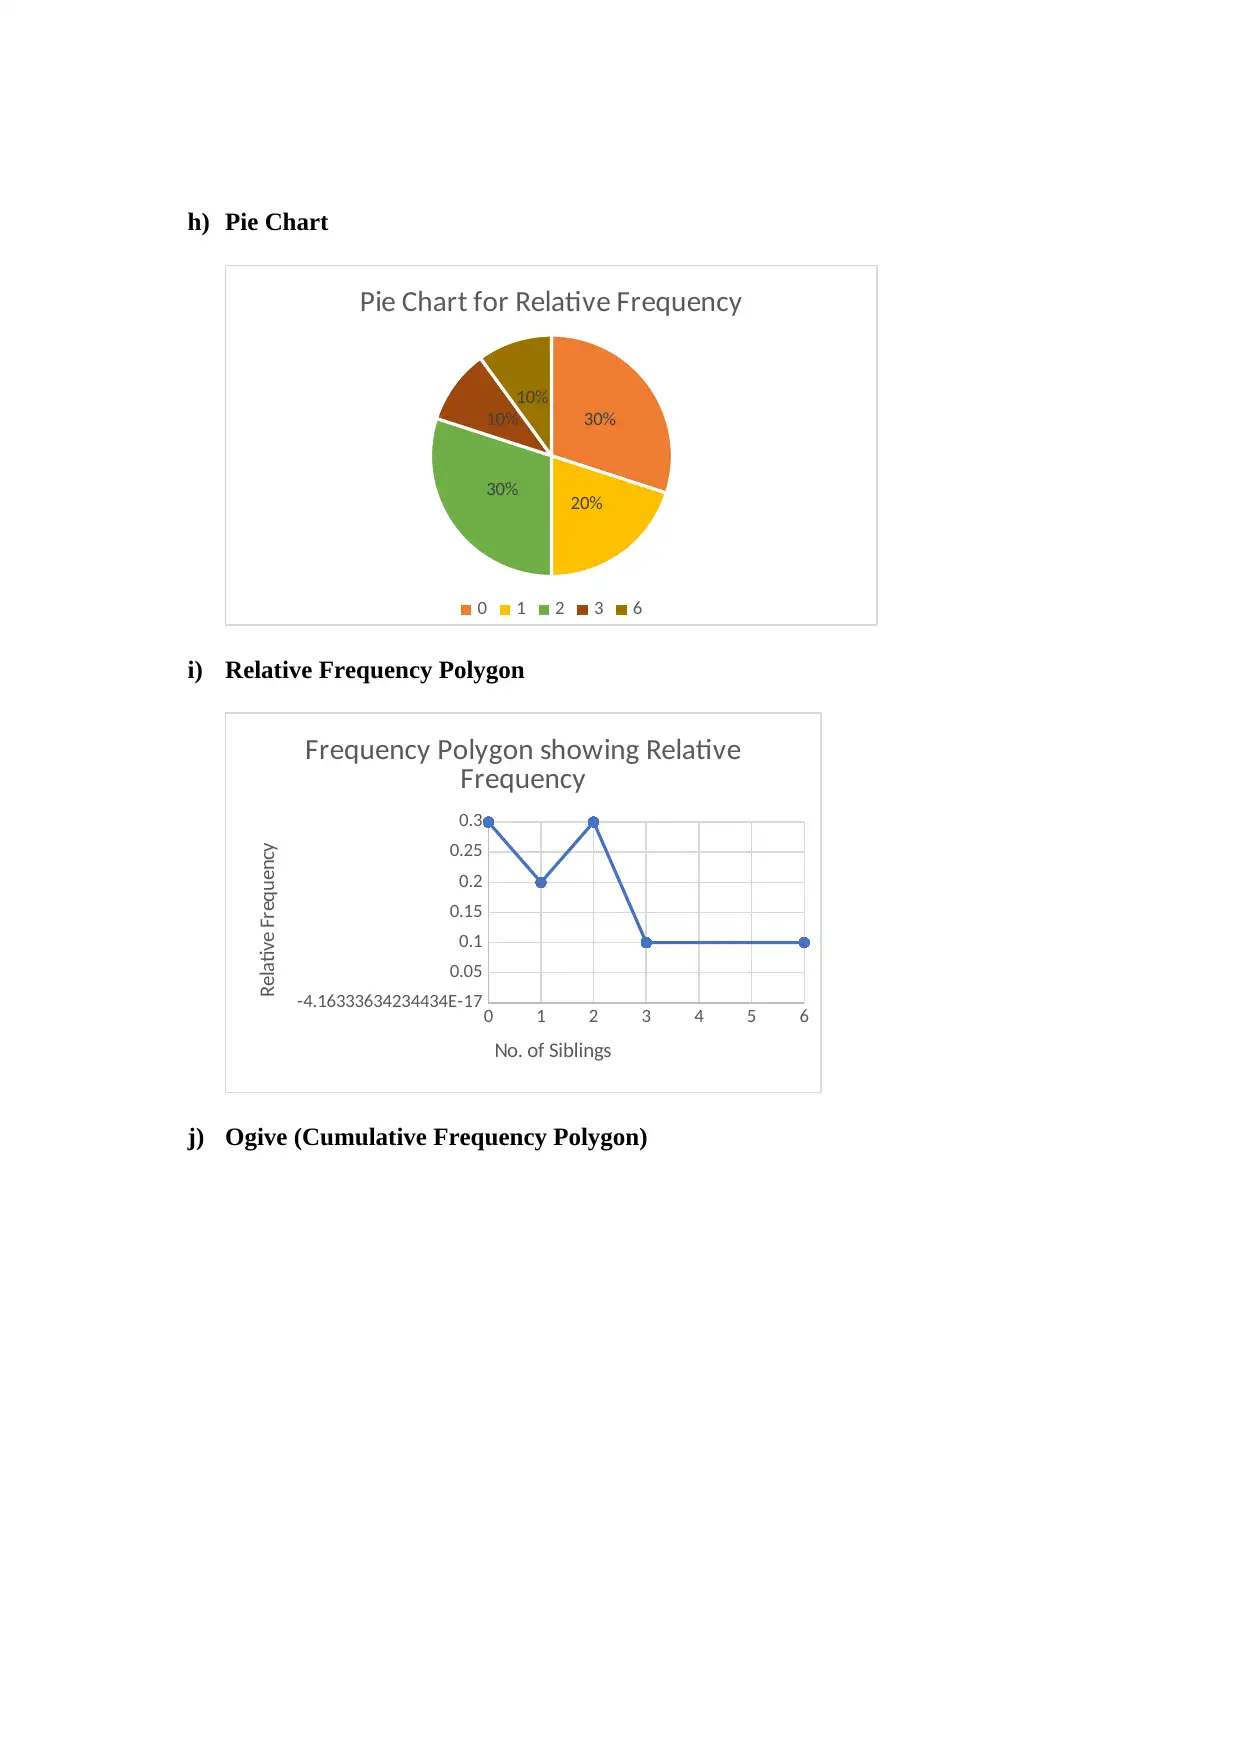
This document contains the solutions to Worksheet 2, focusing on tables and graphs, along with raw data analysis. The solutions cover a range of statistical concepts, including sorted distributions, dot diagrams, frequency distribution charts, bar graphs, Pareto charts, line graphs, pie charts, relative frequency polygons, and ogives. The assignment includes interpreting graphs, constructing relative frequency tables, identifying outliers, and analyzing various data representations. Further, the solutions involve interpreting graphs showing car speeds, plant growth, sales data, and population trends. The solutions also include stem and leaf diagrams and frequency analysis. The document provides detailed answers to interpret the data, calculate frequencies, and identify trends. The worksheet covers a broad range of data analysis and graph interpretation skills.
1 out of 12
Related Documents


Your All-in-One AI-Powered Toolkit for Academic Success.
+13062052269
info@desklib.com
Available 24*7 on WhatsApp / Email
![[object Object]](/_next/static/media/star-bottom.7253800d.svg)
Copyright © 2020–2026 A2Z Services. All Rights Reserved. Developed and managed by ZUCOL.