STATS 2040: Data Analysis Assignment, Winter 2020, University
VerifiedAdded on 2022/09/13
|8
|1466
|10
Homework Assignment
AI Summary
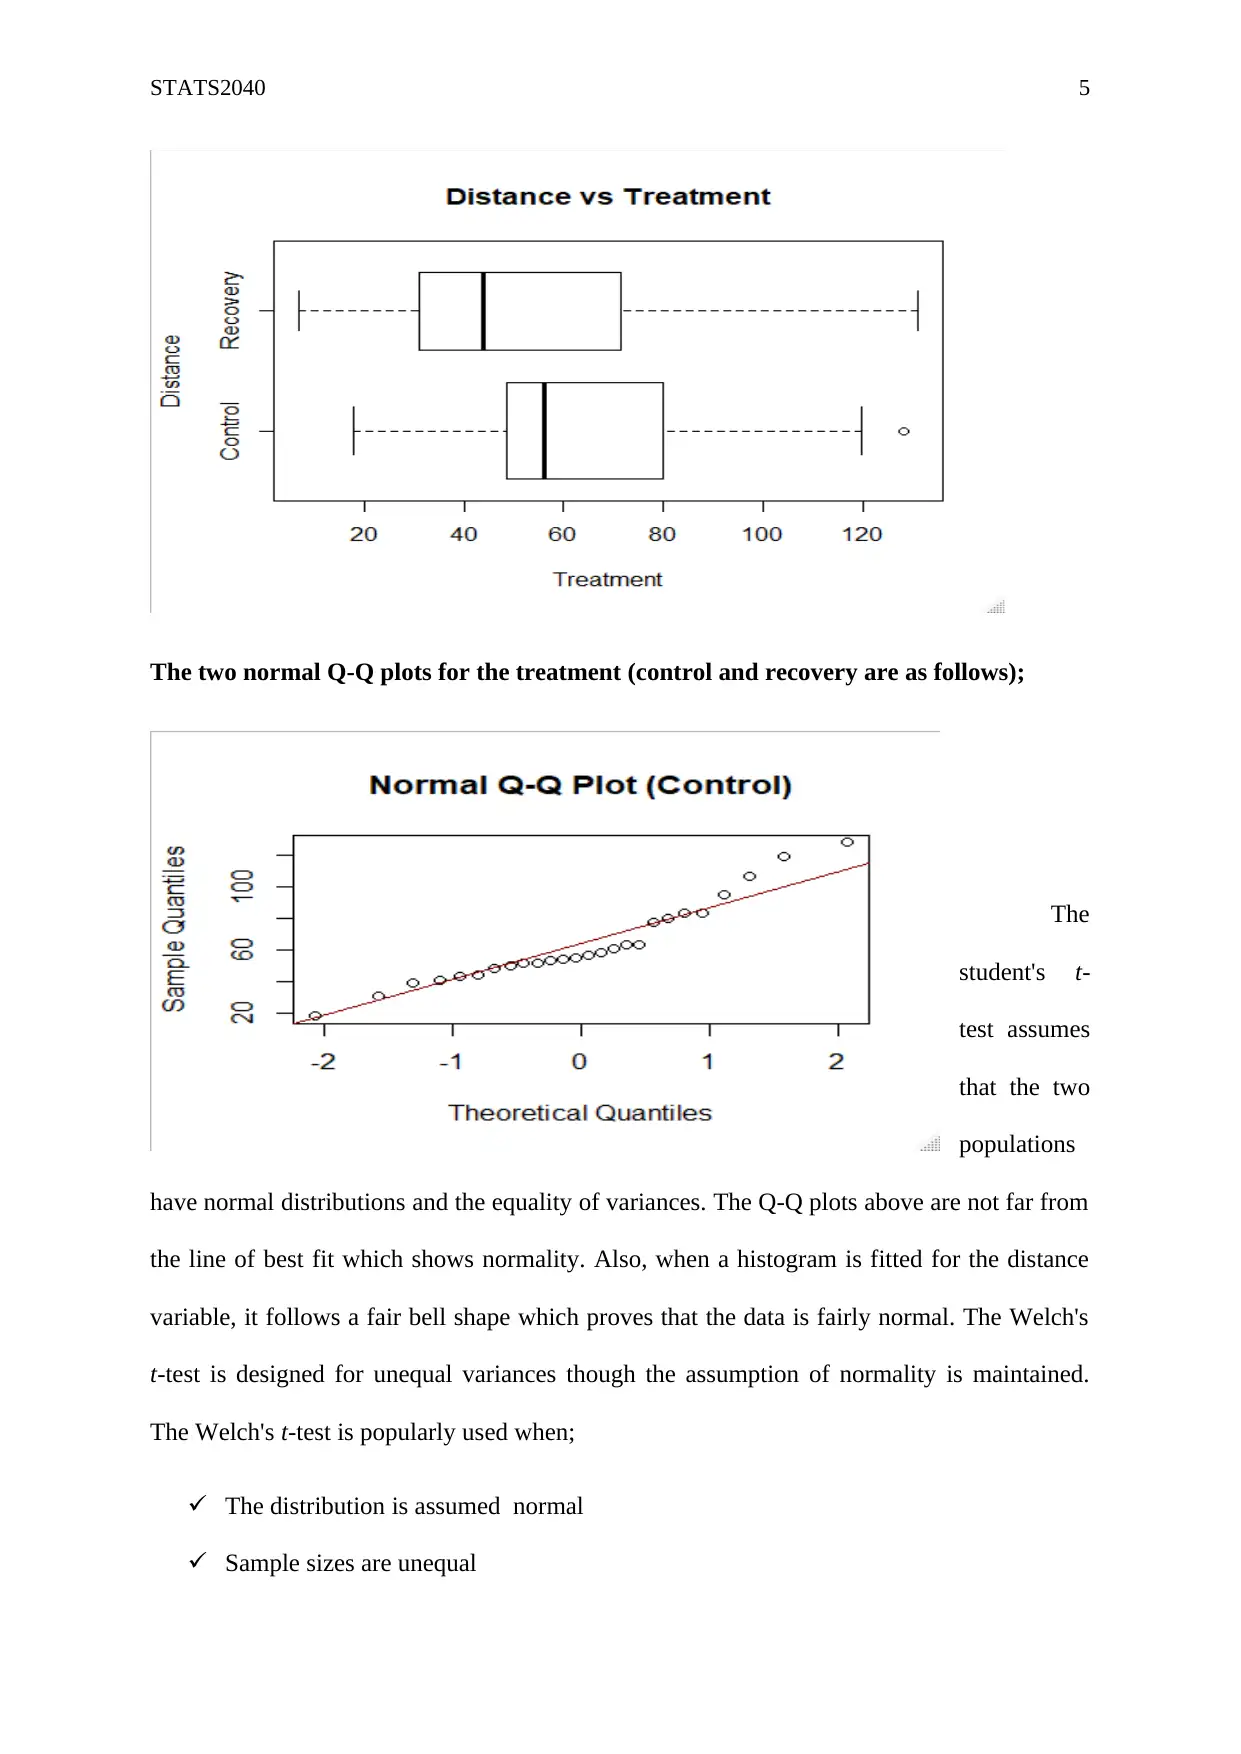
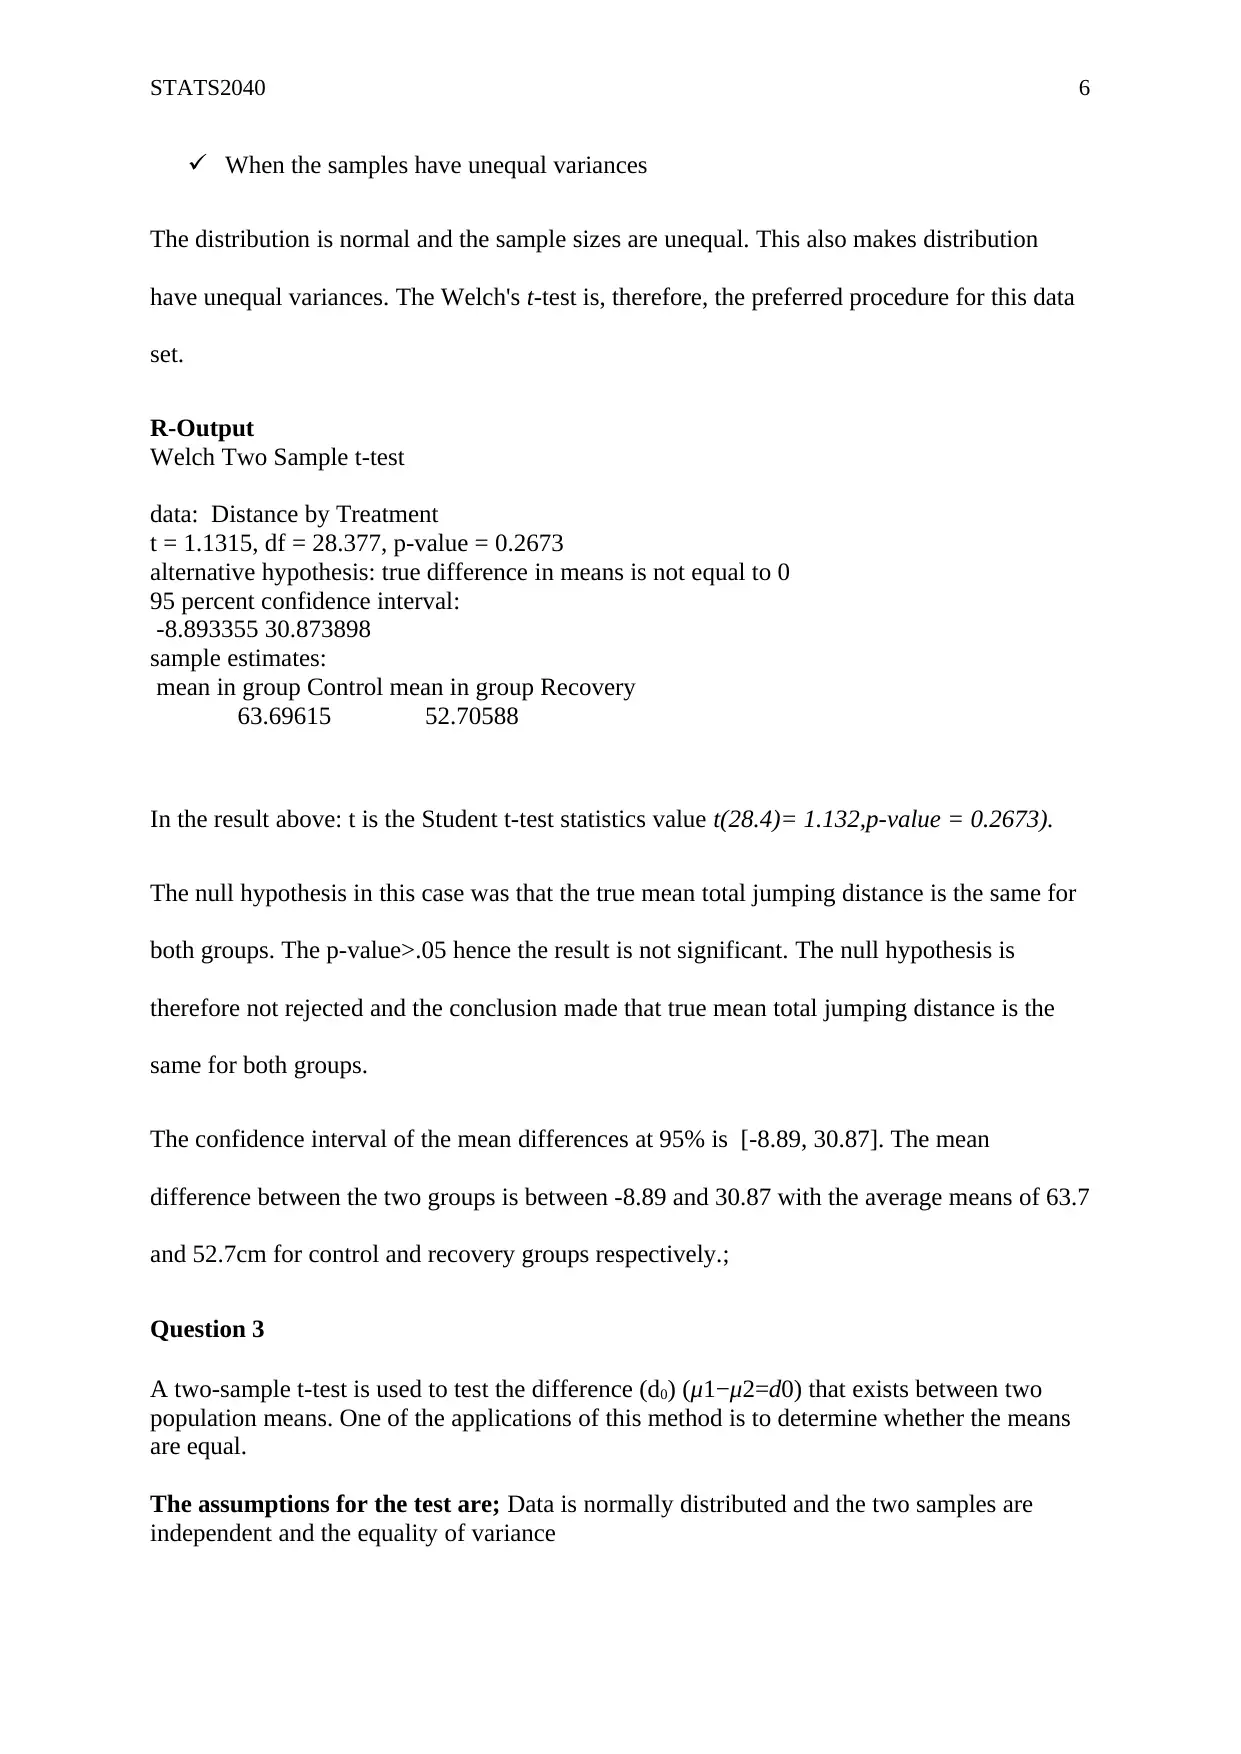
This document presents a comprehensive solution to a STATS 2040 data analysis assignment, covering various statistical concepts and methodologies. It begins with an analysis of a one-sample problem involving the birth weights of African elephants, utilizing boxplots, Q-Q plots, and a one-sample t-test to assess normality and determine confidence intervals. The assignment then delves into two-sample problems, including an analysis of jumping characteristics of fish, employing Welch's t-test and hypothesis testing to compare means. Furthermore, it explores the application of a two-sample t-test to analyze wordiness in responses from liars and truth-tellers. Finally, the assignment extends to interpreting results from published journal articles, extracting key findings related to gestation periods of elephants, lactate accumulation in fish, and the prevalence of Salmonella in raccoons. The document offers detailed explanations of statistical tests, interpretations of results, and conclusions drawn from the analyses.

Running head: STATS 2040 1
Data Analysis Assignment
Student’s Name
Institutional Affiliation
Data Analysis Assignment
Student’s Name
Institutional Affiliation
Paraphrase This Document
Need a fresh take? Get an instant paraphrase of this document with our AI Paraphraser

STATS2040 2
Question 1
a.
The boxplot is a standardized way to allow one to display the data distribution that is based
on a five-number summary namely: minimum, first quartile, median, third quartile, and
maximum. Attached is the boxplot of the birth weight of 30 female African elephants
b.
The normal Q-Q plot is used to determine if a distribution is normally distributed and its
shape in general.

STATS2040 3
c.
The two plots reveal that the data is normally distributed. The points seem to lie about
the straight line fitted. The box plot is symmetric that suggests that the data follows a normal
distribution. Also, there exist no outliers since all the data plots lie within the box and
whiskers plot. The normality assumption is therefore satisfied.
d.
Below is the analysis of one sample-t-test on the weight data. The results reveal that the birth
weight of elephants lies between 89.98to 100.2 kilograms at a 95% confidence level.
One Sample t-test
data: data$weight
t = 38.054, df = 29, p-value < 2.2e-16
alternative hypothesis: true mean is not equal to 0
95 percent confidence interval:
89.97625 100.19709
sample estimates:
mean of x
95.08667
e.
The female African elephants, therefore, have an average birth weight of 95.09 kilograms. As
seen above, the birth weight of elephants lies between 89.98to 100.2 kilograms at a 95%
confidence level. This implies that if this sample was picked randomly from a population of
African female elephants born in captivity, every elephant is likely to be born weighing about
95.09 kilograms. The least likely weight and the maximum likely weight to be registered is
89.98 and 100.2 kilograms respectively.
f.
A hypothesis is defined as an educated guess and categorized into the null and alternative
hypotheses. The null hypothesis assumes no difference while the alternative carries the
researchers’ question.
⊘ This is a preview!⊘
Do you want full access?
Subscribe today to unlock all pages.

Trusted by 1+ million students worldwide

STATS2040 4
In this case,
Null hypothesis (Ho): There is no significant difference in birth weights of African elephants
born in captivity.
Alternative hypothesis (Ha): There is a significant difference in the birth weights of African
elephants born in captivity.
The one-sample t-test revealed that the weights have a t(29)=38.054,p-value=2.2e-
16<.05.The resultant p-value is less than the alpha=.05 value. The result, therefore, is
statistically significant. There is enough evidence to reject the null hypothesis. Therefore, it
can be concluded that the birth weights of African elephants born in captivity are
significantly different from one another.
g
This is a non-probabilistic method of data collection. Most of the data used was from
secondary sources. Since randomness was not considered in the design, the results could be
prone to bias. The use of stillbirths data also could result in incorrect results since some could
have been under age hence leading to incorrect conclusions. The sample size, however, is
sufficient.
Question 2
Below is the boxplot of the jumping characteristics of fish kept in water and them that had
spent days out of the water and recovered. The control category has an outlier with a distance
of 128cm which beyond the normal range of the category.
Paraphrase This Document
Need a fresh take? Get an instant paraphrase of this document with our AI Paraphraser

STATS2040 5
The two normal Q-Q plots for the treatment (control and recovery are as follows);
The
student's t-
test assumes
that the two
populations
have normal distributions and the equality of variances. The Q-Q plots above are not far from
the line of best fit which shows normality. Also, when a histogram is fitted for the distance
variable, it follows a fair bell shape which proves that the data is fairly normal. The Welch's
t-test is designed for unequal variances though the assumption of normality is maintained.
The Welch's t-test is popularly used when;
The distribution is assumed normal
Sample sizes are unequal

STATS2040 6
When the samples have unequal variances
The distribution is normal and the sample sizes are unequal. This also makes distribution
have unequal variances. The Welch's t-test is, therefore, the preferred procedure for this data
set.
R-Output
Welch Two Sample t-test
data: Distance by Treatment
t = 1.1315, df = 28.377, p-value = 0.2673
alternative hypothesis: true difference in means is not equal to 0
95 percent confidence interval:
-8.893355 30.873898
sample estimates:
mean in group Control mean in group Recovery
63.69615 52.70588
In the result above: t is the Student t-test statistics value t(28.4)= 1.132,p-value = 0.2673).
The null hypothesis in this case was that the true mean total jumping distance is the same for
both groups. The p-value>.05 hence the result is not significant. The null hypothesis is
therefore not rejected and the conclusion made that true mean total jumping distance is the
same for both groups.
The confidence interval of the mean differences at 95% is [-8.89, 30.87]. The mean
difference between the two groups is between -8.89 and 30.87 with the average means of 63.7
and 52.7cm for control and recovery groups respectively.;
Question 3
A two-sample t-test is used to test the difference (d0) (μ1−μ2=d0) that exists between two
population means. One of the applications of this method is to determine whether the means
are equal.
The assumptions for the test are; Data is normally distributed and the two samples are
independent and the equality of variance
⊘ This is a preview!⊘
Do you want full access?
Subscribe today to unlock all pages.

Trusted by 1+ million students worldwide

STATS2040 7
Hypothesis testing: The hypothesis of two-sample t-test for unpaired data is defined as:
H0: μ1=μ2
Ha: μ1>μ2
Test Statistics; The formula is therefore T=
X 1−X 2
Sp √ 1
N 1 + 1
N 2
where S2p=
( N 1−1 ) S 12 + ( N 2−1 ) S 22
N 1+ N 2−2 where N1 and N2 are sample sizes which are 47 and 44
respectively, X 1 and X 2 are the sample mean,which are 1.52 and 1.3 respectively. The S 12
and S 22 are sample variances which are 0.32 and 0.39.
Therefore t=
1.52−1.3
Sp √( 1
47 + 1
41 )( ( 47−1 ) 0.322 + ( 44−1 ) 0.392
47+ 44−2 ) =2.95
Rejection region: At alpha=0.05 and 89 degrees of freedom, the critical values for the right
tailed test is tc= t0.05,89=1.662
Rejection region R= {t: t>1.662}
Decision: Since the computed t=2.95 >t tabulated 1.662, the null hypothesis is thus rejected.
Also using the P-value,the p-value is p=0.002.Since p = 0.002<0.05,it is concluded that the
null hypothesis is rejected.
Confidence interval: Formula is ¿ ¿ At 95% confidence interval is
0.072< u1 – u2 < 0.368
Conclusion: The hypothesis that the researchers suspected that liars would tend to have
wordier responses than truth-tellers is therefore true.
Question 4
a.
This is the interval difference for the gestation days of Asian male elephants. For an Asian
male Elephant to be born it takes 660.6 days or 5.8 days less or more days after this period.
b.
Null hypothesis (Ho): There is no significant difference in the lactate accumulation between
the two groups.
It was realized that significantly less lactate was produced by air-exposed fish relative to
control fish (1.87±0.31 versus 3.11±0.56 mmol l−1; P=0.041) after 10 jumps. The null
hypothesis is rejected.
Paraphrase This Document
Need a fresh take? Get an instant paraphrase of this document with our AI Paraphraser

STATS2040 8
c.
.In this category, between 17.0% and 28.2% of females were found to have with Salmonella
in faeces and on paws in Ontario.
d.
There is no significant difference in the occurrence of Salmonella in raccoons with respect to
their location (conservation and swine farm),p>.05.
References
Bondo et al. (2016). Epidemiology of Salmonella on the paws and in the faeces of free-
ranging raccoons (Procyon Lotor) in Southern Ontario, Canada. Zoonoses and Public
Health, 63:303–310.
Brunt et al. (2016). Amphibious fish jump better on land after acclimation to a terrestrial
environment.Journal of Experimental Biology, 219:3204–3207.
Dale, R. (2010). Birth statistics for African (Loxodonta africana) and Asian (Elephas
maximus) elephants in human care: History and implications for elephant welfare.
Zoo Biology, 29:87–103.
Walczyk et al. (2013). Eye movements and other cognitive cues to rehearsed and unrehearsed
deception when interrogated about a mock crime. Applied Psychology in Criminal
Justice, 29(1):1–22
1 out of 8
Related Documents

Your All-in-One AI-Powered Toolkit for Academic Success.
+13062052269
info@desklib.com
Available 24*7 on WhatsApp / Email
Unlock your academic potential
Copyright © 2020–2025 A2Z Services. All Rights Reserved. Developed and managed by ZUCOL.