Statistics for Managerial Decisions: Assessment 2 - Analysis & Report

Verified

Added on  2022/11/13

|12
|659
|468
Homework Assignment
AI Summary
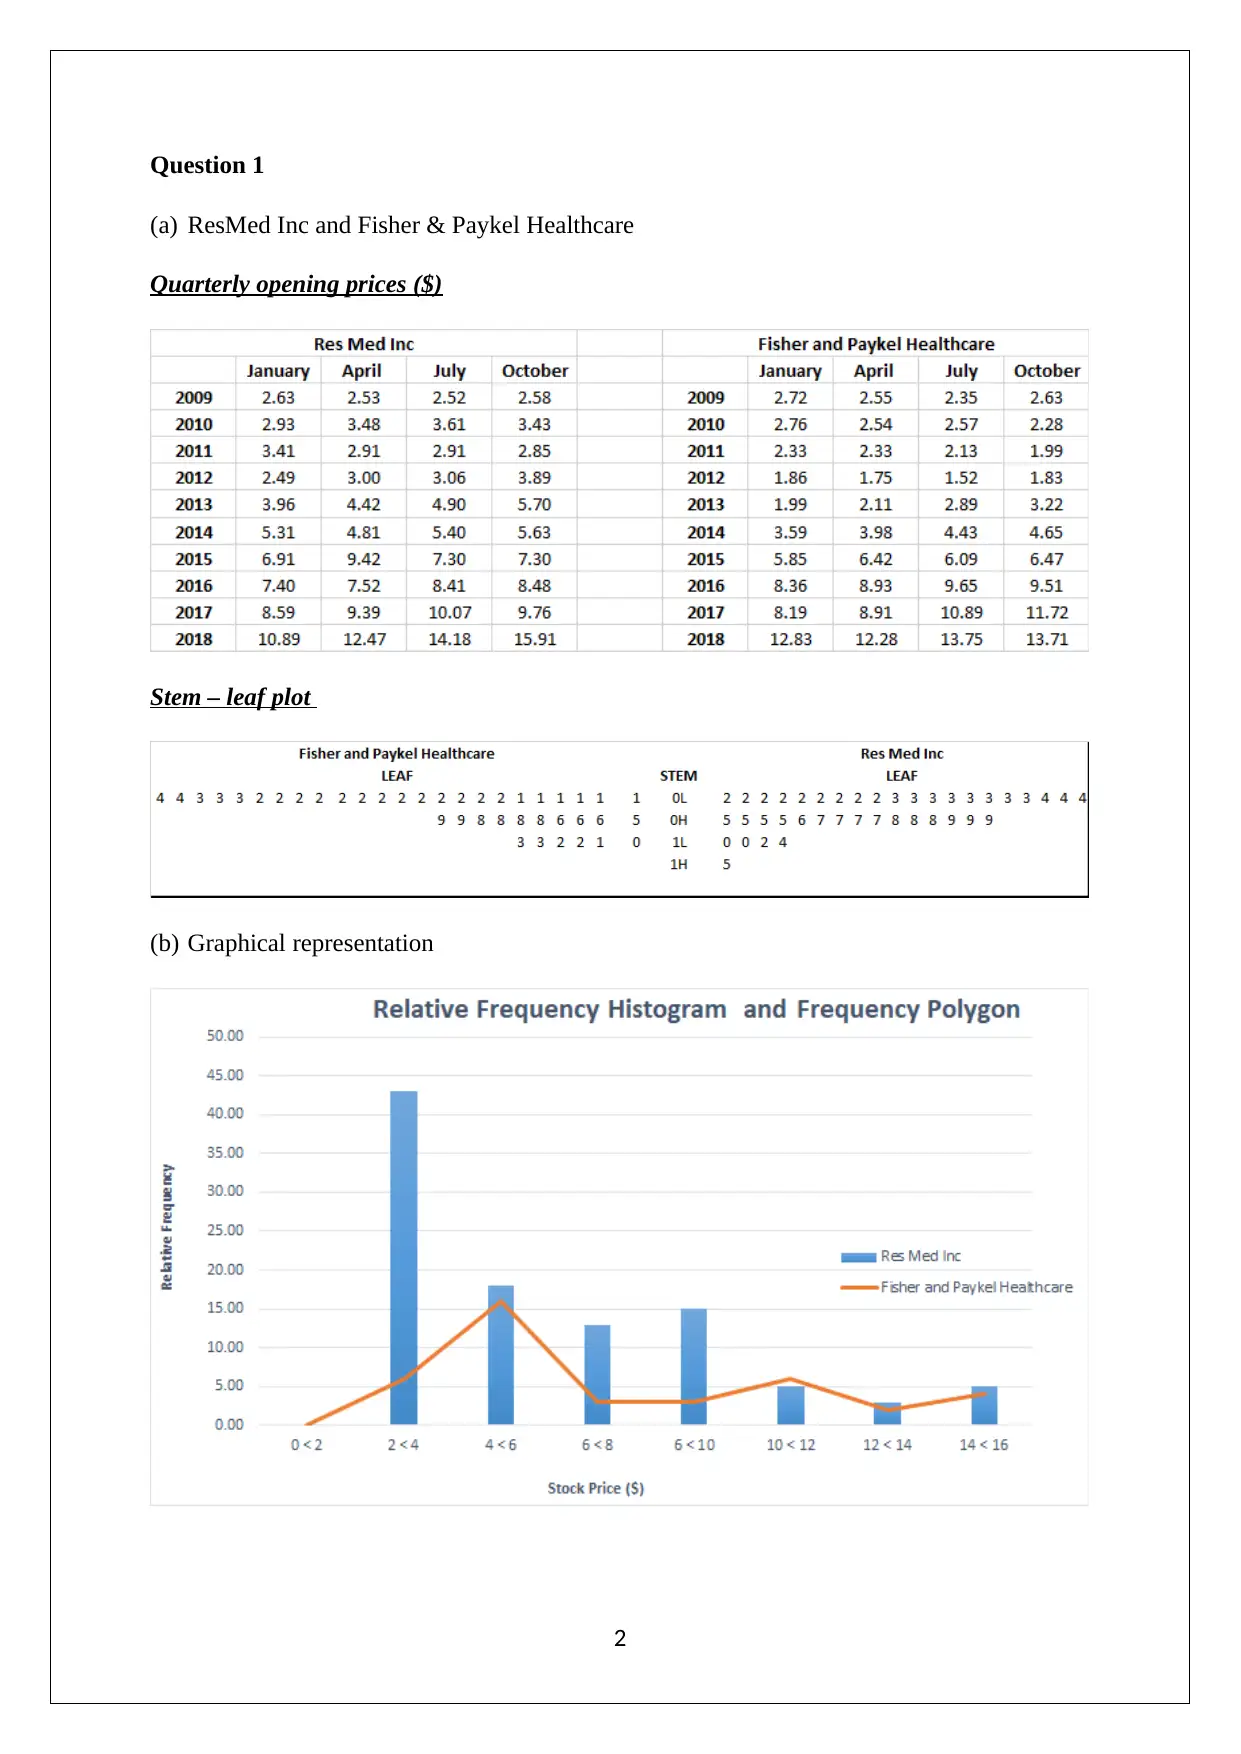
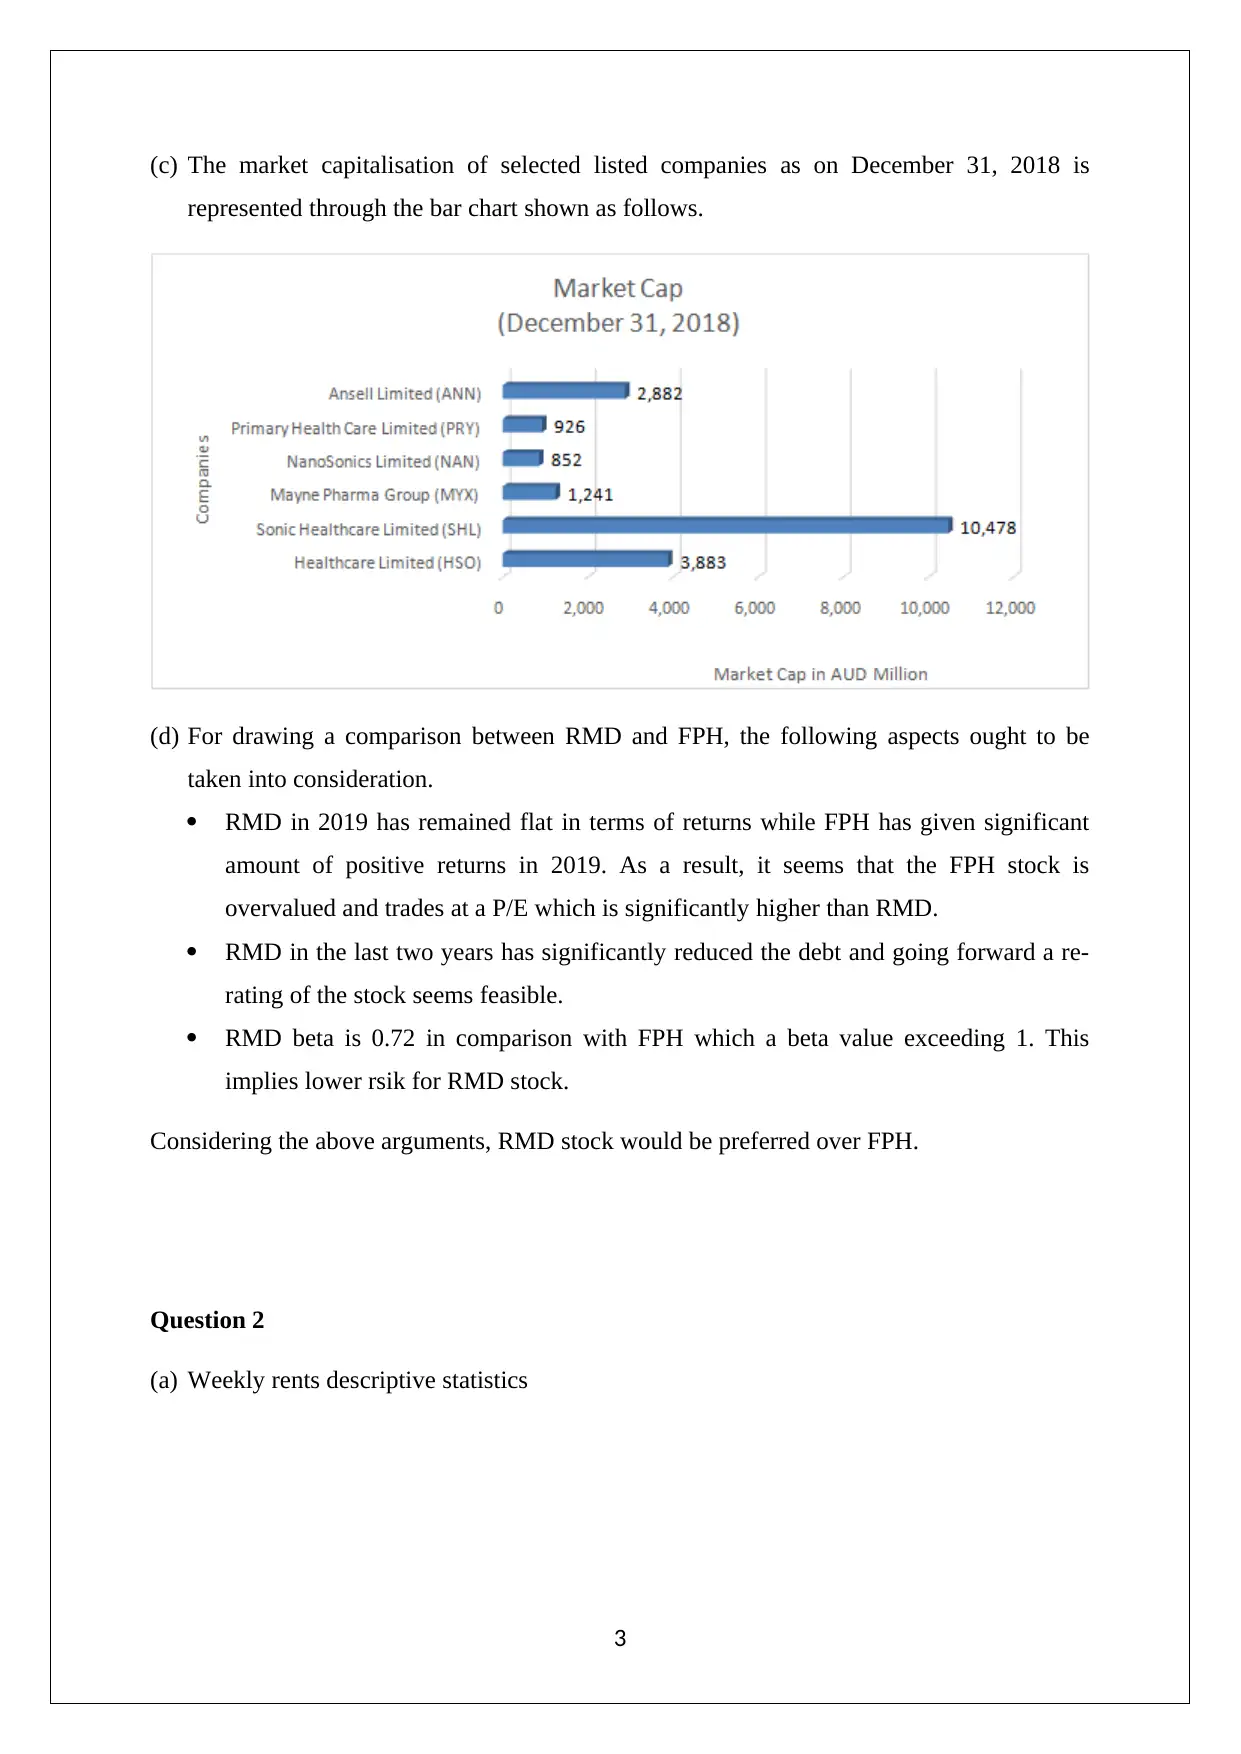
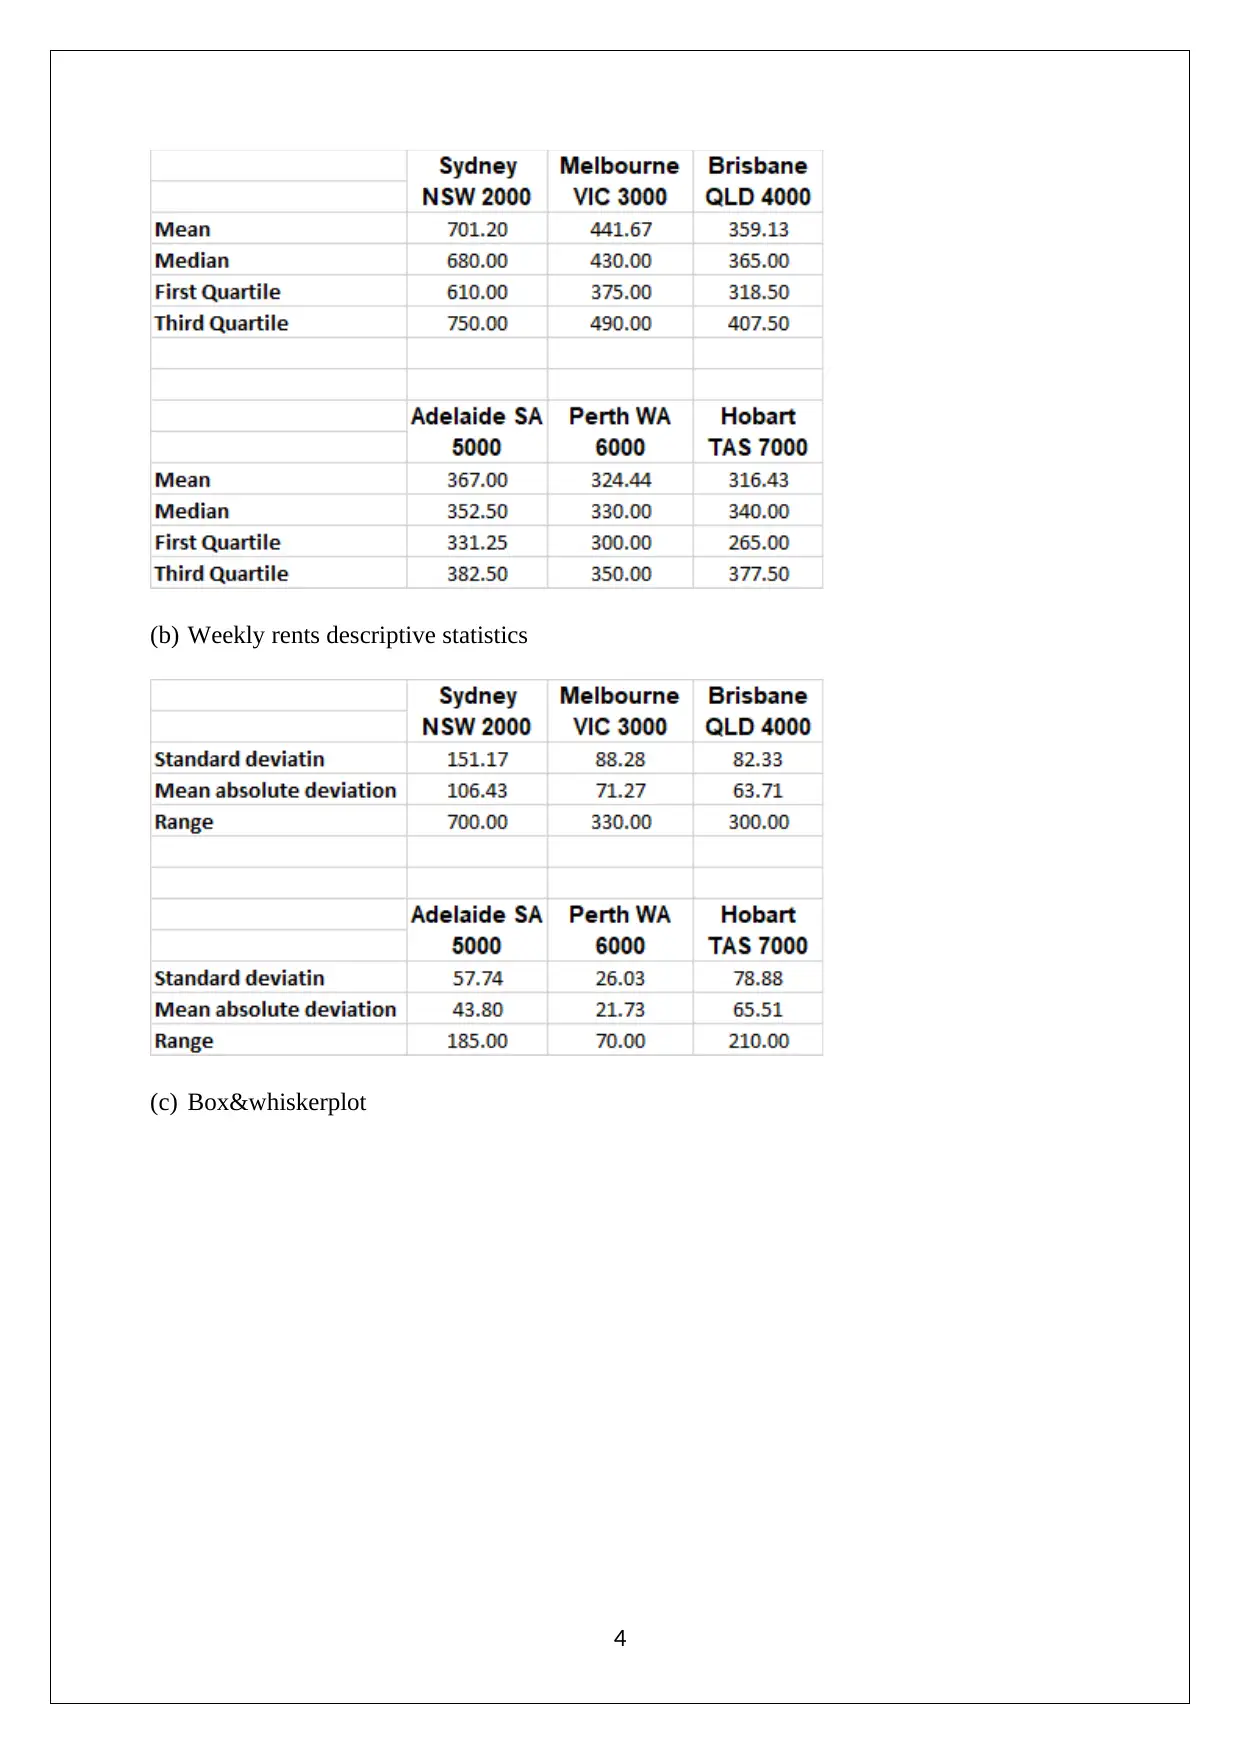
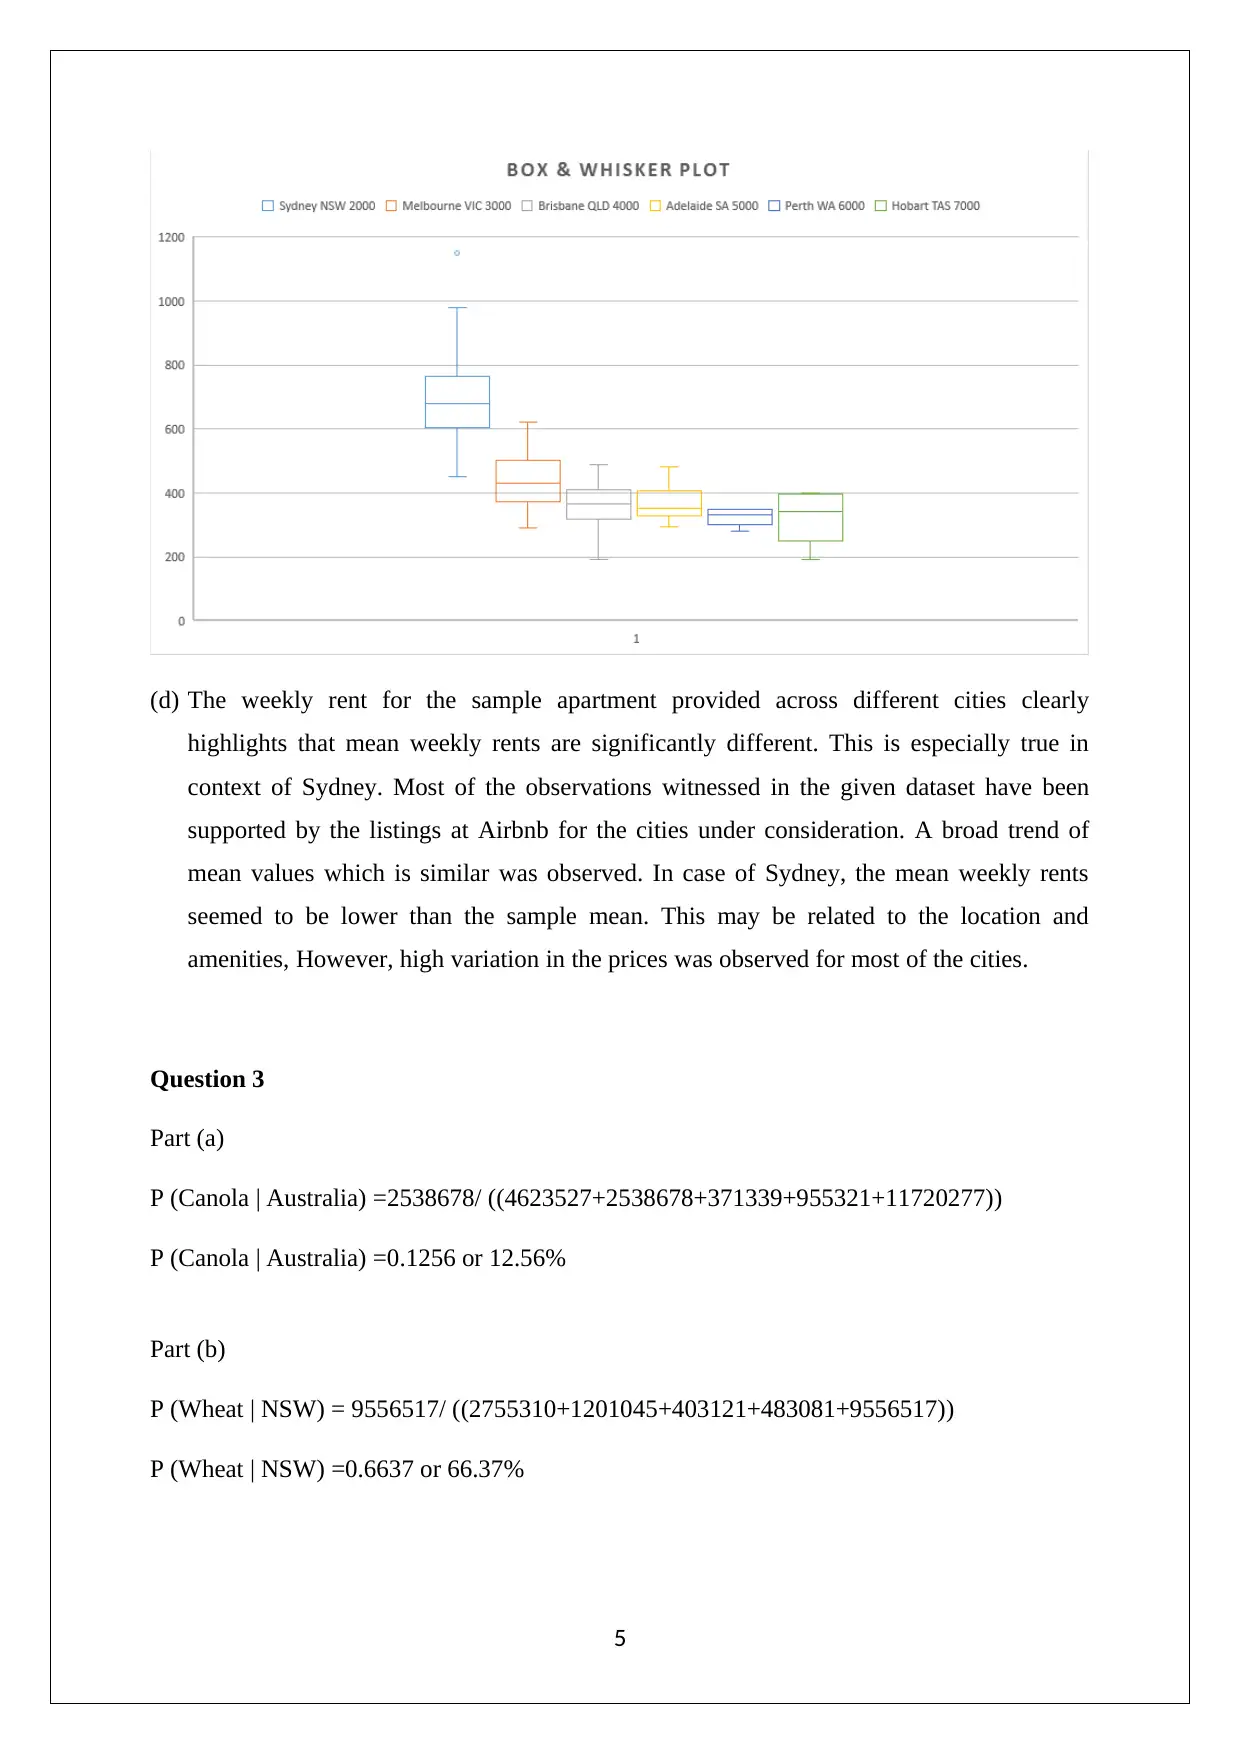
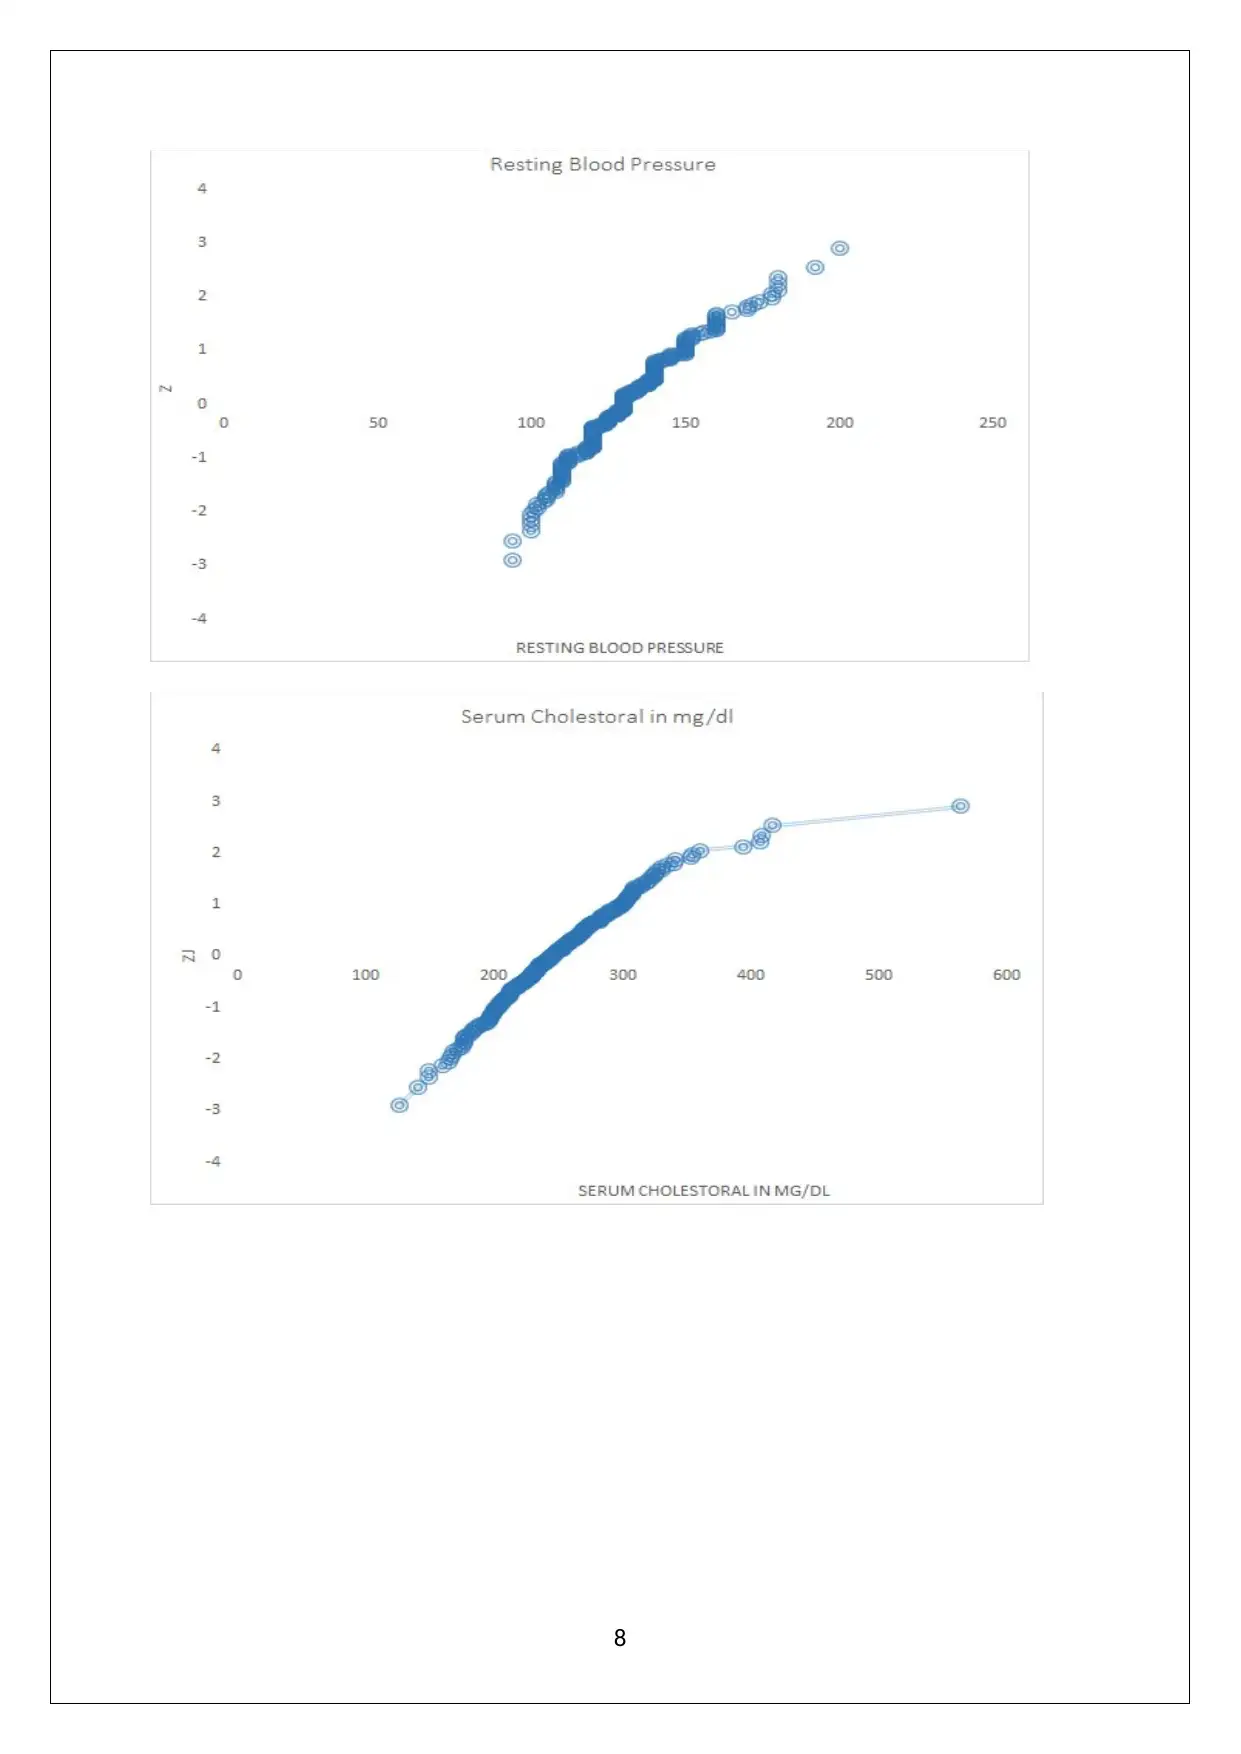
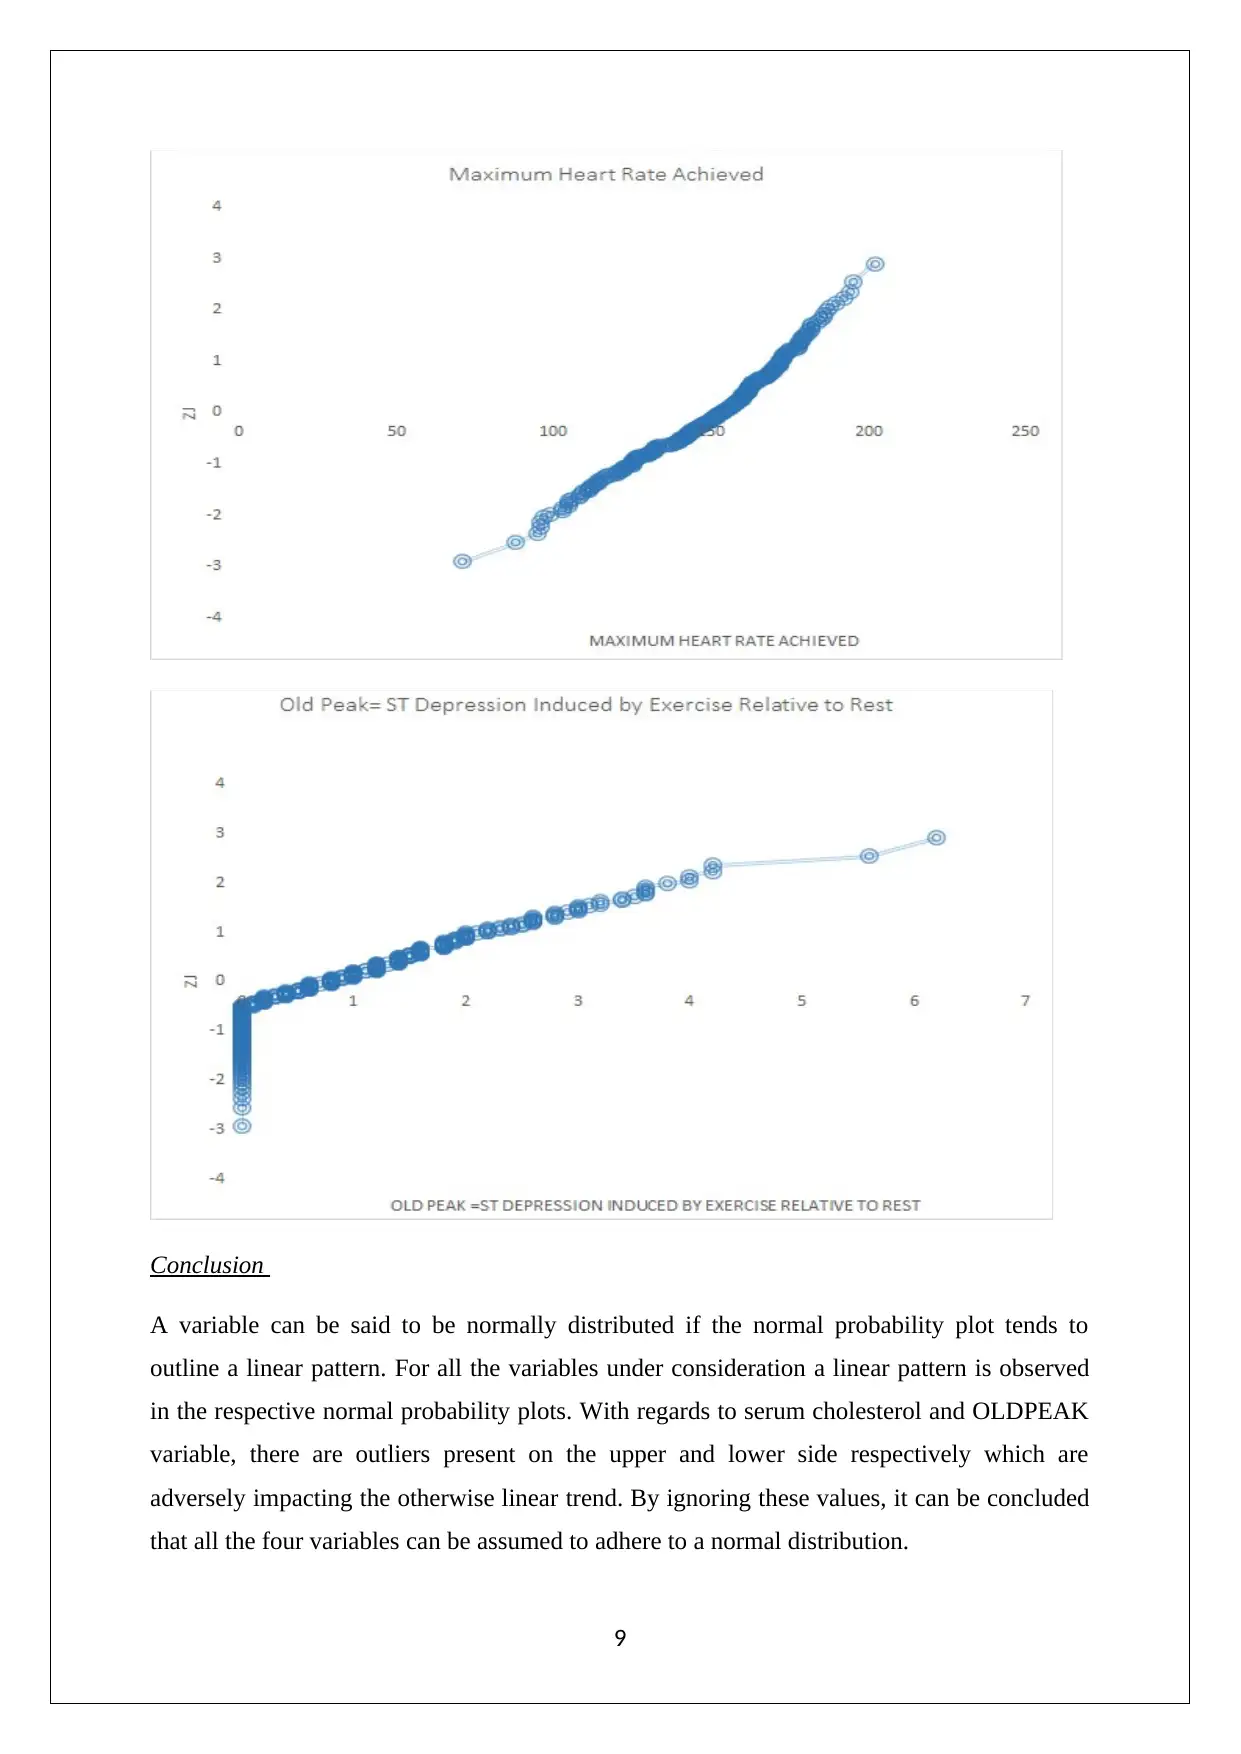
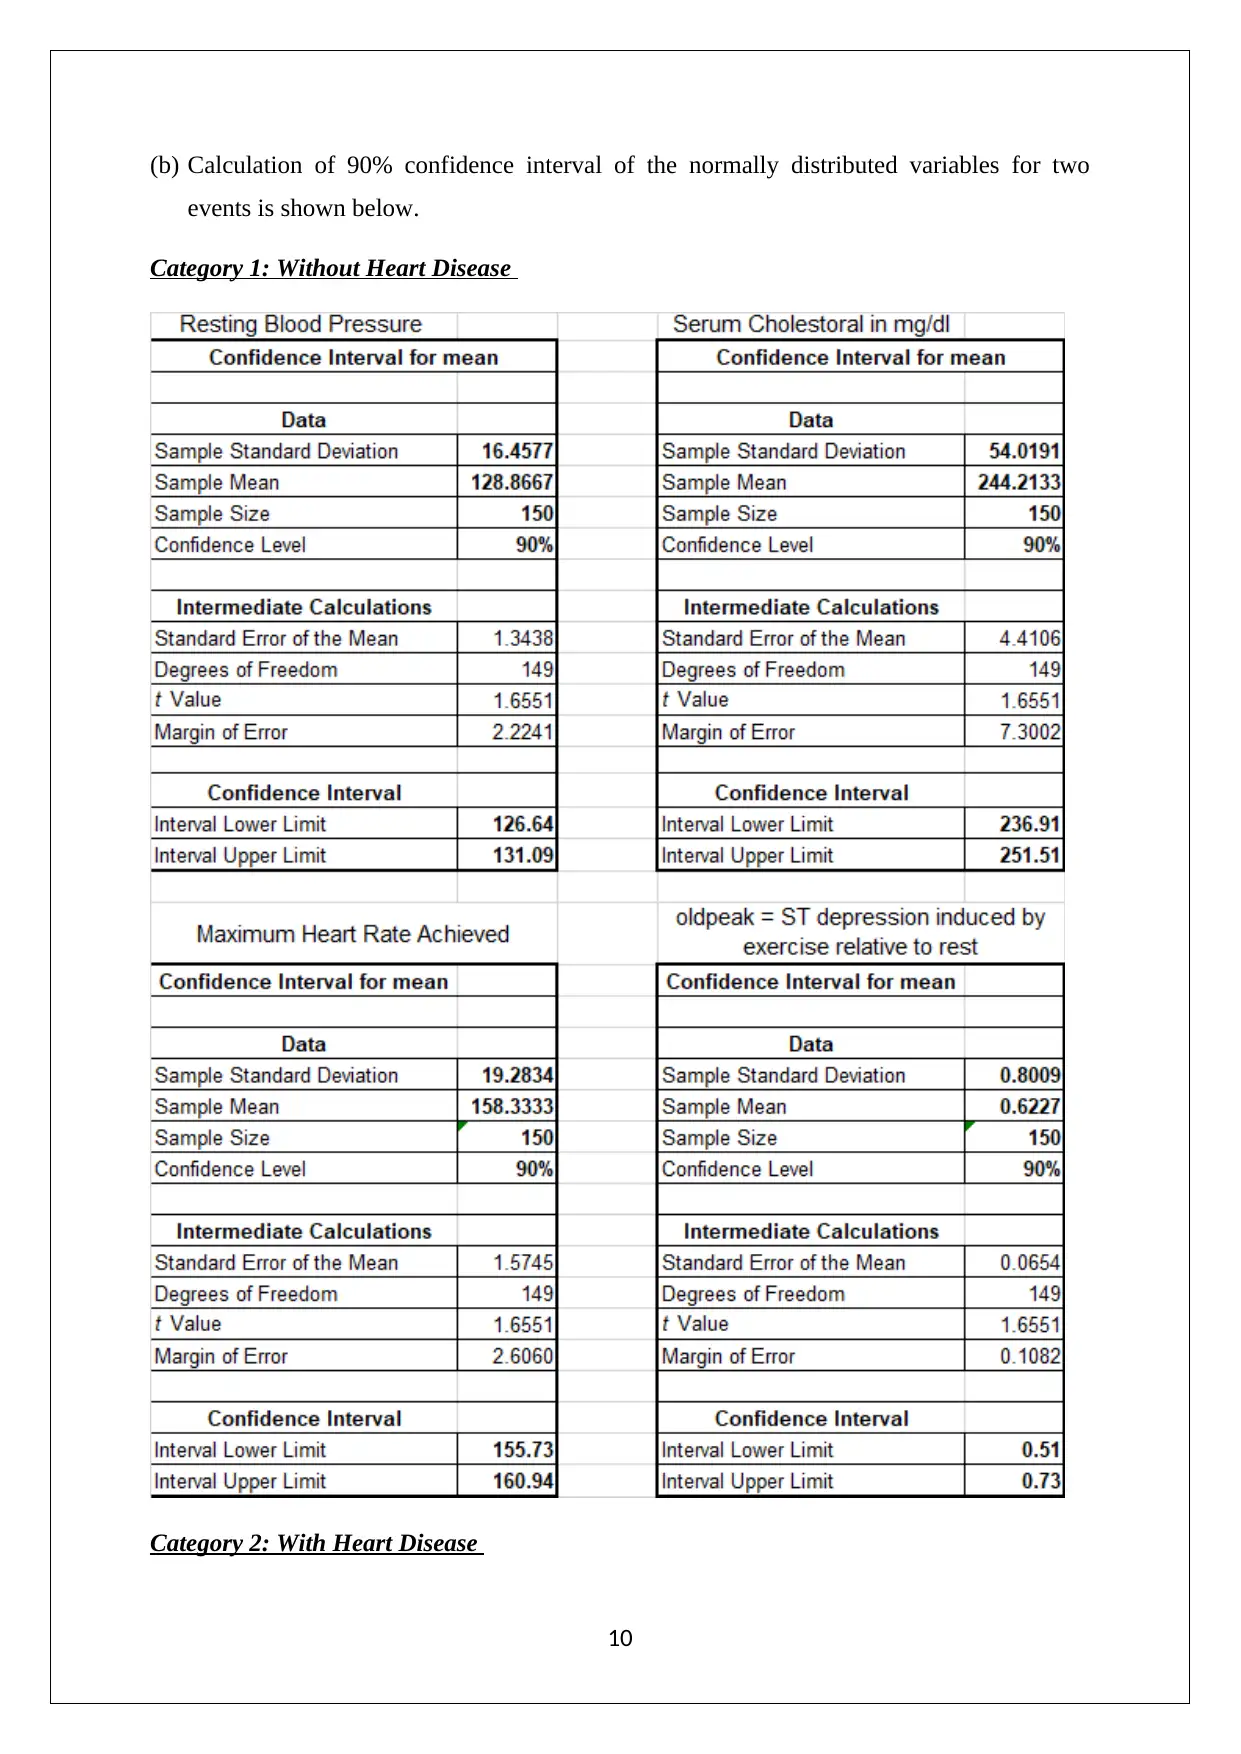
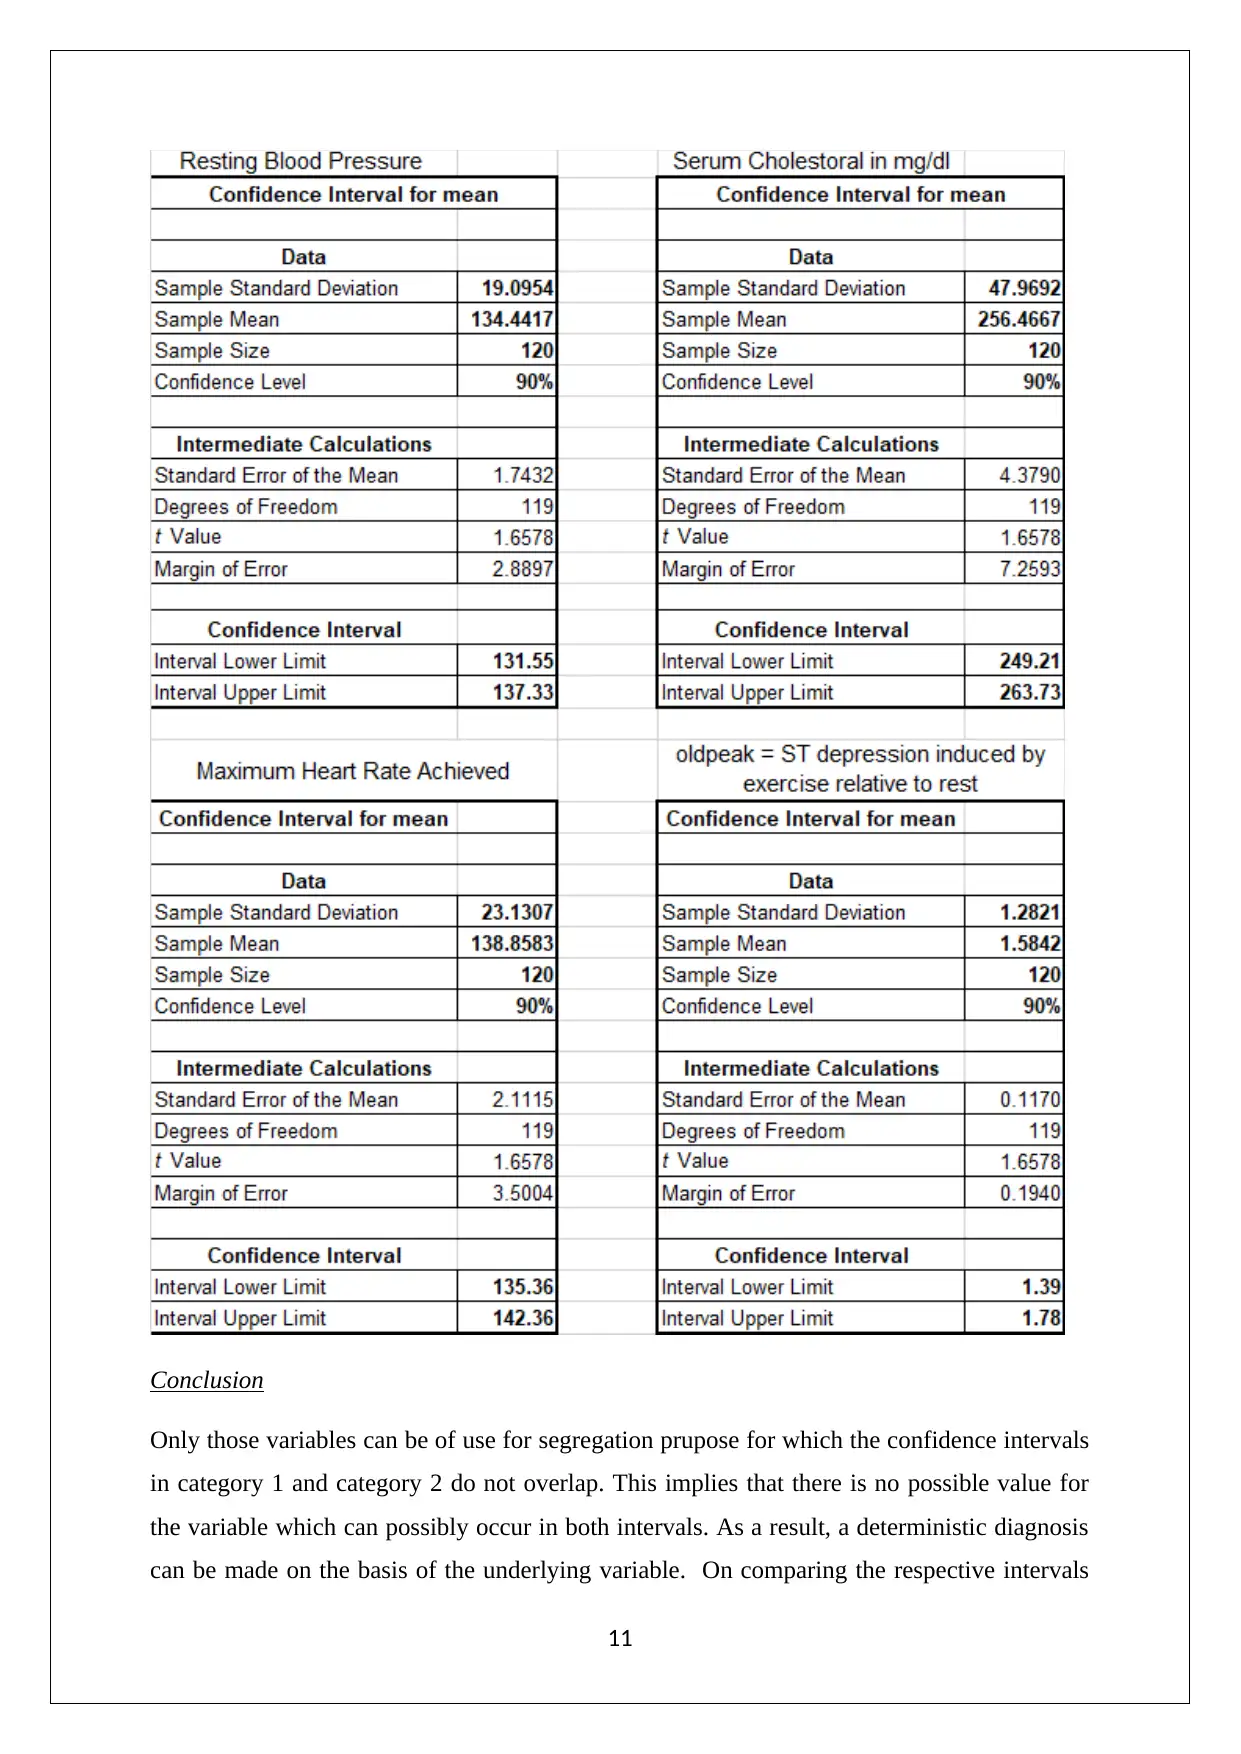
This document presents a comprehensive solution to a Statistics for Managerial Decisions assignment, addressing various statistical concepts and their applications. The assignment includes the analysis of financial data for companies like ResMed Inc. and Fisher & Paykel Healthcare, employing stem-and-leaf plots and bar charts to compare market capitalizations and returns. It also involves descriptive statistics for weekly rents across different cities, using box-and-whisker plots to visualize the data. Further, the solution covers probability calculations, including rainfall analysis, and normality tests using probability plots. It also demonstrates the calculation of confidence intervals for variables related to heart disease, aiding in making diagnostic decisions. The solution incorporates Excel-based analysis, formulas, and detailed explanations to provide a complete understanding of the statistical methodologies applied.
Document Page
STATISTICS FOR MANAGERIAL DECISIONS
STUDENT ID:
[Pick the date]
tabler-icon-diamond-filled.svg

Paraphrase This Document

Need a fresh take? Get an instant paraphrase of this document with our AI Paraphraser
Document Page
Question 1
(a) ResMed Inc and Fisher & Paykel Healthcare
Quarterly opening prices ($)
Stem – leaf plot
(b) Graphical representation
2
Document Page
(c) The market capitalisation of selected listed companies as on December 31, 2018 is
represented through the bar chart shown as follows.
(d) For drawing a comparison between RMD and FPH, the following aspects ought to be
taken into consideration.
RMD in 2019 has remained flat in terms of returns while FPH has given significant
amount of positive returns in 2019. As a result, it seems that the FPH stock is
overvalued and trades at a P/E which is significantly higher than RMD.
RMD in the last two years has significantly reduced the debt and going forward a re-
rating of the stock seems feasible.
RMD beta is 0.72 in comparison with FPH which a beta value exceeding 1. This
implies lower rsik for RMD stock.
Considering the above arguments, RMD stock would be preferred over FPH.
Question 2
(a) Weekly rents descriptive statistics
3
Document Page
(b) Weekly rents descriptive statistics
(c) Box&whiskerplot
4
tabler-icon-diamond-filled.svg

Paraphrase This Document

Need a fresh take? Get an instant paraphrase of this document with our AI Paraphraser
Document Page
(d) The weekly rent for the sample apartment provided across different cities clearly
highlights that mean weekly rents are significantly different. This is especially true in
context of Sydney. Most of the observations witnessed in the given dataset have been
supported by the listings at Airbnb for the cities under consideration. A broad trend of
mean values which is similar was observed. In case of Sydney, the mean weekly rents
seemed to be lower than the sample mean. This may be related to the location and
amenities, However, high variation in the prices was observed for most of the cities.
Question 3
Part (a)
P (Canola | Australia) =2538678/ ((4623527+2538678+371339+955321+11720277))
P (Canola | Australia) =0.1256 or 12.56%
Part (b)
P (Wheat | NSW) = 9556517/ ((2755310+1201045+403121+483081+9556517))
P (Wheat | NSW) =0.6637 or 66.37%
5
Document Page
Part (c)
Part (d)
In the given data, the unreliable estimate relates to South Australia production and area
figures related to grain sorghum. These are not relaible owing to high amount (>50%) relative
standard error which is present for these estimates.
Question 4
(a)
(i) Probability (NoRainfall in Week)
(ii) Probability of3 ormore days of rainfall
6
Document Page
(a) Mean and standard deviation of the weekly rainfall events of 52 weeks.
(i) Probabilitythat for a week the rainfallwill be between X1= 10 and X2=50 mm
(ii) Rainfall amount is X mm
Z value for 0.12 probability from standard normal table = -1.17499
(-1.17499) = (X- 83.75) / (21.18)
X = required amount for rainfall = 58.86 mmm
Question 5
(a) Normality Test
Normal Probability Plot
7
tabler-icon-diamond-filled.svg

Paraphrase This Document

Need a fresh take? Get an instant paraphrase of this document with our AI Paraphraser
Document Page
8
Document Page
Conclusion
A variable can be said to be normally distributed if the normal probability plot tends to
outline a linear pattern. For all the variables under consideration a linear pattern is observed
in the respective normal probability plots. With regards to serum cholesterol and OLDPEAK
variable, there are outliers present on the upper and lower side respectively which are
adversely impacting the otherwise linear trend. By ignoring these values, it can be concluded
that all the four variables can be assumed to adhere to a normal distribution.
9
Document Page
(b) Calculation of 90% confidence interval of the normally distributed variables for two
events is shown below.
Category 1: Without Heart Disease
Category 2: With Heart Disease
10
tabler-icon-diamond-filled.svg

Paraphrase This Document

Need a fresh take? Get an instant paraphrase of this document with our AI Paraphraser
Document Page
Conclusion
Only those variables can be of use for segregation prupose for which the confidence intervals
in category 1 and category 2 do not overlap. This implies that there is no possible value for
the variable which can possibly occur in both intervals. As a result, a deterministic diagnosis
can be made on the basis of the underlying variable. On comparing the respective intervals
11
Document Page
for each category, three variables are of use namely OLDPEAK, maximum heart rate
achieved and resing blood pressure.
12
chevron_up_icon
1 out of 12
circle_padding
hide_on_mobile
zoom_out_icon
[object Object]