Statistical Analysis Homework: Hypothesis Testing and Regression

Verified

Added on  2023/05/28

|2
|571
|253
Homework Assignment
AI Summary
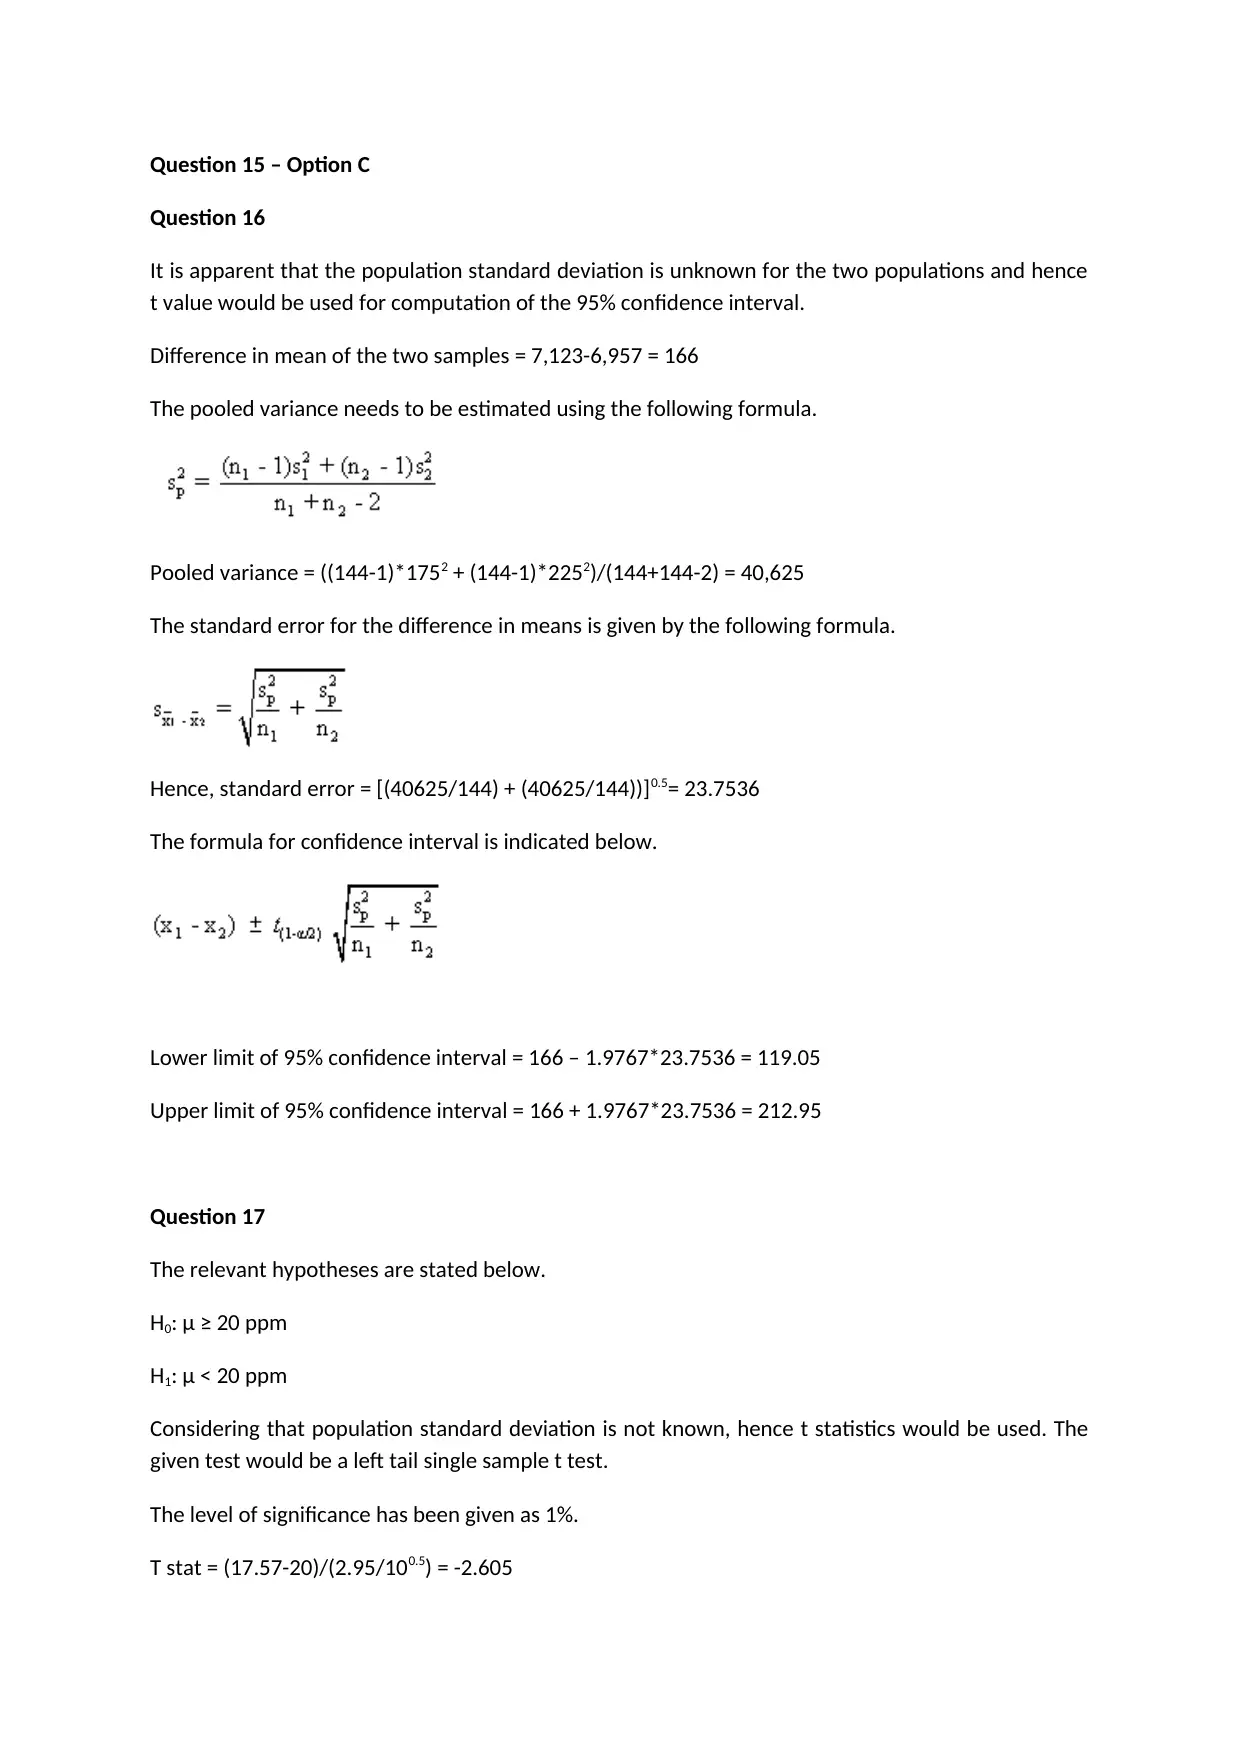
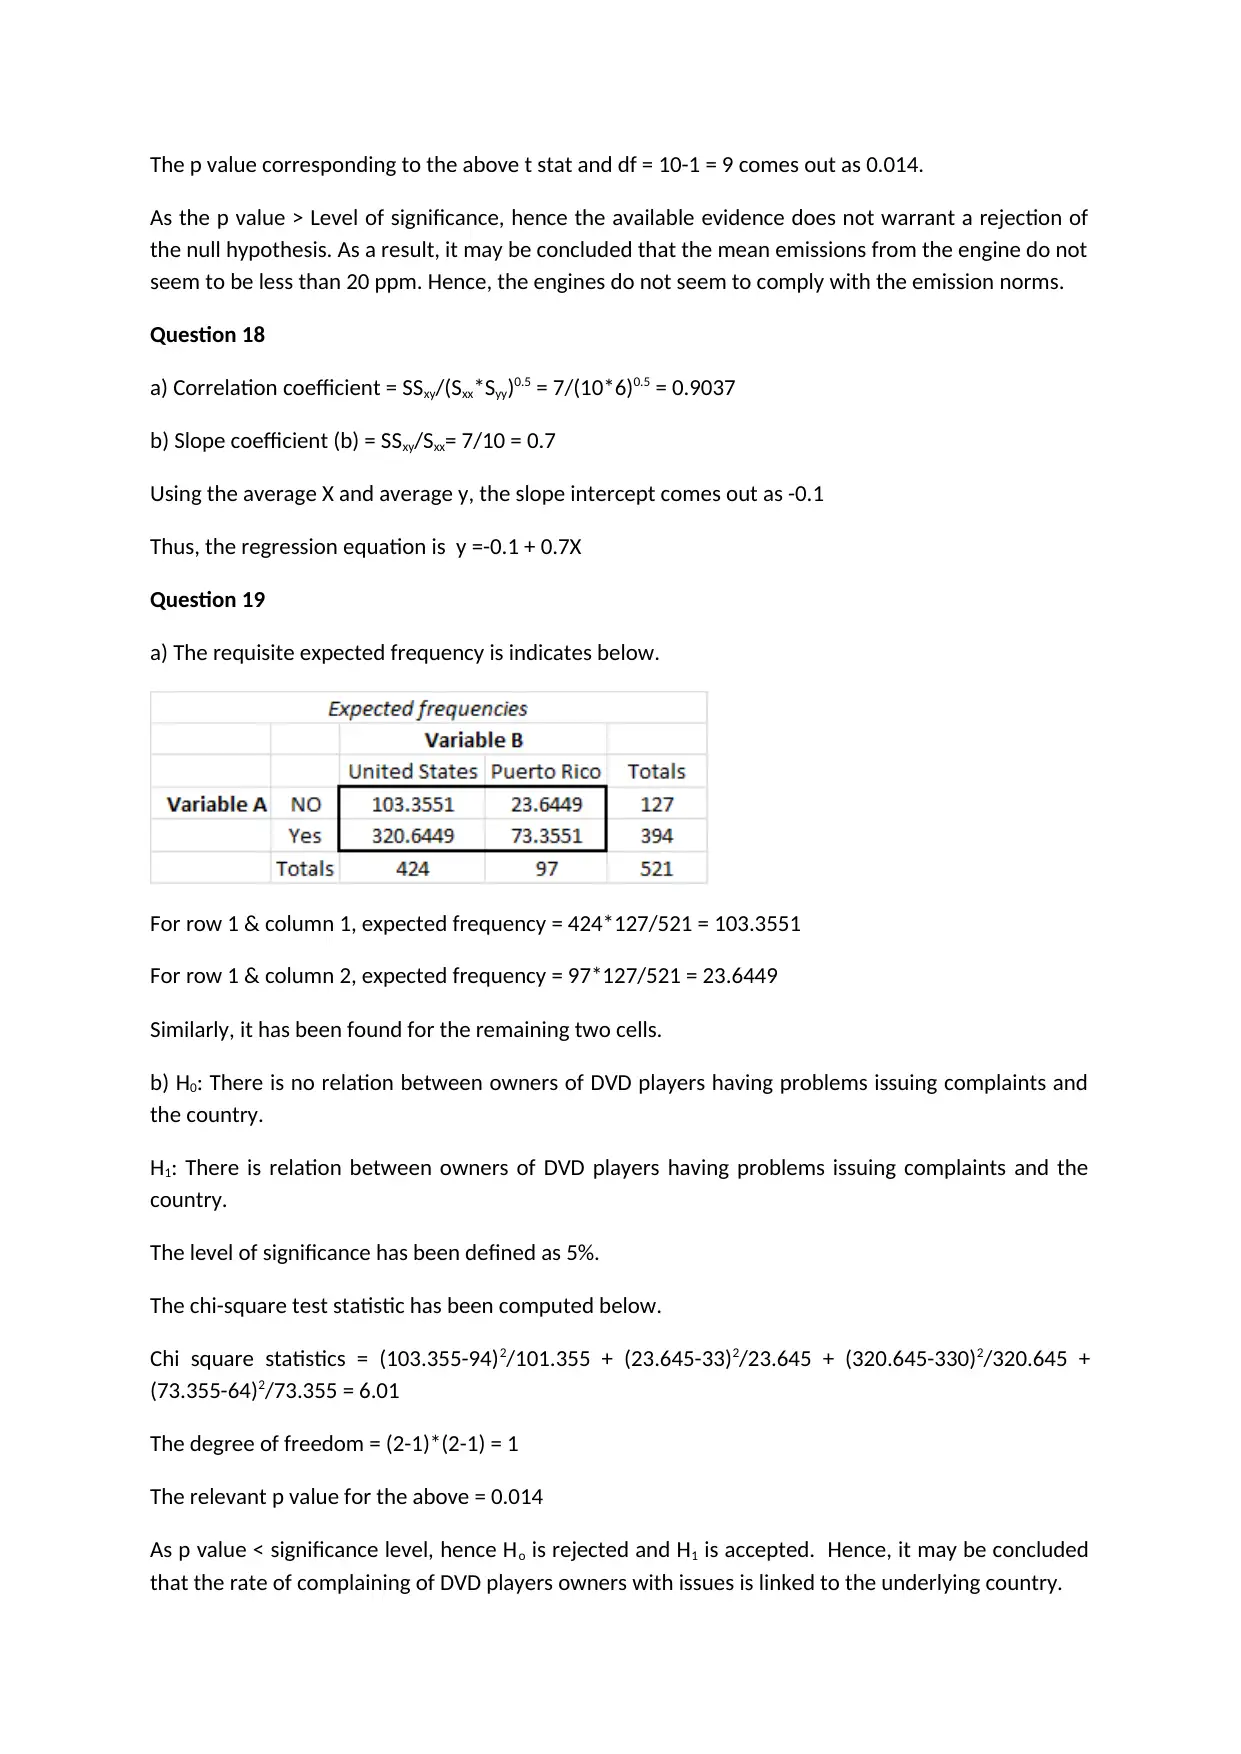
This assignment provides detailed solutions to several statistics problems. It includes the computation of a 95% confidence interval for the difference in means between two samples, using a t-value due to the unknown population standard deviation. A left-tailed single sample t-test is conducted to evaluate engine emissions against a standard, concluding whether the engine complies with emission norms based on the p-value and significance level. Furthermore, the assignment calculates the correlation and regression coefficients for a given dataset, deriving the regression equation. Finally, a chi-square test is performed to determine if there is a relationship between DVD player owners' complaints and their country of origin, with a conclusion drawn based on the calculated chi-square statistic and p-value, with all the solutions available on Desklib, a platform providing solved assignments and study tools for students.
Document Page
Question 15 – Option C
Question 16
It is apparent that the population standard deviation is unknown for the two populations and hence
t value would be used for computation of the 95% confidence interval.
Difference in mean of the two samples = 7,123-6,957 = 166
The pooled variance needs to be estimated using the following formula.
Pooled variance = ((144-1)*1752 + (144-1)*2252)/(144+144-2) = 40,625
The standard error for the difference in means is given by the following formula.
Hence, standard error = [(40625/144) + (40625/144))]0.5= 23.7536
The formula for confidence interval is indicated below.
Lower limit of 95% confidence interval = 166 – 1.9767*23.7536 = 119.05
Upper limit of 95% confidence interval = 166 + 1.9767*23.7536 = 212.95
Question 17
The relevant hypotheses are stated below.
H0: μ ≥ 20 ppm
H1: μ < 20 ppm
Considering that population standard deviation is not known, hence t statistics would be used. The
given test would be a left tail single sample t test.
The level of significance has been given as 1%.
T stat = (17.57-20)/(2.95/100.5) = -2.605
tabler-icon-diamond-filled.svg

Paraphrase This Document

Need a fresh take? Get an instant paraphrase of this document with our AI Paraphraser
Document Page
The p value corresponding to the above t stat and df = 10-1 = 9 comes out as 0.014.
As the p value > Level of significance, hence the available evidence does not warrant a rejection of
the null hypothesis. As a result, it may be concluded that the mean emissions from the engine do not
seem to be less than 20 ppm. Hence, the engines do not seem to comply with the emission norms.
Question 18
a) Correlation coefficient = SSxy/(Sxx*Syy)0.5 = 7/(10*6)0.5 = 0.9037
b) Slope coefficient (b) = SSxy/Sxx= 7/10 = 0.7
Using the average X and average y, the slope intercept comes out as -0.1
Thus, the regression equation is y =-0.1 + 0.7X
Question 19
a) The requisite expected frequency is indicates below.
For row 1 & column 1, expected frequency = 424*127/521 = 103.3551
For row 1 & column 2, expected frequency = 97*127/521 = 23.6449
Similarly, it has been found for the remaining two cells.
b) H0: There is no relation between owners of DVD players having problems issuing complaints and
the country.
H1: There is relation between owners of DVD players having problems issuing complaints and the
country.
The level of significance has been defined as 5%.
The chi-square test statistic has been computed below.
Chi square statistics = (103.355-94)2/101.355 + (23.645-33)2/23.645 + (320.645-330)2/320.645 +
(73.355-64)2/73.355 = 6.01
The degree of freedom = (2-1)*(2-1) = 1
The relevant p value for the above = 0.014
As p value < significance level, hence Ho is rejected and H1 is accepted. Hence, it may be concluded
that the rate of complaining of DVD players owners with issues is linked to the underlying country.
chevron_up_icon
1 out of 2
circle_padding
hide_on_mobile
zoom_out_icon
[object Object]