Griffith University Research Proposal: EDV Charging Infrastructure
VerifiedAdded on 2022/08/23
|7
|3400
|20
Project
AI Summary
This research proposal outlines a project focused on the stochastic expansion planning of electric-drive vehicle (EDV) charging infrastructure. The study aims to develop an optimization model to minimize the overall costs associated with charging stations while improving charging reliability. The methodology involves utilizing GPS vehicle trajectory data from tracking companies to analyze vehicle movement patterns. Aggregation techniques are employed to visualize and explore the data, informing the development of a criterion for charging station placement within the driving range of EDVs. An objective function is used to minimize costs, and the model incorporates constraints to ensure charging reliability. The research seeks to address the limitations of existing models by incorporating real-time vehicle trajectory data and stochastic processes to create a practical and effective charging infrastructure expansion plan. The proposal details the methods for data collection, analysis, and model development, including the use of an objective function and constraints to achieve optimal charging station placement.
Griffith School of Engineering and Built Environment
Research Methods for Engineers
Trimester 03, 2019
Final Assignment – Research Proposal
DECLARATION: I declare that this research proposal contains no material which has been submitted for assessment in any
other subject at Griffith University or elsewhere. To the best of my knowledge and belief, this research proposal contains no
material that has been previously published by any other person, except where due acknowledgement has been made.
Student name: Student number:
Program in which the student is enrolled:
Stochastic Expansion Planning of the Electric-Drive Vehicle Charging
Infrastructure Using GPS Vehicle Trajectory Data
PROJECT SUMMARY
The future of transportation is envisioned by the development of environmentally friendly energy sources. Electric
drive vehicles are being promoted as an alternative to the internal combustion engine based vehicles that have been
the source of the current climate crisis. The most attractive attributes of EDVs include their high transportation
efficiency, eco-friendliness and quiet operation. However, the adoption of this mode of transport has been slow due to
several reasons which include scarcity of charging stations and the difficult in planning for the optimal of these
stations. This paper aims to develop an optimization model that can be used to plan for the long-term expansion of
electric vehicle charging infrastructure based on the stochastic process. The model is based on minimizing the overall
costs associated with the charging stations and improving the charging reliability. The data used in this research is
acquired from a tracking company utilizing Global Positioning system tracking to map the trajectories, speeds, and
locations of large fleets of vehicles. Aggregation techniques are then employed to comprehensively explore and
visualize the movement data of the vehicles. Using this data, a criterion is developed that places a charging station
within the driving range of an electric-drive vehicle to achieve total charging reliability of the charging infrastructure.
For the minimization of the overall cost for the optimal placement of the charging stations, an objective function is
used.
KEYWORDS
Aggregation, charging infrastructure, trajectory,
1. INTRODUCTION
With the projected increase in the number of electric vehicles in an effort to lower greenhouse gas emissions from
conventional sources of energy, it is necessary to have adequate number of charging stations. Additionally, electric
drive vehicles have high transportation efficiency and their operation is quite. Li et al (2018) argue that limited
number of charging stations for electric vehicles is one of the major barriers to the successful large scale adoption of
the technology. According to Andriollo and Tortella (2015), adequate number of stations is not enough, in addition,
their placement should be done properly to avoid costly design. Consequently, it is necessary to properly design and
deploy electric vehicle charging infrastructure to ease the adoption process and to improve efficiency. The proper
placement of electric vehicle charging stations has therefore been an active research field for urban and intercity
infrastructure planning. The selection of the charging stations for electric vehicles has been regarded as a complex
multicriteria decision making problem. The refueling of vehicles based on internal combustion engines is
straightforward.
The driving range of electric drive vehicles is quite limited and is one of the major limitations for long distance
cruising. Several optimization models have been developed in an effort to break this limitation by the optimal
placement of charging infrastructure. Studies have investigated several different planning methods for charging
infrastructure optimization. Rahman et al. (2016) carried out a review focused on the algorithmic and computational
aspects of a variety of optimization methods for the issue of charging station location. In the review, the authors
summarized several research studies covering a certain period to show the advantageous solution models related to
charging infrastructure placement. Cavadas et al. (2015) presented an improved mathematical model for the location
of CSs in urban areas. In their model, Cavadas et al. (2015) considered variables such as the travelers’ parking
Research Methods for Engineers, Trimester 01, 2019 Page 1
Paraphrase This Document
Need a fresh take? Get an instant paraphrase of this document with our AI Paraphraser
locations and their daily activities. This was done to connect the demand on different locations which provides the
foundation for the transfer of demand between the sites. Their model also focused on realistic charging demand
patterns. For instance, the day was split up into several time intervals for a better reflection of the changing demand
over the day. This model however faces a major drawback in that it would be difficult to use a similar approach on
large-scale charging problems. This is because the computation complexity of the model increases making it more
demanding (Davidov and Pantoš, 2017). Zhu et al. (2016) proposed a novel model for the planning of charging
infrastructure and the optimal location of charging stations. The objective function used in the model simultaneously
handles the problem of CS location to minimize the overall cost of the CI placement. The major drawback of this
model is its failure to take into consideration the electric-drive vehicle behavior reflected in the flow of traffic.
According to Di Wu et al. (2014), planning and designing the charging infrastructure requires sufficient understanding
of the charging technology for optimal placing of the charging stations. with the aim to minimize the total cost of
placing charging stations while at the same time achieving certain coverage objectives, Huang et al. (2016) proposed a
two optimization models for two distinct electric vehicle charging methods-fast and slow charging. González et al.,
(2014) employed polygons to represent charging demands instead of discrete network points. However, aggregating
the charging demands in polygons for demand representation relaxation is a major disadvantage since the use of
polygons may present unrealistic charging demands for coverage by the constraints of optimization.
There has been limited use of actual vehicle trajectory data to model the optimal placement of charging stations,
which presents a research gap. This research aims to gather real-time vehicle data and use aggregation techniques to
analyze the trends to generate a model that can assist in the optimal placement of EDV charging stations. Broadly, this
research aims to develop an optimization model based on the stochastic process for minimizing the cost of the
charging station and long-term planning for the expansion of EDV charging infrastructure. Specifically, the research
aims to:
i) Use current tracking technology to collect data related to the movement of vehicles.
ii) Model the charging reliability of the charging infrastructure, CI
iii) Develop optimization model for charging station (CS) placement
iv) To perform similarity analysis of EDV trajectory data.
2. METHODOLOGY
Objective 1 will be accomplished by applying modern methods tracking the movement of objects to obtain trajectory
data for vehicles. According to Aloquili et al. (2009) there are several different methods currently available for the
automatic location of vehicles. These include location systems based on the global positioning system (GPS), systems
based on communication such as the general packet radio service (GPRS) and the systems based on database
technology including the geographic information system. These methods are popular and affordable and can be
applied in different tracking functions including single or multiple vehicle tracking. Particularly, GPS is a reliable
method of obtaining traffic data including the velocity of vehicles, their geological position, and altitude. According to
Mistary and Chile (2015), GPS tracking provides temporal and spatial data which can be used in a wide range of
applications from traffic control and management to transportation planning. For an object to be tracked using GPS
system, it must be fitted with a GPS tracking device that communicates with a network of satellites in orbit. Since this
research requires a significant amount of data, for a considerably large number of vehicles, the data needed will be
obtained from vehicle tracking companies that manage large fleets of vehicles. This means that the data to be used in
this research will be obtained from a secondary source. Therefore the materials required for obtaining this data can be
any device capable of accessing website servers to retrieve data. These devices can be either smartphones, laptops or
desktop computers.
Objective 2 will be met by using the methodology for the definition of charging reliability of the charging
infrastructure criterion presented by (Davidov and Pantoš, 2017). To place a charging station within electric-drive
vehicle’s driving range, at least one candidate location must be selected. To calculate the distance between the
trajectory discrete point and the location of the candidate point Euclidean distance formula will be used as shown
below.
ξ= √ ( mi−nv , s , j , t ) dx
2 + ( mi−nv ,s , j , t )dy
2 (i)
Where mi is the candidate location point, nv ,s , j ,t is the trajectory demand point and ξ is the Euclidean distance. The
distance between the candidate location on the road and the discrete demand point defines the Sv , j , t sets. It is assumed
that the above equation satisfies the distance-to-empty criterion according to which a total charging reliability of the
Research Methods for Engineers, Trimester 01, 2019 Page 2
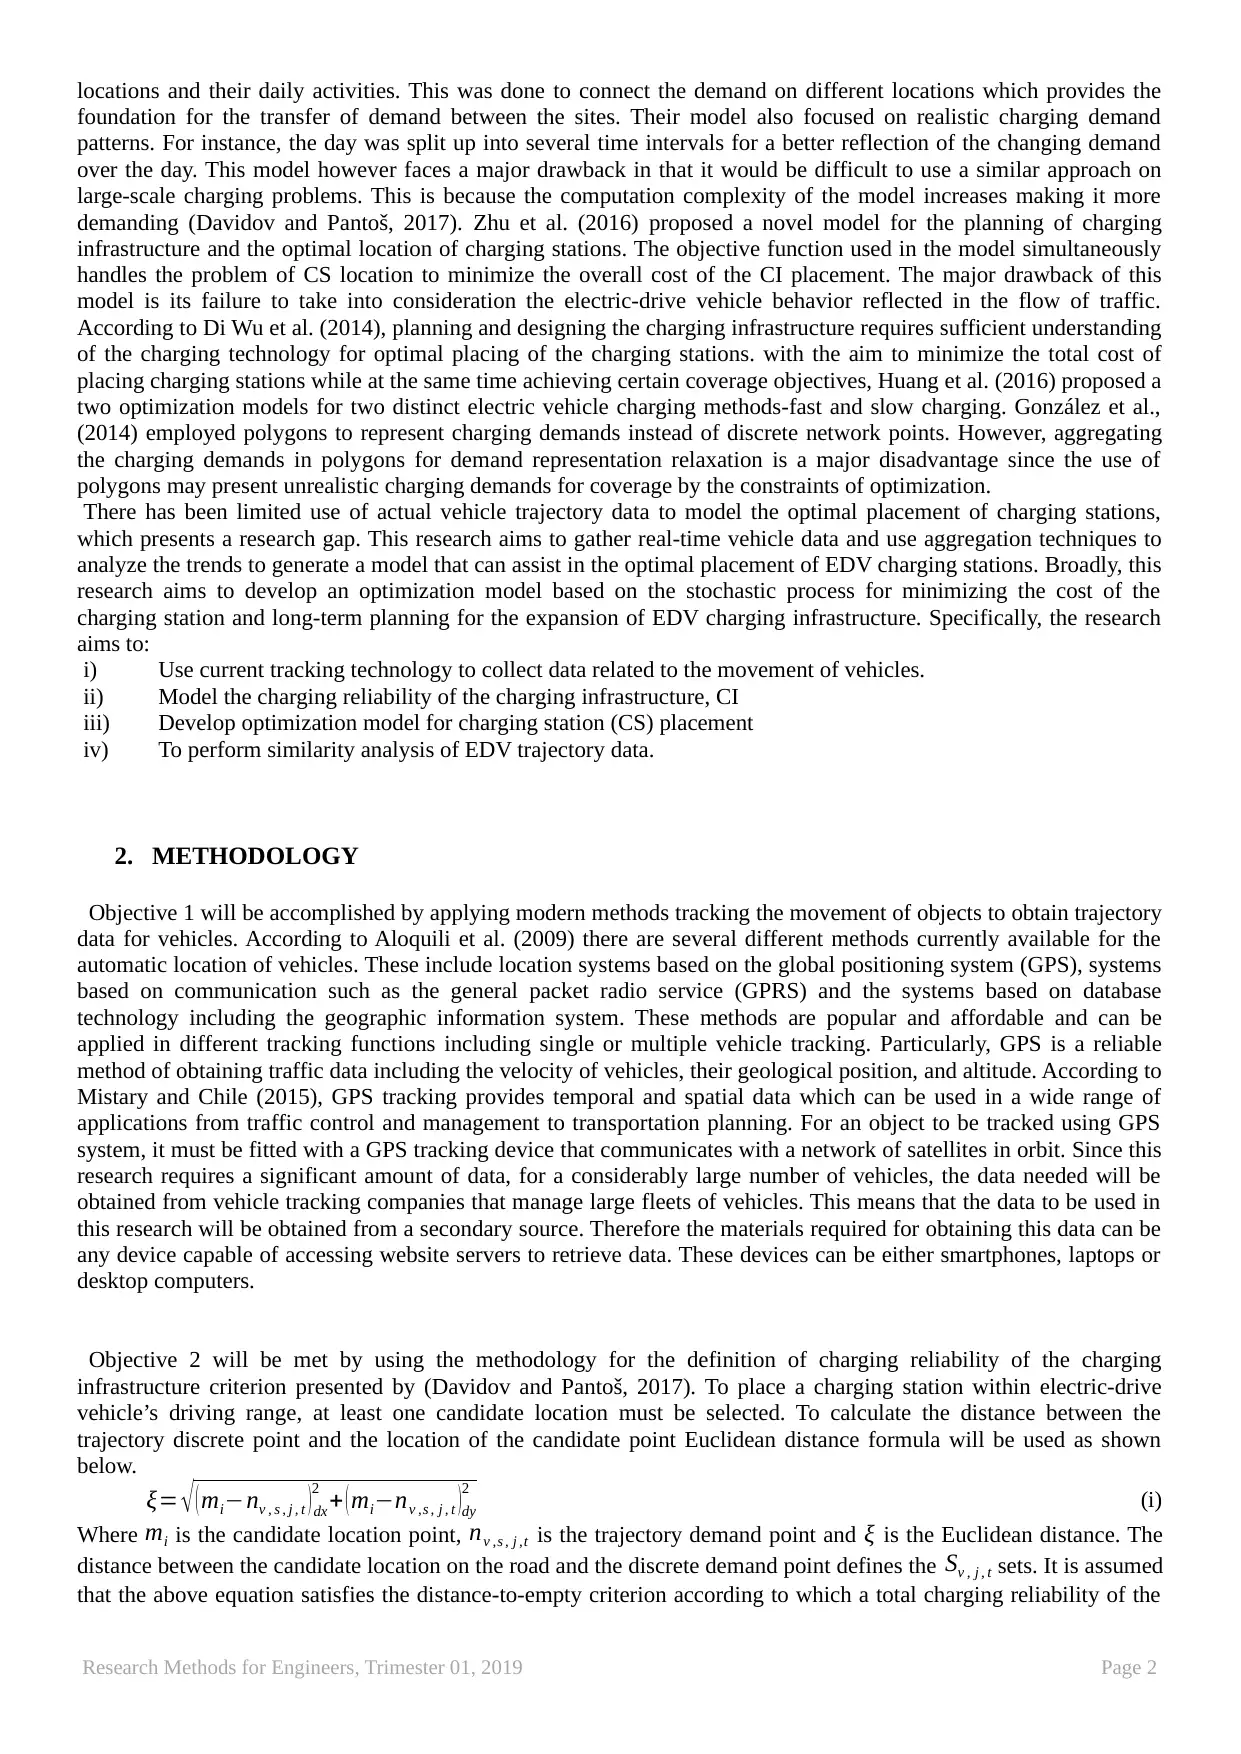
charging infrastructure is attained if a location picked is within the driving range of the EDVs in the planning of the
infrastructure (Zhang et al., 2012).
Figure 1. A depiction of the charging reliability criterion. Adapted from “Stochastic expansion planning of the
electric-drive vehicle charging infrastructure” by Davidov and Pantoš, 2017.
Objective 3 will be accomplished by using an objective function to minimize the overall cost for the placement of
charging stations for specific scenarios and trajectories for the EDV driving range. The objective function is given as,
Min {Fs=∑
t =1
T
∑
i=1
I
∑
k=1
K 1
wi
∙ ci ,k , s ∙ xi ,t ,k } (ii)
Where xi ,t ,k represents the binary decision variable related to the k-th candidate charging technology for the i-th
candidate location point at t-th time instance in an optimization period made up of T time instances and I candidate
locations. wi represents the traffic load weight for the i-th candidate location. ci , k ,s is the total cost needed to place the
k-th candidate charging technology at the i-th location. To ensure the charging reliability of the charging
infrastructure, the constraint given below is imposed on the objective function by the use of the ai ,v , s , j coefficient
defined before which includes the driving range of the EDV.
∑
i=1
I
ai , v, s , j ∙ xi ,t ,k ≥1 ; j=1,2, … , j v, s ;v=1,2 , … , V ;; k=1,2 , …, K ; t=1,2 , … , T ;s=1,2 , … , S (iii)
The left hand side of this equation specifies the entire candidate locations that are suitable according to the distance
criterion specified before so as to achieve charging reliability of the charging infrastructure. This constraint imposes
the optimization model to choose at least one location that is within the driving range of the v-th EDV driver.
Objective 4 will be accomplished by employing aggregation techniques for the comprehensive exploration and
visualization of vehicle movement data. According to Cho and Kang (2017), there are two types of movement namely
trajectory and traffic-oriented. However, in this research, only the trajectory-oriented approach will be considered. In
the trajectory-oriented approach, the collective movement of multiple objects is examined as a set of trajectories of
the objects. practically, the complete trajectory of each object covered in the duration of observation is normally split
into portions to represent the different trips of the entity. The traditional approach to the visualization and exploration
of movement data is incapable of handling the growing need the collection of large data amounts (Splechtna et al.,
2017). For multiple or many trajectories, it may be impractical to analyze each of the independently (Mekala et al.,
2016). In this case, aggregation is necessary so that the distribution of the critical properties for the entire set of
Research Methods for Engineers, Trimester 01, 2019 Page 3
⊘ This is a preview!⊘
Do you want full access?
Subscribe today to unlock all pages.
Trusted by 1+ million students worldwide
trajectories can be seen. Specific visualization and aggregation methods are needed for the spatio-temporal
properties, which include speed variations of the vehicles and their intermediate stops, and the spatial properties,
which include origins, routes, and destinations.
According to Andrienko and Andrienko (2013), generally, the trajectories are grouped by similarity according to the
characteristics relevant to the objectives of the study. The groups created in the first step are then represented in a
summarized format for convenient conveyance of the relevant characteristics. Suppose that the data of interest
concerns the origins and destinations of the vehicles, in this case, the groupings will be in terms of origins and
destinations. There are two methods that can be used in the aggregation of the data. These include aggregation by
origins and destination and aggregation by routes. The first method (known as S×S aggregation) ignores the route
taken by the vehicles from the origin to the destination. There are two possible approaches in this case. One approach
involves referring the starts and ends of the routes or trajectories to known areas. For the identified pair of areas, the
trajectories connecting them are grouped (Mekala et al., 2016). The second approach involves defining areas based on
spatial clustering of the start and stop areas of the routes. After the trajectory groups are created, the numeric
properties of the groups including size, mean, minimum, maximum and median are calculated for the trip distances
and durations. The results obtained are displayed in the form of a matrix with the columns corresponding to the
destinations and the rows corresponding to the origins. The aggregation can also be done accounting for the
intermediate areas accessed during a trip. Each trajectory then consists of a sequence of moves between the start and
end points. A move in this sense is defined by the time and place where it starts and the time and place where it ends.
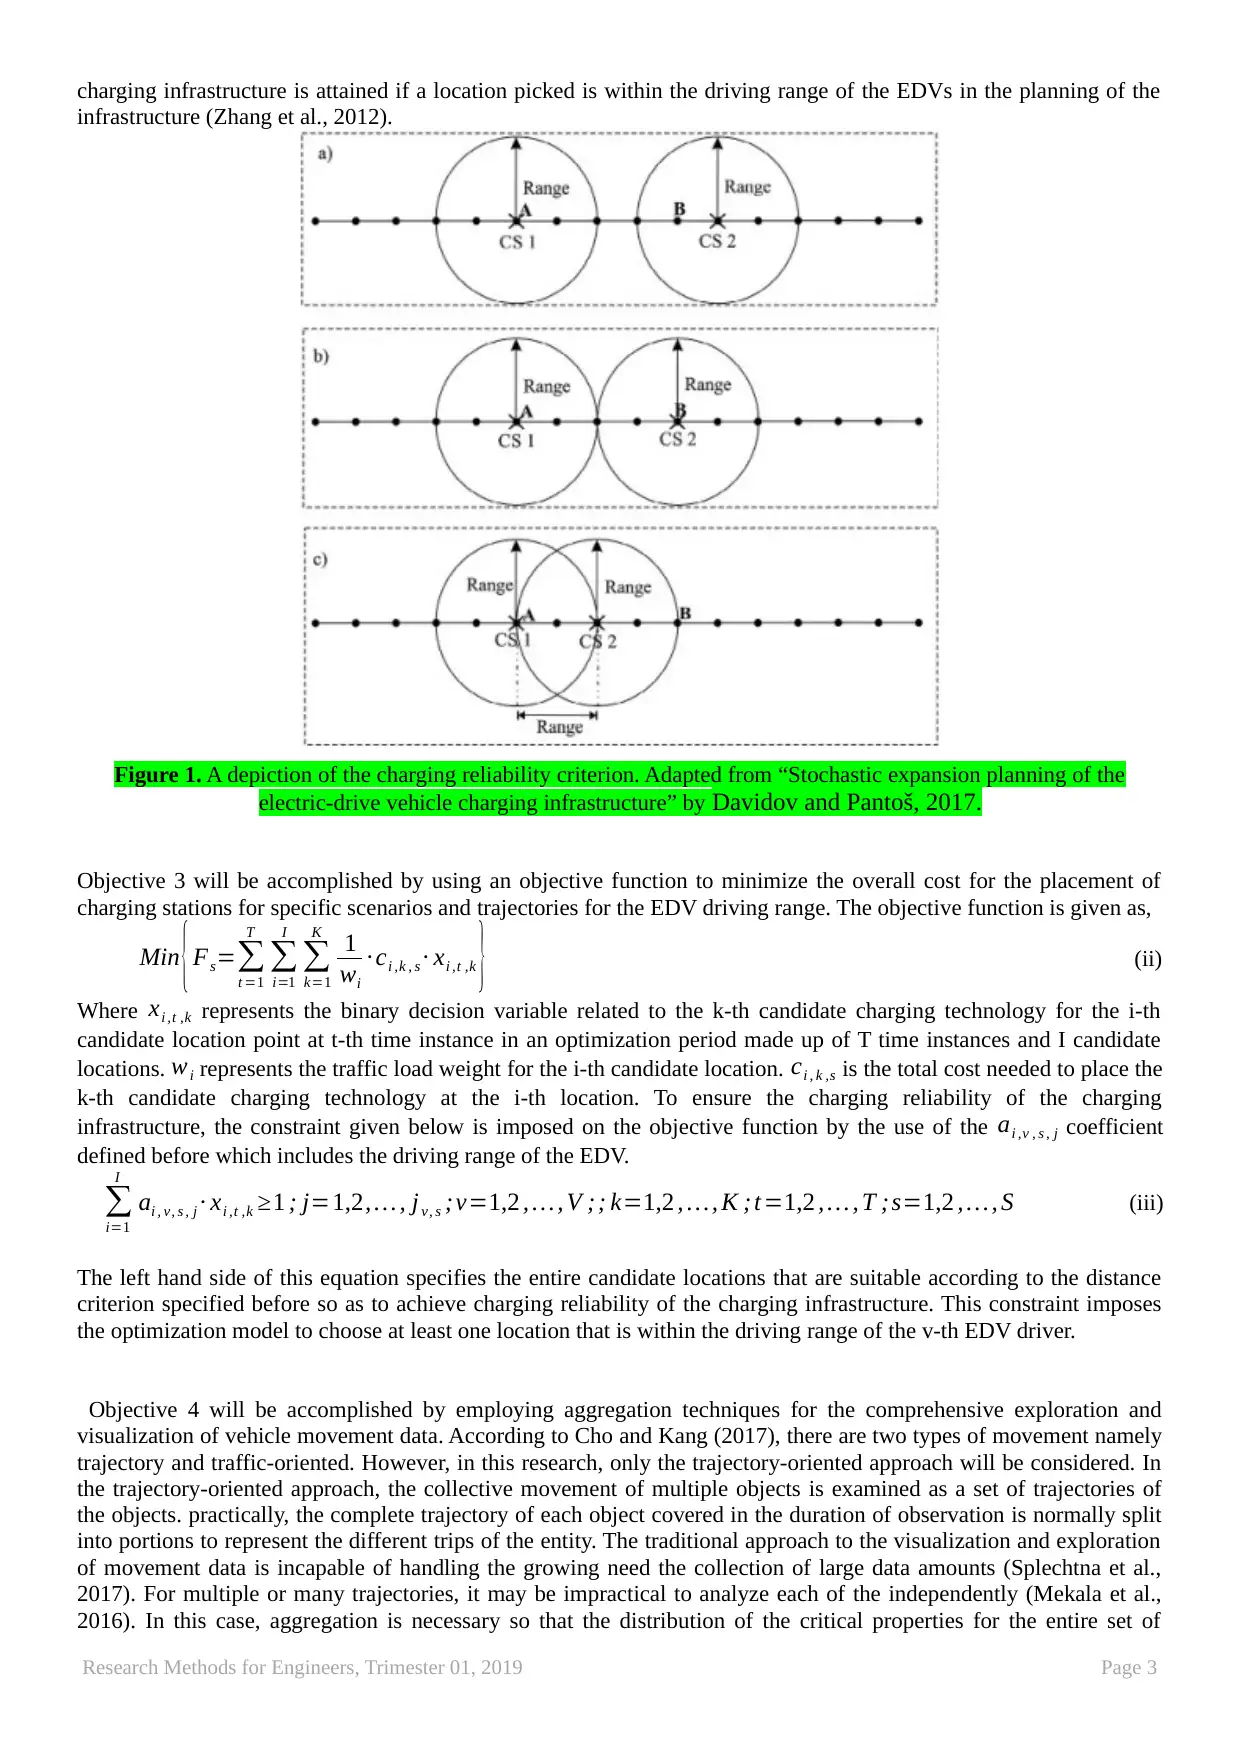
Moves with similar start and end places can be combined into an aggregate move Andrienko and Andrienko (2013).
Figure 2 below shows the summarization of trajectories.
Figure 2. Summarizing trajectories into aggregate moves. Adapted from “Spatio-temporal aggregation for visual
analysis of movements” by Gennady Andrienko and Natalia Andrienko, 2013.
3. DISSEMINATION OF FINDINGS
After a research is finalized, the results or findings must be communicated in a manner that is convenient and
beneficial as a way of spreading knowledge and understanding. One of the channels to be used for the dissemination
of this research’s findings will be through presentation to a panel of peers on 29/9/2020. The presentation of research
findings at professional gatherings enables rapid dissemination of information. However, the audience may be limited
and narrow which makes the depth of the information provided through this method limited. Consequently, this
research will later be published in peer-reviewed journals related to this field such as the journal of Energy and
Environmental science. The ability to access this work over the internet will ensure that it reaches a wider audience
across the globe.
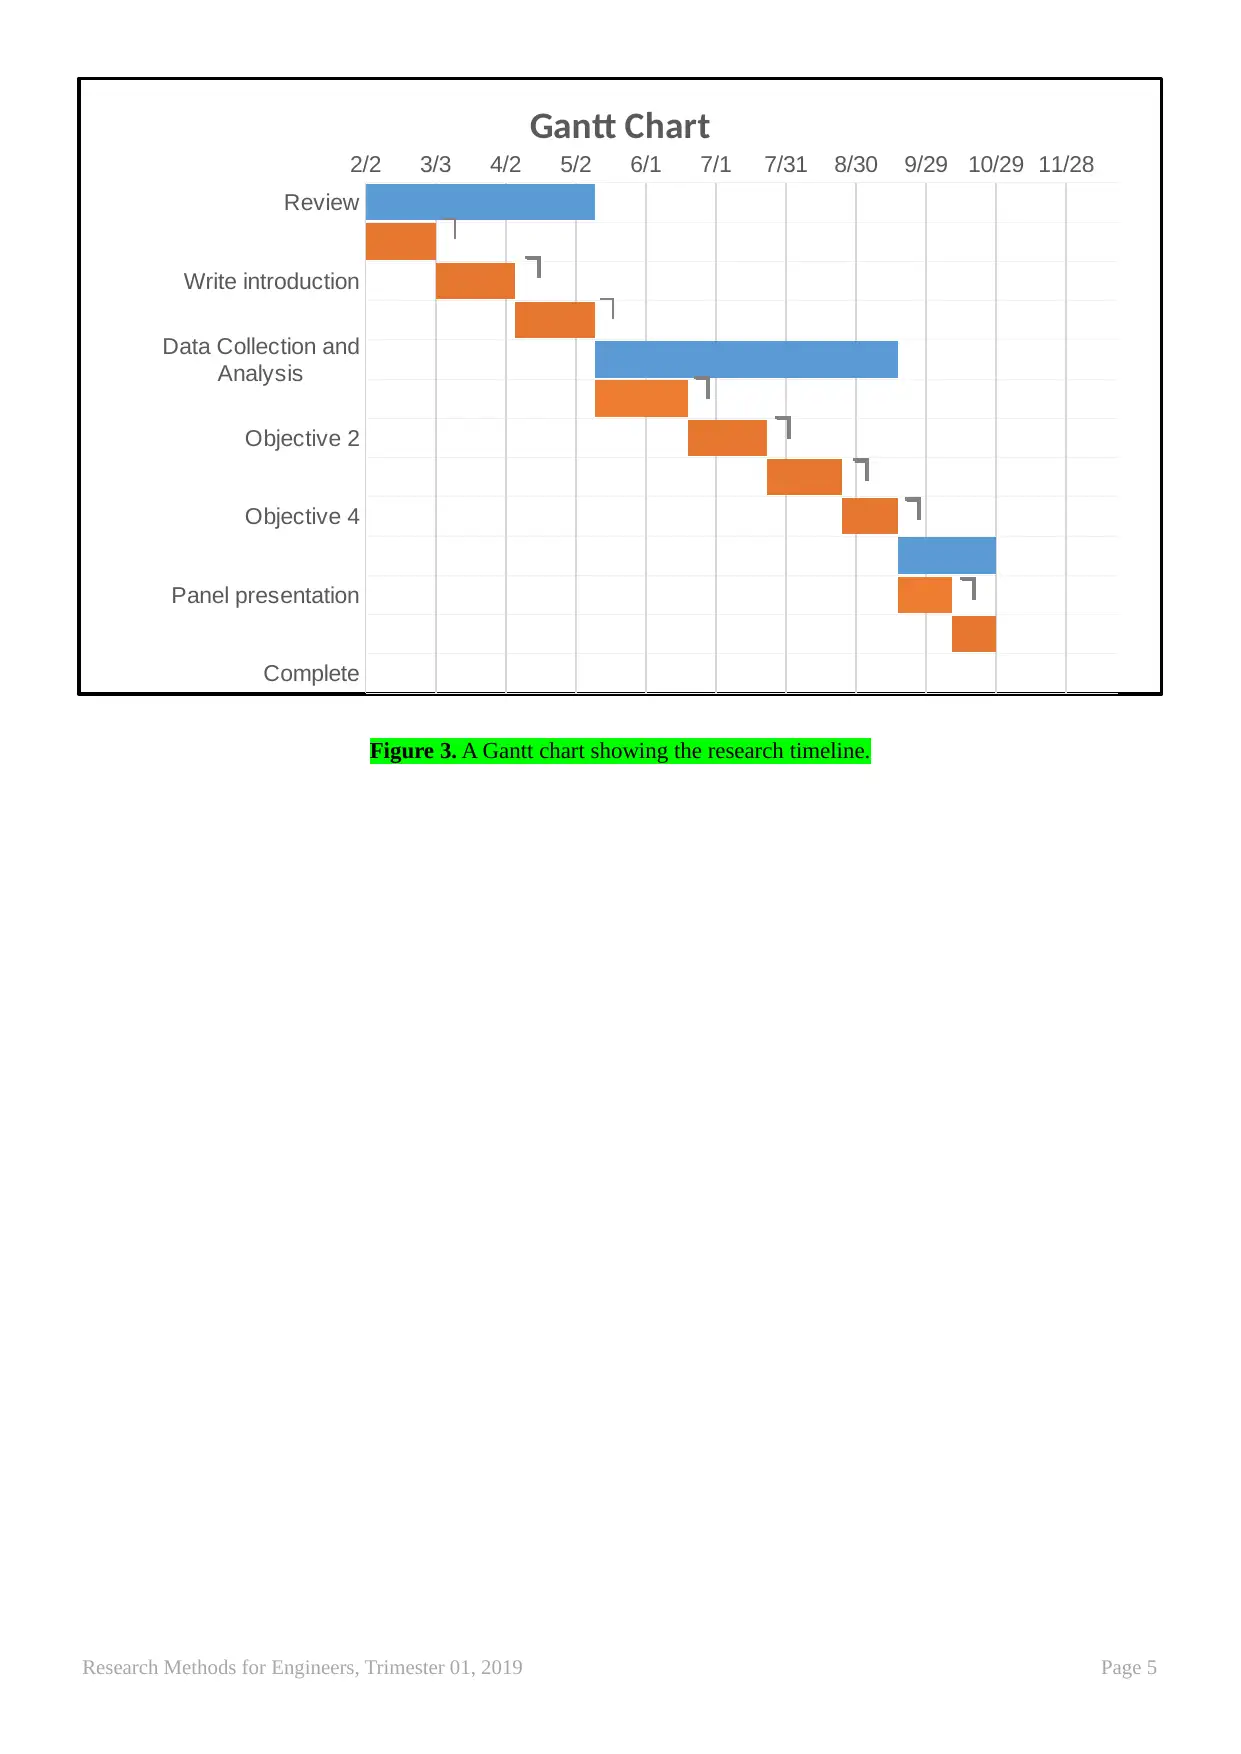
4. ESTIMATED PROJECT TIMELINE
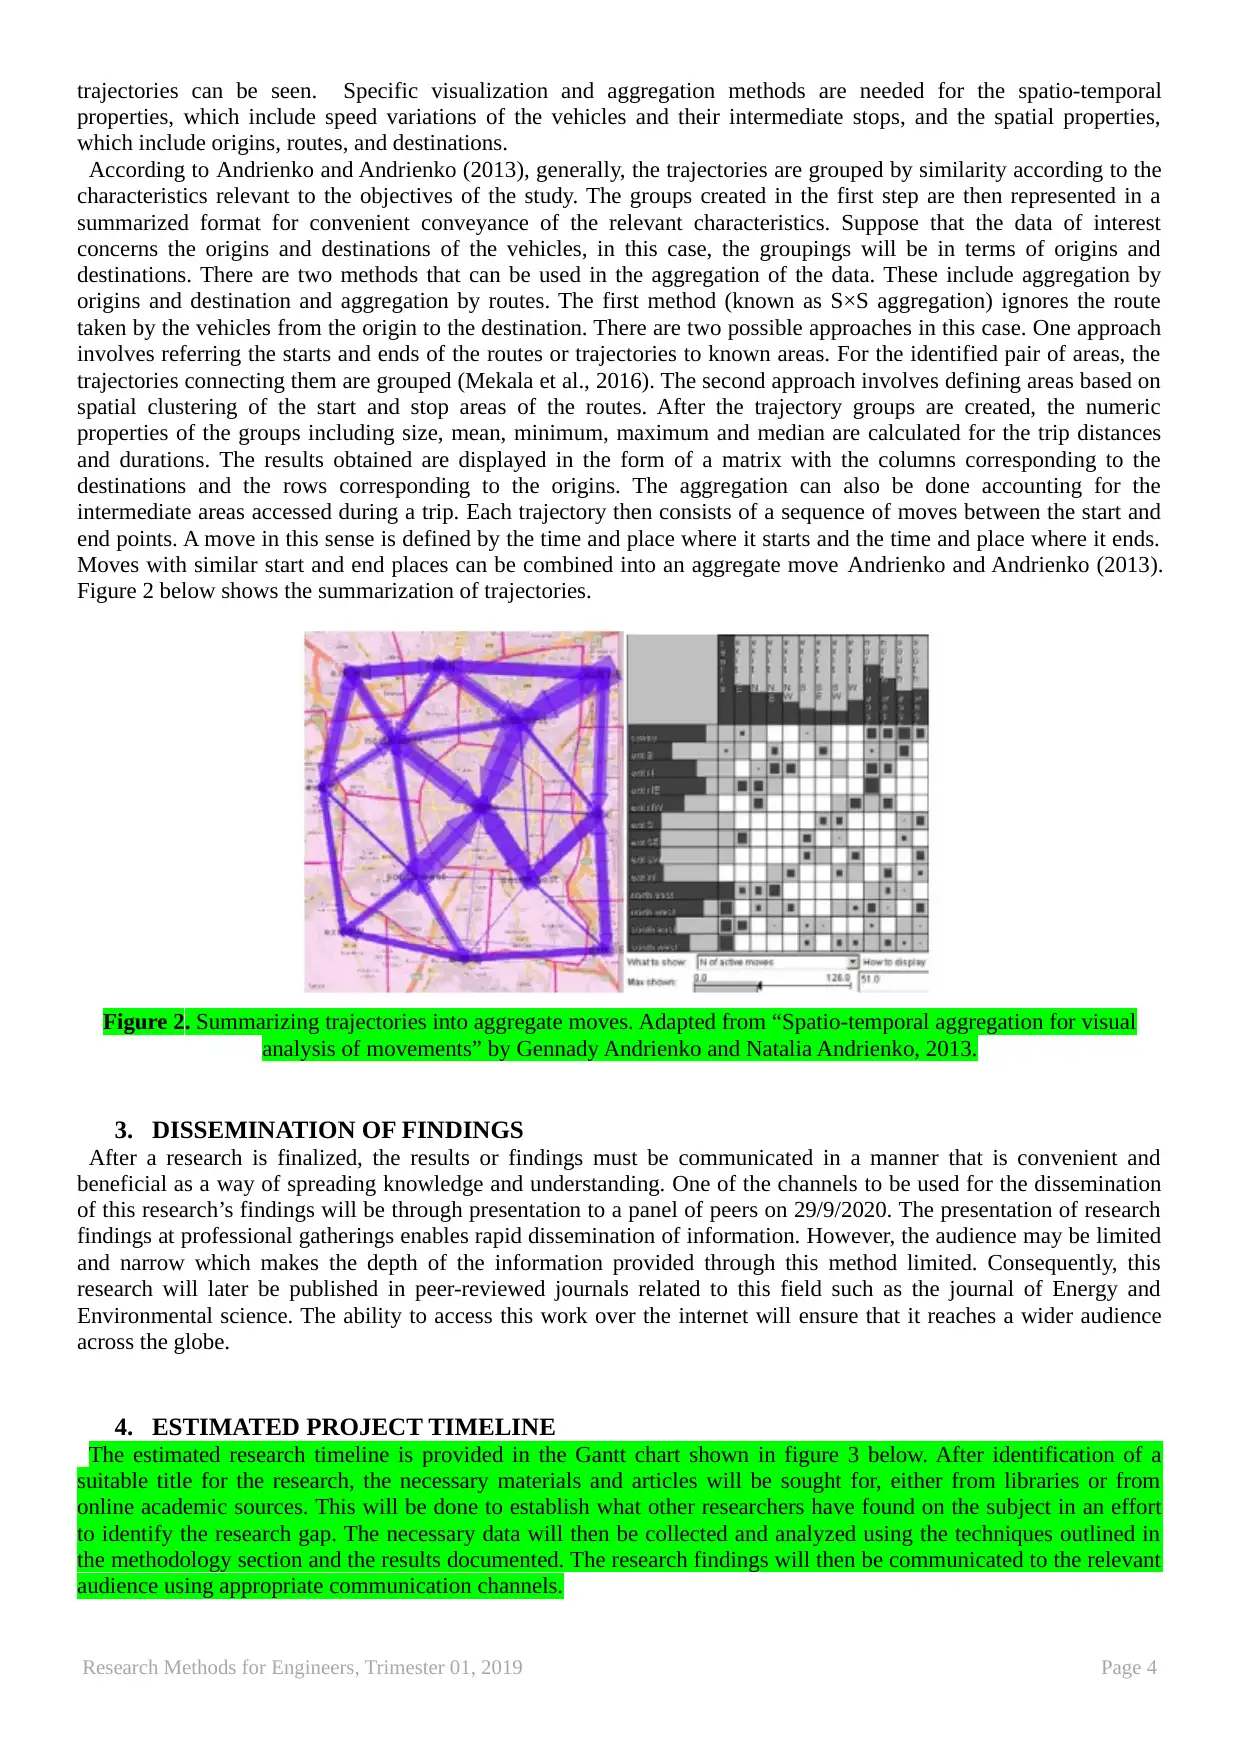
The estimated research timeline is provided in the Gantt chart shown in figure 3 below. After identification of a
suitable title for the research, the necessary materials and articles will be sought for, either from libraries or from
online academic sources. This will be done to establish what other researchers have found on the subject in an effort
to identify the research gap. The necessary data will then be collected and analyzed using the techniques outlined in
the methodology section and the results documented. The research findings will then be communicated to the relevant
audience using appropriate communication channels.
Research Methods for Engineers, Trimester 01, 2019 Page 4
properties, which include speed variations of the vehicles and their intermediate stops, and the spatial properties,
which include origins, routes, and destinations.
According to Andrienko and Andrienko (2013), generally, the trajectories are grouped by similarity according to the
characteristics relevant to the objectives of the study. The groups created in the first step are then represented in a
summarized format for convenient conveyance of the relevant characteristics. Suppose that the data of interest
concerns the origins and destinations of the vehicles, in this case, the groupings will be in terms of origins and
destinations. There are two methods that can be used in the aggregation of the data. These include aggregation by
origins and destination and aggregation by routes. The first method (known as S×S aggregation) ignores the route
taken by the vehicles from the origin to the destination. There are two possible approaches in this case. One approach
involves referring the starts and ends of the routes or trajectories to known areas. For the identified pair of areas, the
trajectories connecting them are grouped (Mekala et al., 2016). The second approach involves defining areas based on
spatial clustering of the start and stop areas of the routes. After the trajectory groups are created, the numeric
properties of the groups including size, mean, minimum, maximum and median are calculated for the trip distances
and durations. The results obtained are displayed in the form of a matrix with the columns corresponding to the
destinations and the rows corresponding to the origins. The aggregation can also be done accounting for the
intermediate areas accessed during a trip. Each trajectory then consists of a sequence of moves between the start and
end points. A move in this sense is defined by the time and place where it starts and the time and place where it ends.
Moves with similar start and end places can be combined into an aggregate move Andrienko and Andrienko (2013).
Figure 2 below shows the summarization of trajectories.
Figure 2. Summarizing trajectories into aggregate moves. Adapted from “Spatio-temporal aggregation for visual
analysis of movements” by Gennady Andrienko and Natalia Andrienko, 2013.
3. DISSEMINATION OF FINDINGS
After a research is finalized, the results or findings must be communicated in a manner that is convenient and
beneficial as a way of spreading knowledge and understanding. One of the channels to be used for the dissemination
of this research’s findings will be through presentation to a panel of peers on 29/9/2020. The presentation of research
findings at professional gatherings enables rapid dissemination of information. However, the audience may be limited
and narrow which makes the depth of the information provided through this method limited. Consequently, this
research will later be published in peer-reviewed journals related to this field such as the journal of Energy and
Environmental science. The ability to access this work over the internet will ensure that it reaches a wider audience
across the globe.
4. ESTIMATED PROJECT TIMELINE
The estimated research timeline is provided in the Gantt chart shown in figure 3 below. After identification of a
suitable title for the research, the necessary materials and articles will be sought for, either from libraries or from
online academic sources. This will be done to establish what other researchers have found on the subject in an effort
to identify the research gap. The necessary data will then be collected and analyzed using the techniques outlined in
the methodology section and the results documented. The research findings will then be communicated to the relevant
audience using appropriate communication channels.
Research Methods for Engineers, Trimester 01, 2019 Page 4
Paraphrase This Document
Need a fresh take? Get an instant paraphrase of this document with our AI Paraphraser
Review
Write introduction
Data Collection and
Analysis
Objective 2
Objective 4
Panel presentation
Complete
2/2 3/3 4/2 5/2 6/1 7/1 7/31 8/30 9/29 10/29 11/28
Gantt Chart
Figure 3. A Gantt chart showing the research timeline.
Research Methods for Engineers, Trimester 01, 2019 Page 5
Write introduction
Data Collection and
Analysis
Objective 2
Objective 4
Panel presentation
Complete
2/2 3/3 4/2 5/2 6/1 7/1 7/31 8/30 9/29 10/29 11/28
Gantt Chart
Figure 3. A Gantt chart showing the research timeline.
Research Methods for Engineers, Trimester 01, 2019 Page 5
5. REFERENCES
Aloquili, O., Elbanna, A., & Al-Azizi, A. (2009). Automatic vehicle location tracking system based on GIS
environment. IET Software, 3(4), 255. doi:10.1049/iet-sen.2008.0048
Andrienko, N., & Andrienko, G. (2013). A visual analytics framework for spatio-temporal analysis and
modelling. Data Mining and Knowledge Discovery, 27(1), 55-83.
Andriollo, M., & Tortella, A. (2015). Sustainability evaluation of an electric bus fleet for the urban public
transport system of Padova, Italy. Urban Transport XXI. doi:10.2495/ut150431
Cavadas, J., Homem de Almeida Correia, G., & Gouveia, J. (2015). A MIP model for locating slow-
charging stations for electric vehicles in urban areas accounting for driver tours. Transportation
Research Part E: Logistics and Transportation Review, 75, 188-201. doi:10.1016/j.tre.2014.11.005
Cho, N., & Kang, Y. (2017). Space-time density of field trip trajectory: exploring spatio-temporal patterns
in movement data. Spatial Information Research, 25(1), 141-150. doi:10.1007/s41324-016-0079-x
Davidov, S., & Pantoš, M. (2017). Impact of stochastic driving range on the optimal charging infrastructure
expansion planning. Energy, 141, 603-612. doi:10.1016/j.energy.2017.09.126
Davidov, S., & Pantoš, M. (2017). Stochastic expansion planning of the electric-drive vehicle charging
infrastructure. Energy, 141, 189-201. doi:10.1016/j.energy.2017.09.065
Di Wu, Haibo Zeng, & Boulet, B. (2014). Neighborhood level network aware electric vehicle charging
management with mixed control strategy. 2014 IEEE International Electric Vehicle Conference
(IEVC). doi:10.1109/ievc.2014.7056207
González, J., Alvaro, R., Gamallo, C., Fuentes, M., Fraile-Ardanuy, J., Knapen, L., & Janssens, D. (2014).
Determining Electric Vehicle Charging Point Locations Considering Drivers’ Daily Activities.
Procedia Computer Science, 32, 647-654. doi:10.1016/j.procs.2014.05.472
Huang, K., Kanaroglou, P., & Zhang, X. (2016). The design of electric vehicle charging
network. Transportation Research Part D: Transport and Environment, 49, 1-17.
Li, W., Li, Y., Deng, H., & Bao, L. (2018). Planning of Electric Public Transport System under Battery
Swap Mode. Sustainability, 10(7), 2528. doi:10.3390/su10072528
Research Methods for Engineers, Trimester 01, 2019 Page 6
⊘ This is a preview!⊘
Do you want full access?
Subscribe today to unlock all pages.
Trusted by 1+ million students worldwide
Mekala, A. R., Madria, S., & Linderman, M. (2016). Aerial vehicle trajectory design for spatio-temporal
task aggregation. 2016 International Conference on Unmanned Aircraft Systems (ICUAS).
doi:10.1109/icuas.2016.7502517
Mistary, P. V., & Chile, R. H. (2015). Real time Vehicle tracking system based on ARM7 GPS and GSM
technology. In 2015 Annual IEEE India Conference (INDICON) (pp. 1-6). IEEE.
Rahman, I., Vasant, P. M., Singh, B. S., Abdullah-Al-Wadud, M., & Adnan, N. (2016). Review of recent
trends in optimization techniques for plug-in hybrid, and electric vehicle charging infrastructures.
Renewable and Sustainable Energy Reviews, 58, 1039-1047. doi:10.1016/j.rser.2015.12.353
Splechtna, R., Podaras, S., Beham, M., Gracanin, D., & Matkovic, K. (2017). MC2 — Spatio-Temporal
Provenance Data Aggregation for Visual Analysis. 2017 IEEE Conference on Visual Analytics
Science and Technology (VAST). doi:10.1109/vast.2017.8585615
Zhang, Y., Wang, W., Kobayashi, Y., & Shirai, K. (2012). Remaining driving range estimation of electric
vehicle. 2012 IEEE International Electric Vehicle Conference. doi:10.1109/ievc.2012.6183172
Zhu, Z. H., Gao, Z. Y., Zheng, J. F., & Du, H. M. (2016). Charging station location problem of plug-in
electric vehicles. Journal of Transport Geography, 52, 11-22.
Research Methods for Engineers, Trimester 01, 2019 Page 7
1 out of 7


Your All-in-One AI-Powered Toolkit for Academic Success.
+13062052269
info@desklib.com
Available 24*7 on WhatsApp / Email
![[object Object]](/_next/static/media/star-bottom.7253800d.svg)
Unlock your academic potential
Copyright © 2020–2026 A2Z Services. All Rights Reserved. Developed and managed by ZUCOL.