Financial Management: Stock Exchange Comparison and Analysis

Verified

Added on  2022/09/26

|8
|874
|16
Report
AI Summary
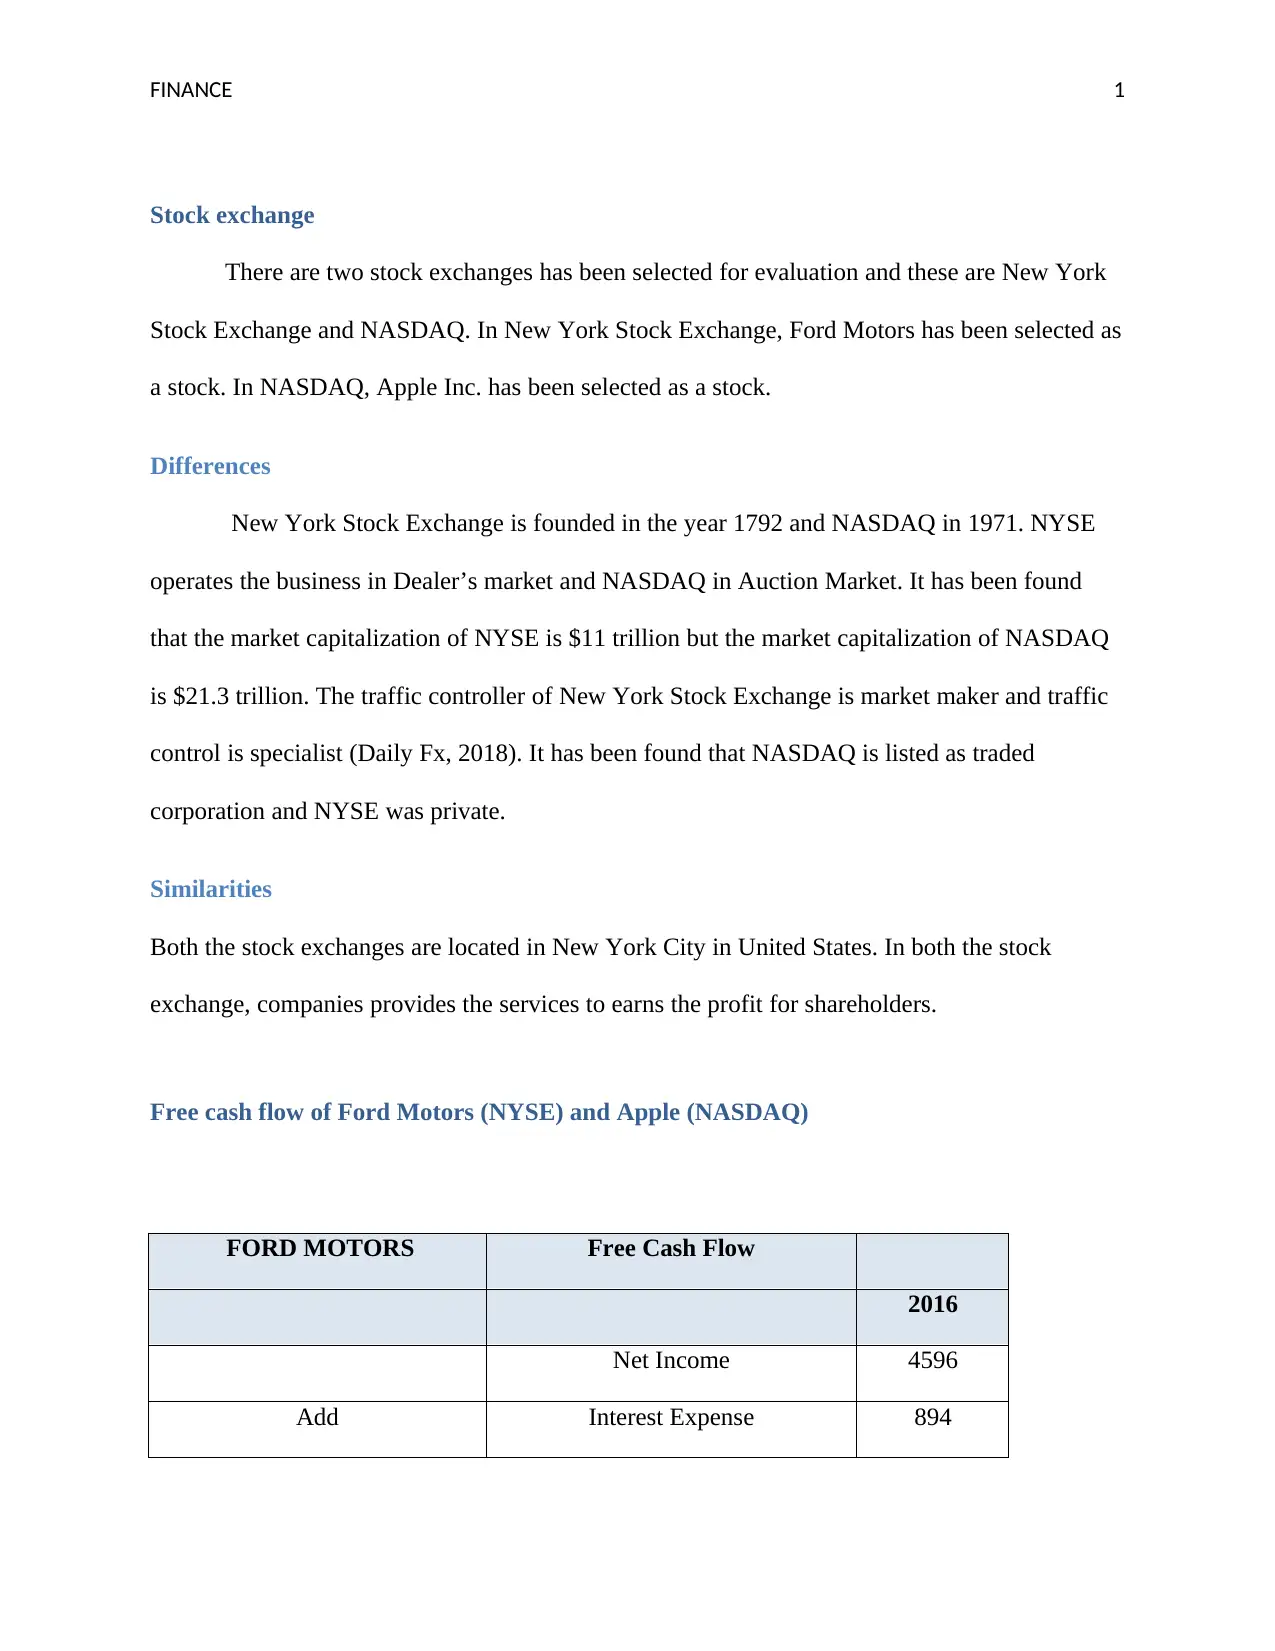
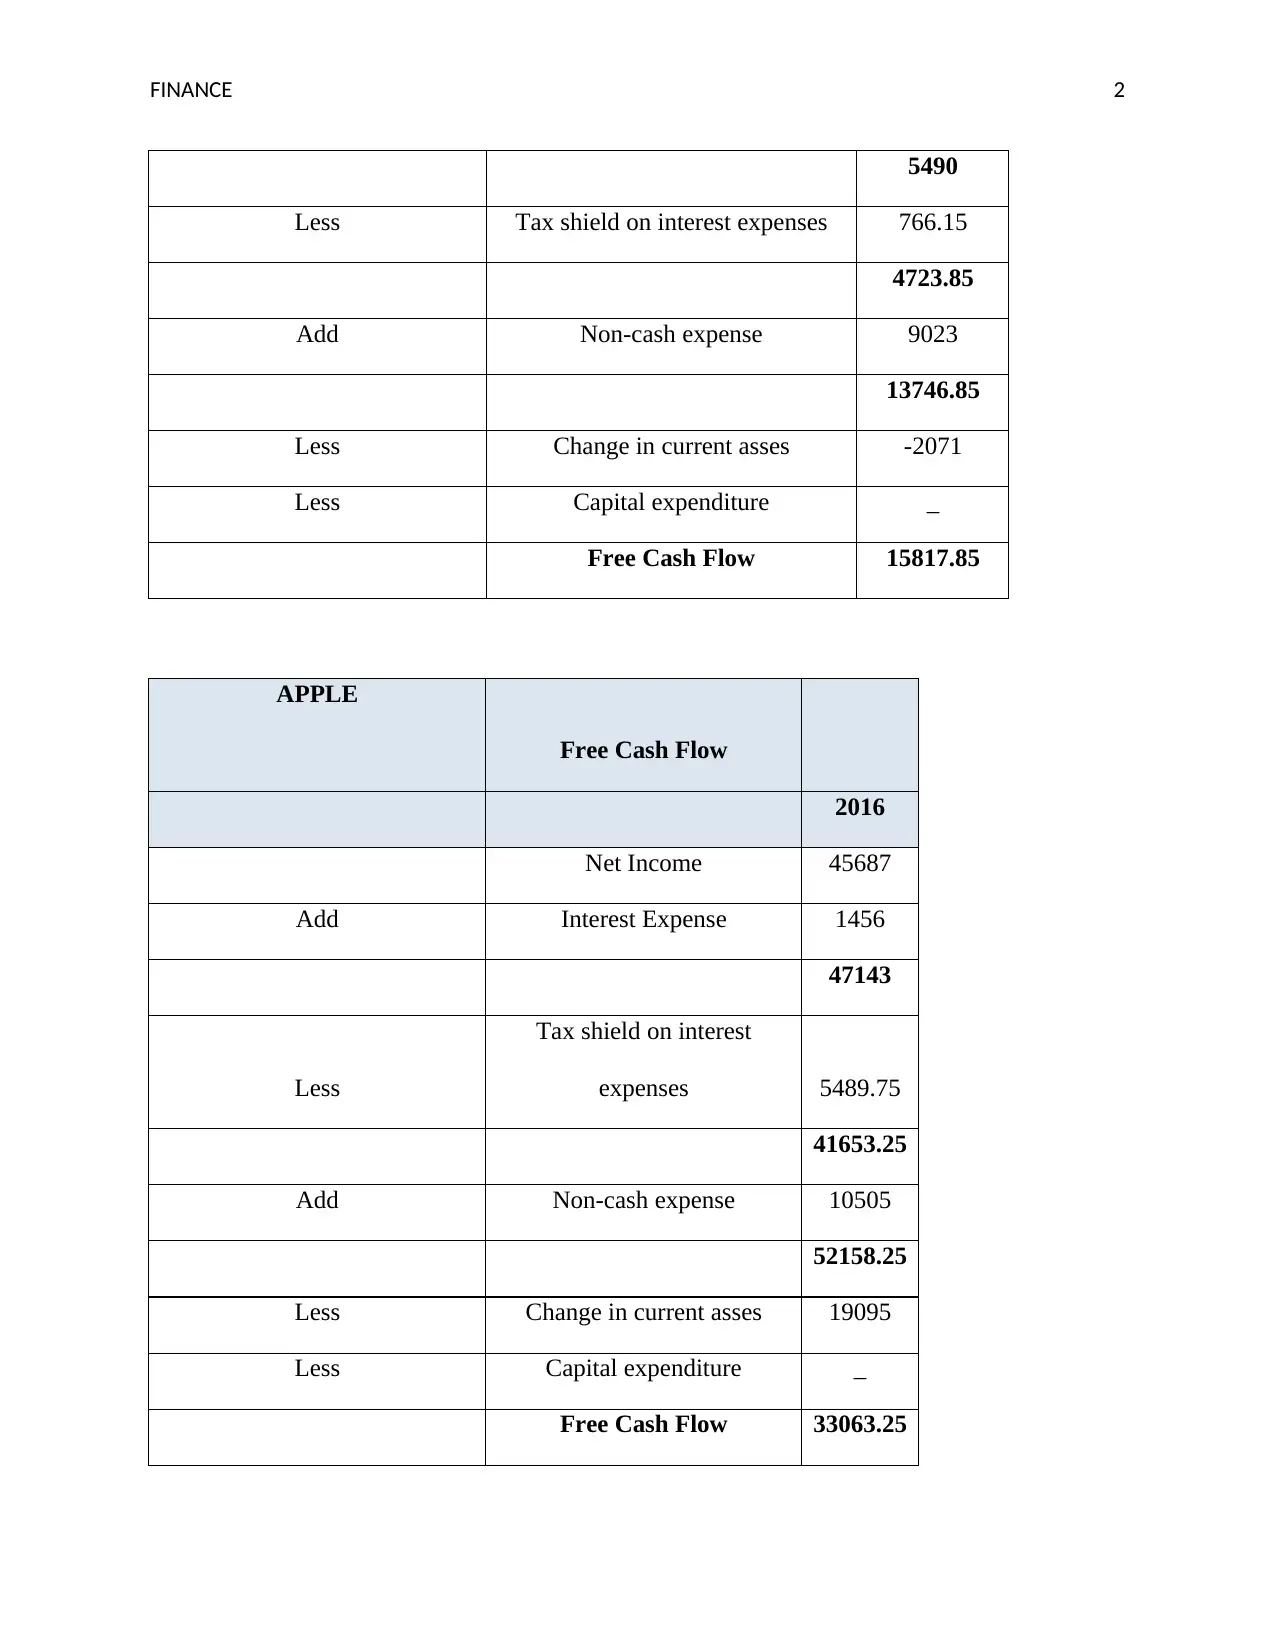
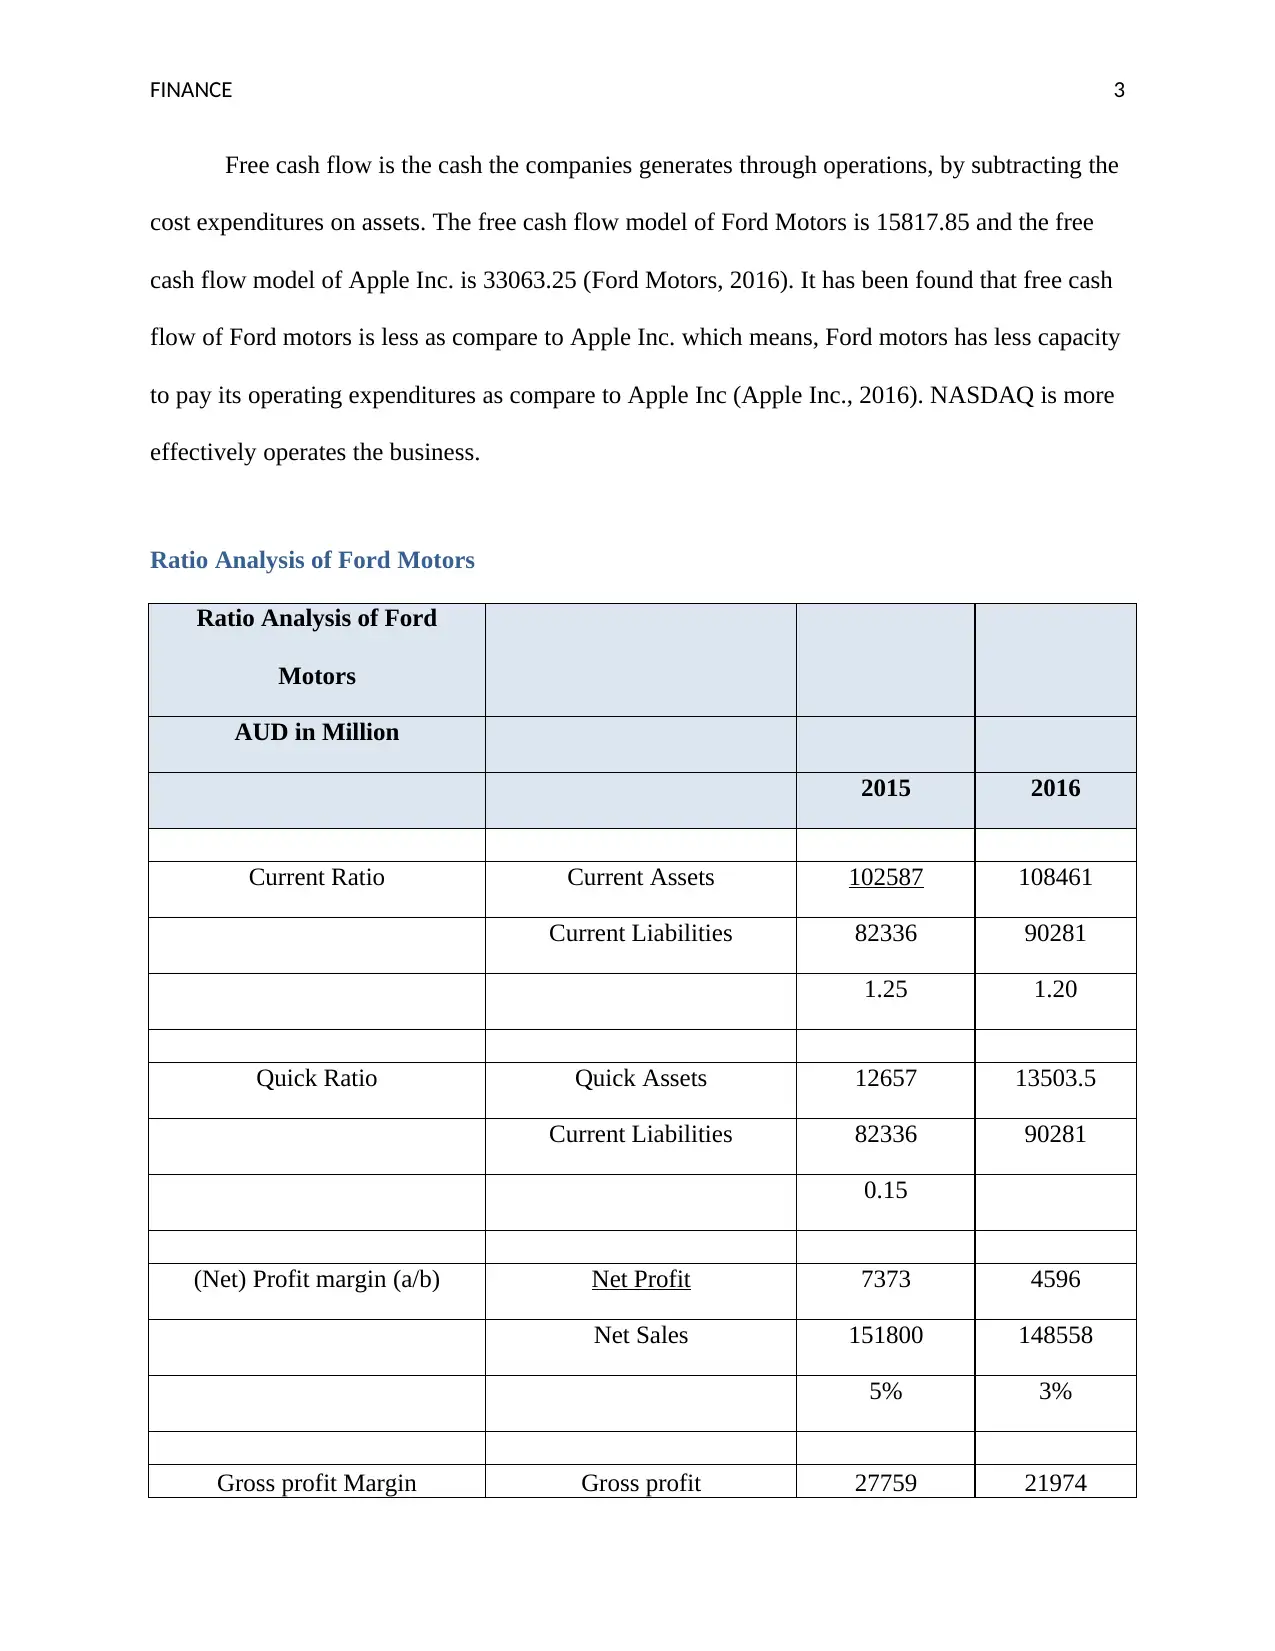
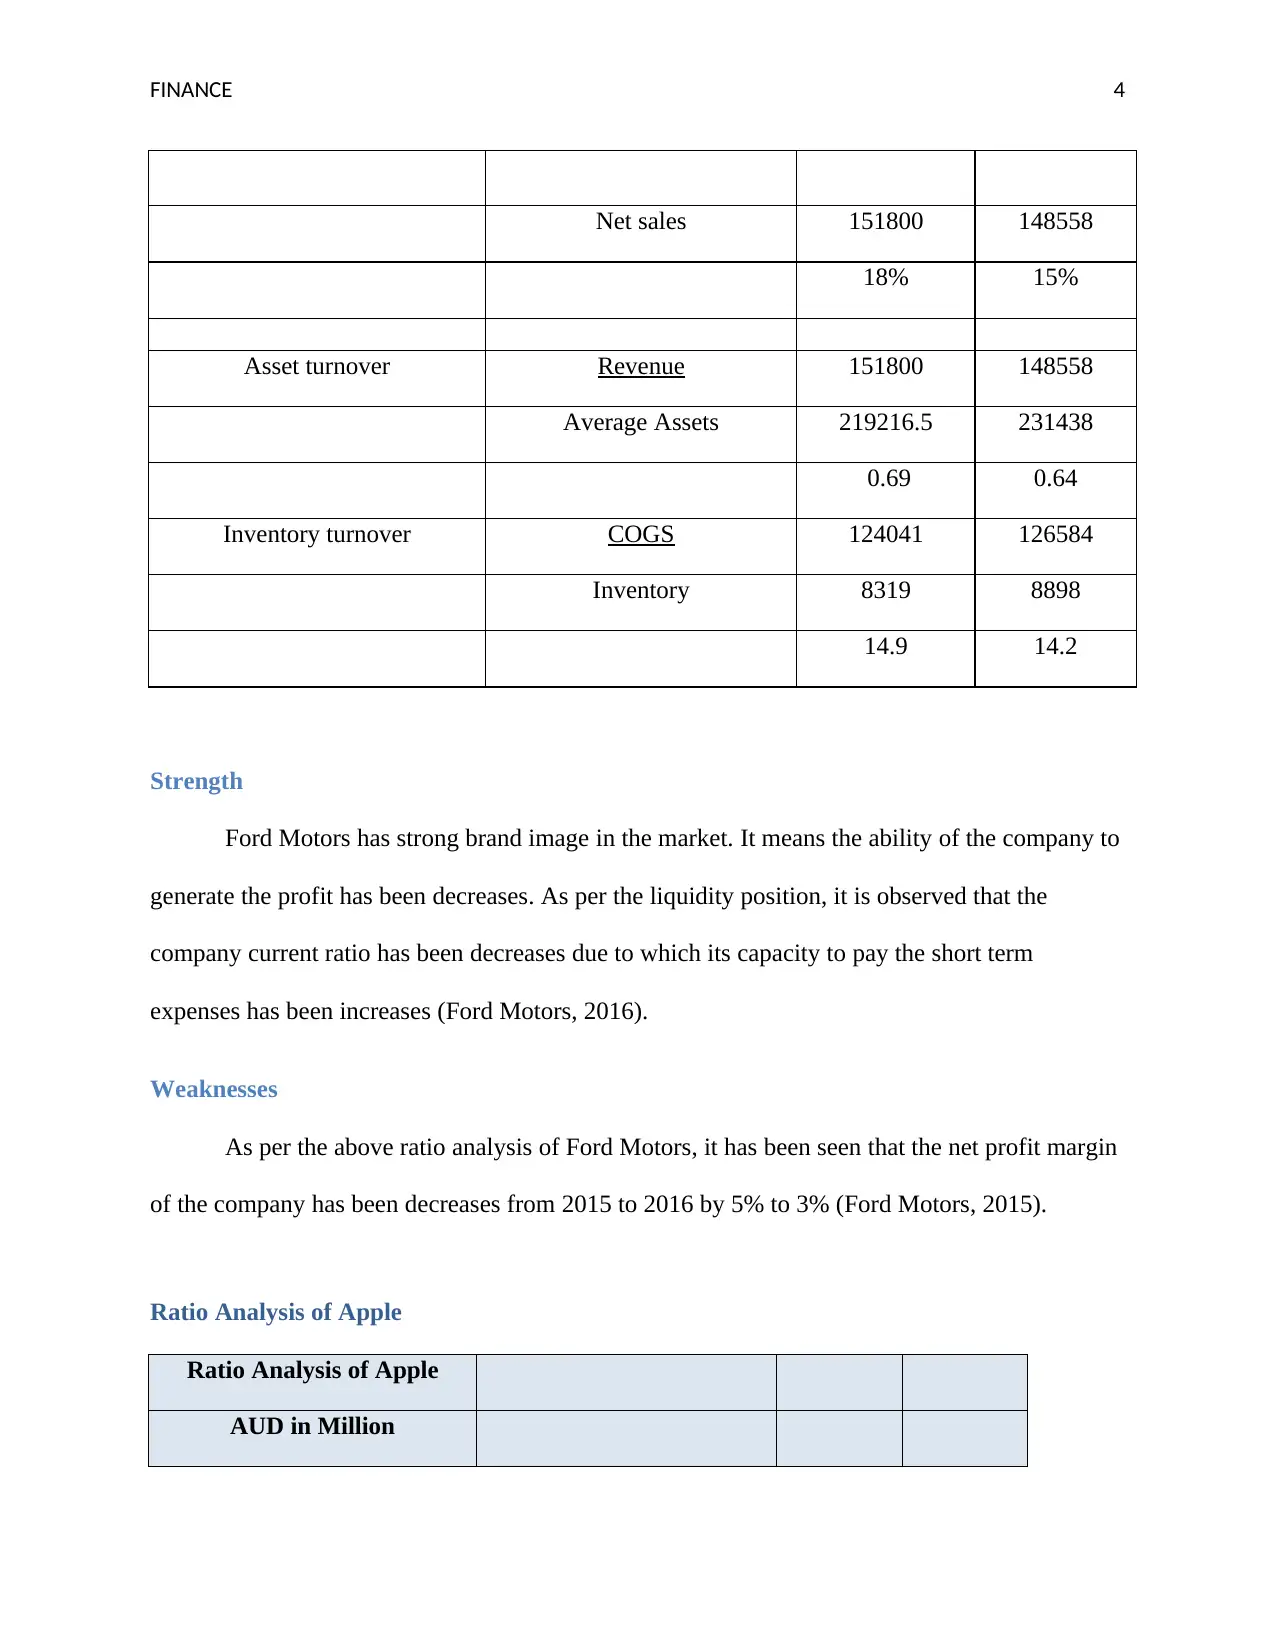
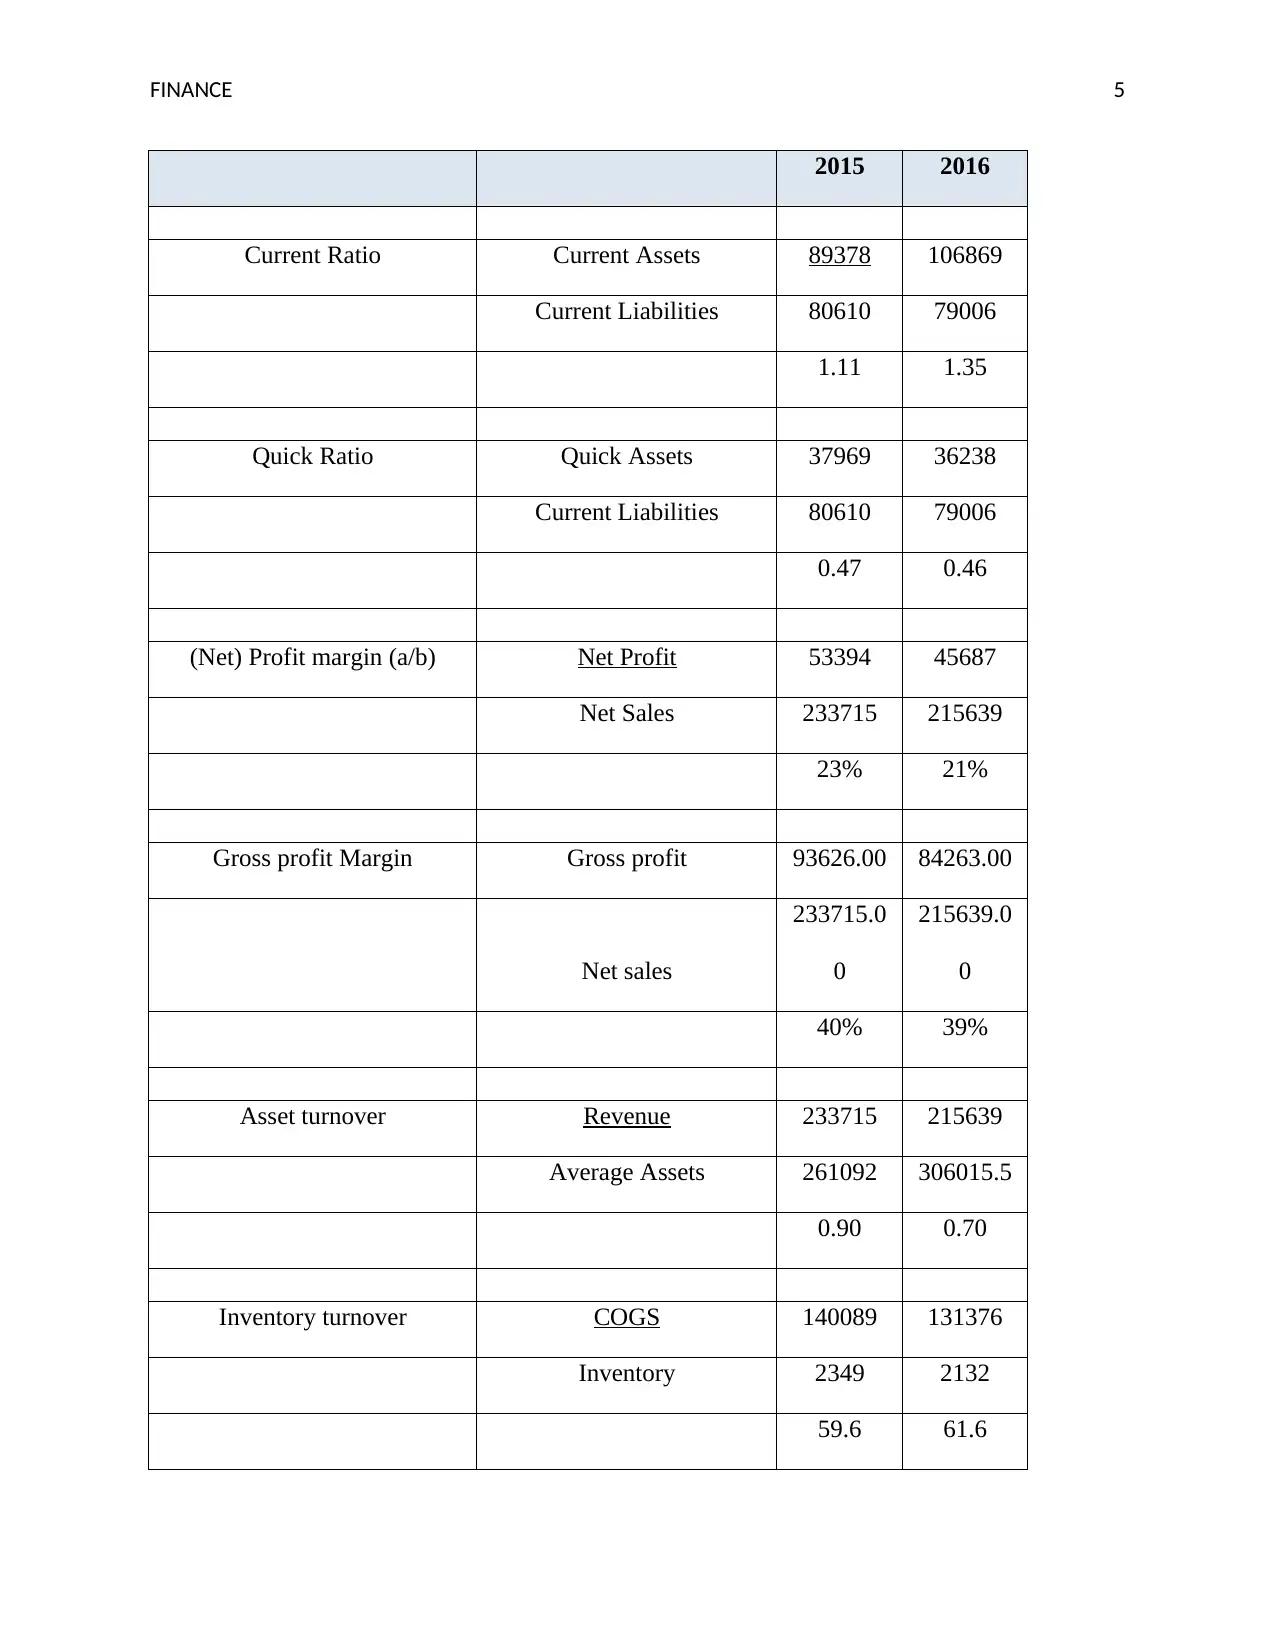
This report provides a comparative financial analysis of two major stock exchanges: the New York Stock Exchange (NYSE) and NASDAQ. It examines the key differences between the exchanges, including their founding dates, market mechanisms (dealer vs. auction), and market capitalization. The report then delves into the financial performance of selected stocks from each exchange: Ford Motors (NYSE) and Apple Inc. (NASDAQ). Free cash flow models are presented for both companies, highlighting their ability to generate cash from operations. Furthermore, the report includes a detailed ratio analysis of Ford Motors and Apple Inc. for the years 2015 and 2016, covering key metrics like current ratio, quick ratio, profit margins, asset turnover, and inventory turnover. Strengths and weaknesses of each company are identified based on the financial data, offering insights into their financial health and operational efficiency. The report concludes by summarizing the key findings and comparing the overall performance of the two stock exchanges and the selected companies.
Document Page
Financial Management
tabler-icon-diamond-filled.svg

Paraphrase This Document

Need a fresh take? Get an instant paraphrase of this document with our AI Paraphraser
Document Page
FINANCE 1
Stock exchange
There are two stock exchanges has been selected for evaluation and these are New York
Stock Exchange and NASDAQ. In New York Stock Exchange, Ford Motors has been selected as
a stock. In NASDAQ, Apple Inc. has been selected as a stock.
Differences
New York Stock Exchange is founded in the year 1792 and NASDAQ in 1971. NYSE
operates the business in Dealer’s market and NASDAQ in Auction Market. It has been found
that the market capitalization of NYSE is $11 trillion but the market capitalization of NASDAQ
is $21.3 trillion. The traffic controller of New York Stock Exchange is market maker and traffic
control is specialist (Daily Fx, 2018). It has been found that NASDAQ is listed as traded
corporation and NYSE was private.
Similarities
Both the stock exchanges are located in New York City in United States. In both the stock
exchange, companies provides the services to earns the profit for shareholders.
Free cash flow of Ford Motors (NYSE) and Apple (NASDAQ)
FORD MOTORS Free Cash Flow
2016
Net Income 4596
Add Interest Expense 894
Document Page
FINANCE 2
5490
Less Tax shield on interest expenses 766.15
4723.85
Add Non-cash expense 9023
13746.85
Less Change in current asses -2071
Less Capital expenditure _
Free Cash Flow 15817.85
APPLE
Free Cash Flow
2016
Net Income 45687
Add Interest Expense 1456
47143
Less
Tax shield on interest
expenses 5489.75
41653.25
Add Non-cash expense 10505
52158.25
Less Change in current asses 19095
Less Capital expenditure _
Free Cash Flow 33063.25
Document Page
FINANCE 3
Free cash flow is the cash the companies generates through operations, by subtracting the
cost expenditures on assets. The free cash flow model of Ford Motors is 15817.85 and the free
cash flow model of Apple Inc. is 33063.25 (Ford Motors, 2016). It has been found that free cash
flow of Ford motors is less as compare to Apple Inc. which means, Ford motors has less capacity
to pay its operating expenditures as compare to Apple Inc (Apple Inc., 2016). NASDAQ is more
effectively operates the business.
Ratio Analysis of Ford Motors
Ratio Analysis of Ford
Motors
AUD in Million
2015 2016
Current Ratio Current Assets 102587 108461
Current Liabilities 82336 90281
1.25 1.20
Quick Ratio Quick Assets 12657 13503.5
Current Liabilities 82336 90281
0.15
(Net) Profit margin (a/b) Net Profit 7373 4596
Net Sales 151800 148558
5% 3%
Gross profit Margin Gross profit 27759 21974
tabler-icon-diamond-filled.svg

Paraphrase This Document

Need a fresh take? Get an instant paraphrase of this document with our AI Paraphraser
Document Page
FINANCE 4
Net sales 151800 148558
18% 15%
Asset turnover Revenue 151800 148558
Average Assets 219216.5 231438
0.69 0.64
Inventory turnover COGS 124041 126584
Inventory 8319 8898
14.9 14.2
Strength
Ford Motors has strong brand image in the market. It means the ability of the company to
generate the profit has been decreases. As per the liquidity position, it is observed that the
company current ratio has been decreases due to which its capacity to pay the short term
expenses has been increases (Ford Motors, 2016).
Weaknesses
As per the above ratio analysis of Ford Motors, it has been seen that the net profit margin
of the company has been decreases from 2015 to 2016 by 5% to 3% (Ford Motors, 2015).
Ratio Analysis of Apple
AUD in Million
Document Page
FINANCE 5
2015 2016
Current Ratio Current Assets 89378 106869
Current Liabilities 80610 79006
1.11 1.35
Quick Ratio Quick Assets 37969 36238
Current Liabilities 80610 79006
0.47 0.46
(Net) Profit margin (a/b) Net Profit 53394 45687
Net Sales 233715 215639
23% 21%
Gross profit Margin Gross profit 93626.00 84263.00
Net sales
233715.0
0
215639.0
0
40% 39%
Asset turnover Revenue 233715 215639
Average Assets 261092 306015.5
0.90 0.70
Inventory turnover COGS 140089 131376
Inventory 2349 2132
59.6 61.6
Document Page
FINANCE 6
Strength
Apple Inc. is a leading electronic company in the world. It is evaluated that the company
has strong liquidity position as it has high amount of current assets as compare to current
liabilities from which it can pay the short term expenses. The net profit margin of the company
has been decreases but it has strong capacity to generate the net income (APPLE INC, 2015).
Weaknesses
It has been determined that the company sells its inventory in more days means it take
more time to sell to the consumers. It is not beneficial for the company as its revenue has been
decreases (APPLE INC, 2015).
tabler-icon-diamond-filled.svg

Paraphrase This Document

Need a fresh take? Get an instant paraphrase of this document with our AI Paraphraser
Document Page
FINANCE 7
References
APPLE INC. (2015). Form 10-K. Retrieved From:
http://www.annualreports.com/HostedData/AnnualReportArchive/a/NASDAQ_AAPL_2
015.pdf
APPLE INC. (2016). Form 10-K. Retrieved From:
http://www.annualreports.com/HostedData/AnnualReportArchive/a/NASDAQ_AAPL_2
016.pdf
Daily Fx. (2018). Nasdaq vs NYSE: Top 7 Differences Traders Should Know. Retrieved From:
https://www.dailyfx.com/nas-100/NASDAQ-vs-NYSE.html
Ford Motors. (2016). Annual Report 2016. Retrieved From:
http://www.annualreports.com/HostedData/AnnualReportArchive/f/NYSE_F_2016.pdf
Ford Motors. (2015). Annual Report 2015. Retrieved From:
http://www.annualreports.com/HostedData/AnnualReportArchive/f/NYSE_F_2015.pdf
chevron_up_icon
1 out of 8
circle_padding
hide_on_mobile
zoom_out_icon
[object Object]