Analyzing Australian Stock Market Data: Stock Price Prediction Project

Verified

Added on  2022/12/27

|17
|2817
|54
Project
AI Summary
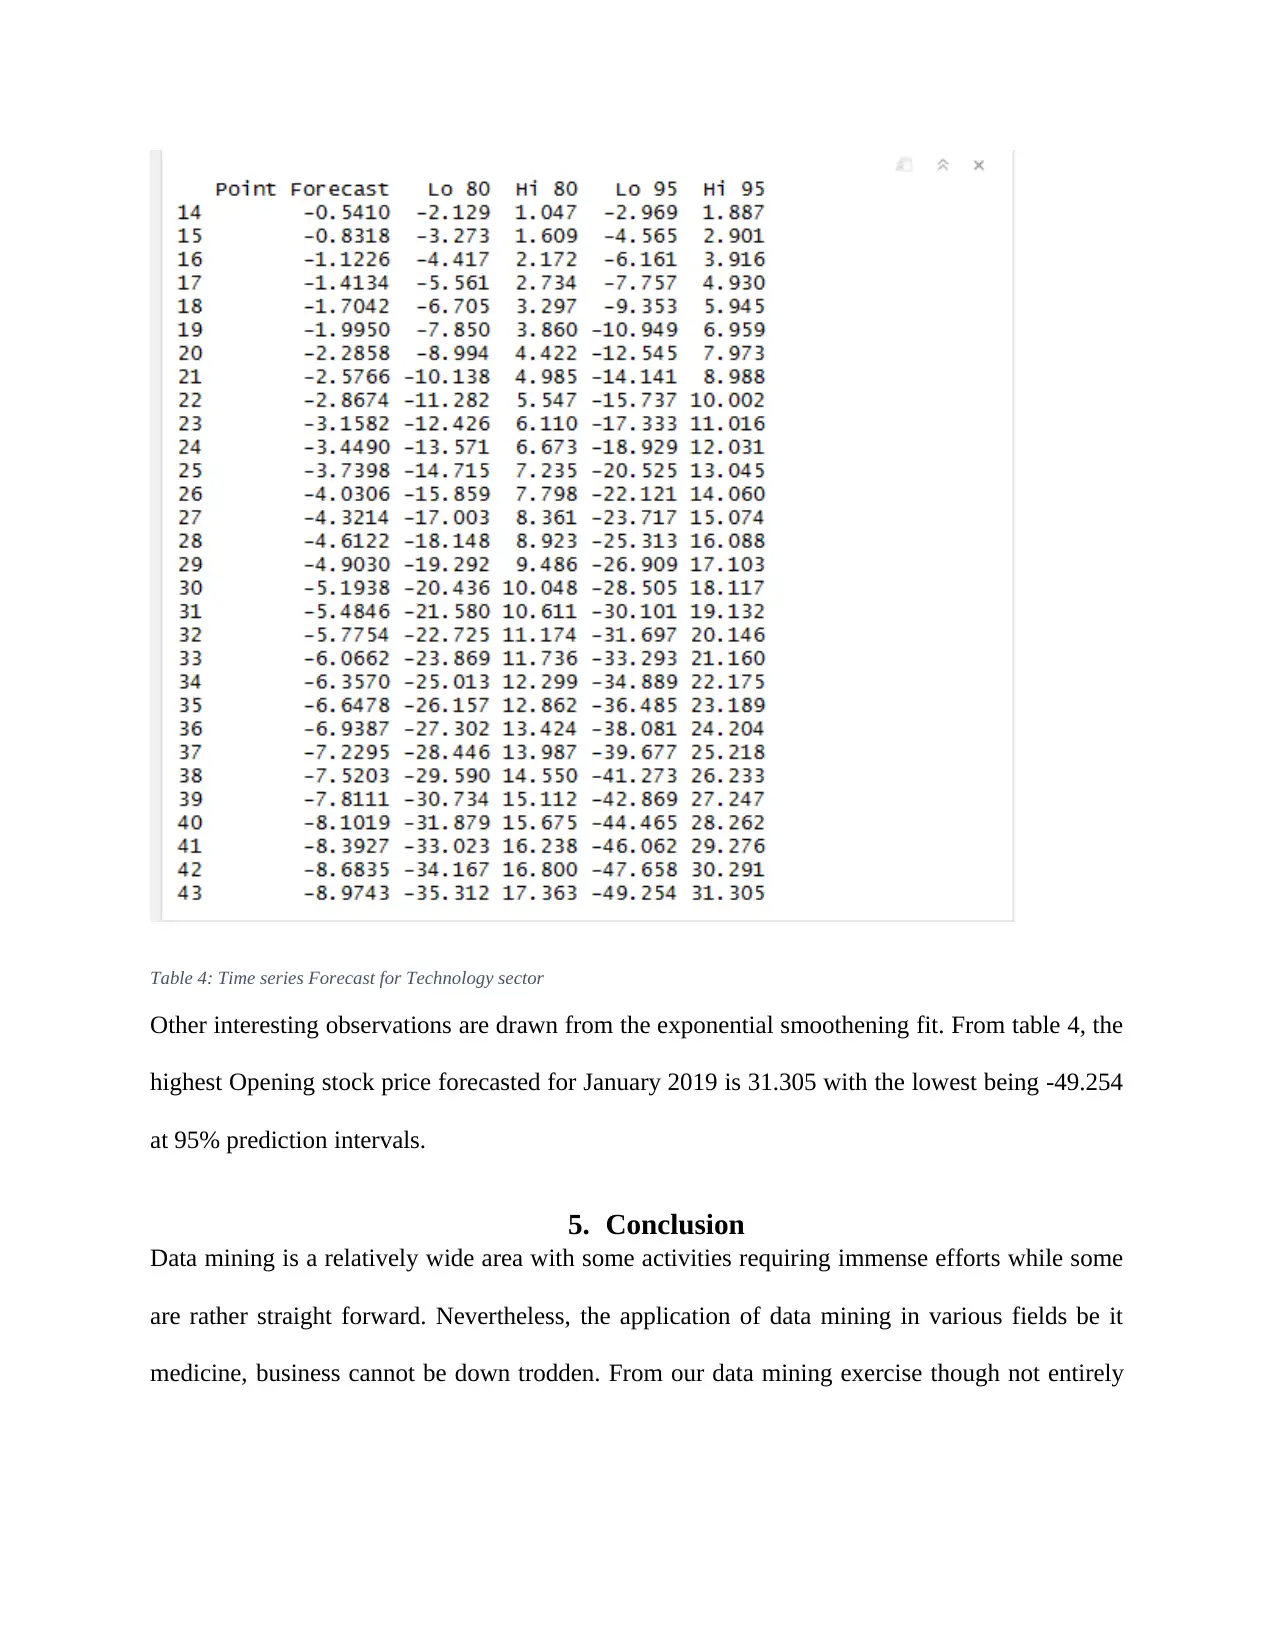
This project conducts a comprehensive analysis of the Australian stock market using data mining techniques. The study focuses on predicting stock prices and understanding the factors that influence them, particularly within the technology sector. The methodology includes time series forecasting, multiple regression models, and LASSO regression to identify key variables influencing stock prices. The data, sourced from the Australian Stock Exchange market for the year 2018, encompasses various attributes such as opening, closing, high, and low prices. The results reveal that the closing price and the difference between the opening and closing prices of a stock are significant factors influencing the subsequent opening price. Furthermore, the project utilizes time series forecasting to predict future stock prices, providing insights for investors to make informed decisions. Data preprocessing techniques, including data cleaning and transformation, were applied to enhance data quality. The analysis concludes that multiple regression model is optimal for predicting stock prices, offering a high adjusted R-squared value, while also emphasizing the utility of forecasting in analyzing trends over time.
Document Page
1. Introduction
The question of a company’s financial and sustainability performance often draws a number of
explanations as well as concerns including: what the factors that influence such performance
might be or the measures with which these performances can be based on. In various studies,
both economic researchers and watchers tend to agree that stock prices play a key role in
influencing financial performance [1] with other studies indicating that the reverse might even be
true i.e. stock prices do actually influence financial performance as well. In a financial article,
the author notes, “…a company that is profiting from its product or service is more likely, but
not guaranteed, to see the price of shares of company stock rise” [2].
Of importance to the company in such regards is the ability to determine what kind of
relationship exists between such factors as stock prices and volumes of stocks purchased while to
the individual investors the need to determine which company or industry to invest on that offers
promise of more returns will greatly influence their willingness to invest in such ventures [3].
1.1Stock and profitability
Changes in stock prices are influenced by demand and supply. This means, that the higher the
demand, the higher the price and the higher the supply with lower demand then the stock prices
fall. Ideally, demand of stock rises whenever there is a prospect of profitability and fall when this
prospect is low or the market is not performing well; in which cases the supply surpasses the
demand.
1.2Data mining
Investment in sound business opportunities is the dream of every investor who is willing to place
their hard earned money into the hands of companies in which they have no part in the day to
tabler-icon-diamond-filled.svg

Paraphrase This Document

Need a fresh take? Get an instant paraphrase of this document with our AI Paraphraser
Document Page
day activities. Nevertheless, telling what lies ahead is beyond the scope of any average human
being no matter how wealthy or averagely wealthy they might be. In such cases, it is therefore
prudent to include measures that will enable the use of past information i.e. historical data so as
to per into what the future might look like. This however will basically require the use of
statistics hence data mining.
In computing, data mining is the process of conducting the extraction of useful data from raw
data through analyses so as to discover new information. As such, data mining can be split into
predictive and descriptive data mining [4]. The main role among many of data mining is to
enable an analyst to draw information and predict what the likely outcomes of a given aspect of
data might be so as to facilitate the process of decision making [5]. Data mining is thus
applicable to a number of domains such as market analysis and management, corporate analyses
as well as risk management.
1.2.1 Efficient market hypothesis and the random walk
In market analysis, the efficient market hypothesis supposes that all stock prices are functions of
information with rational expectations, therefore any new information on a firm’s prospective
tend to be reflected in the company’s stock. Conversely, variations in stock prices reflect
introduction of new information [6].
1.2.2 Study objective and Questions
Most of the studies conducted which involve stock and company analyses seek to determine
which company is more profitable with fewer researches being conducted with regard of which
industry is more profitable to invest in. This study conducts an analysis of the relationship
between stock prices, stock volume and the technology sector as listed in the Australian Stock
Exchange market. The aim, is to determine what is the relationship between stock price and other
Document Page
variables in the dataset. To achieve these objectives, we will derive ways in which to answer the
question: what factors influence the opening stock price?
Document Page
2. Data
Data used in this study is obtained from https://quotes.wsj.com/company-list/country/australia to
include companies listed in the Australian stock exchange market. It includes information on
both the sector i.e. industry and subsector in which the featured company is categorized.
Information contained in the dataset include: the featured company’s code, sector (including
industries such as technology, Agriculture, etc.), subsector (such as Internet/Online under
technology industry and farming under agriculture industry etc.). The data was is drawn from a
population of firms listed in the Australian stock market for the year 2018 alone.
Other attributes contained in the dataset are: Date (when the prices are quoted), Open (opening
price for the stock on a particular day), High (the highest quoted price), Low (lowest quoted
price), Close (closing price of a stock on a particular day), High-Low (difference between the
highest quoted price of a stock and the lowest), HMLOL (obtained through dividing High-Low
by the lowest quoted price of the day), and PriorClose (the closing price of a stock on the
preceding day). In general, the dataset contains 20 variables with 31403 observations on the
activities of the Australian stock exchange market for the Year 2018.
tabler-icon-diamond-filled.svg

Paraphrase This Document

Need a fresh take? Get an instant paraphrase of this document with our AI Paraphraser
Document Page
3. Methods
Several algorithms have been proposed for application in statistical scenarios requiring data
mining; each with its individual strengths with respect to a specific domain [7]. Such algorithms
are:
i. Time series forecasting
ii. Cluster analysis
iii. Regression analyses
iv. Association rules
v. Decision trees
vi. Support Vector machines
However, in our methodology and analysis we will explore two predictive models i.e. Ordinary
least square regression and a LASSO regression. Most of the variables in the dataset are
continuous therefore data mining methods such as association rule might not be suitable hence
we chose predictive and forecasting data mining algorithms.
3.1Time series forecasting
Part of the study objective is to conduct prediction so as to determine what future stock prices
might be given historical data. In this respect, time series forecasting will suffice since it mainly
concerns itself with analysis of time series data such as the one provided in the study [8]. In time
series analysis, a forecast is given by:
Document Page
Where: yˆn+h|n = yn. and h is the forecast periods i.e. an year , a week, etcetera.
Since the obtained data is ofrom a time series, use of a time series forecasting method as a data
mining technique is justified in the sense that, it will help in forecasting the change in opening
stock prices.
3.2Multiple regression model
Multiple linear regression models are used in the estimation of real values such as cost of
houses, number of calls, stock prices etcetera and are based on continuous variables [9]. The
general model of regression model is:
y = β 0 + β1 x 1 + β2 x 2 + ···β k x k + £I, where: β0, β1, β2, ..., βk are regression coefficients, and Xi are
the independent variables which are to be replaced by explanatory variables in the dataset.
Lasso regression
A LASSO is a regularized regression implying that, it grants control over regression coefficients
as noted by [10, p. 33]. Generally, LASSO (a Least Absolute Shrinkage and Selection Operator)
uses the penalty: λ
j=1
p
¿ β ¿ ¿ alongside an objective function: minimize {SSE + λ
j=1
p
¿ β ¿ ¿}.
It differs from ridge regression, since it drives the regression variables near zero however not to
zero thus improving the model while conducting feature selection [11, pp. 24-26]. Hence, from
Document Page
the introduction on LASSO models, we define its form i.e.: LS Obj + λ (sum of the absolute
values of coefficients).
In data mining, a LASSO regression model’s lies ability to deal take care of any overfitting
problem is among its key strengths unlike Ordinary Least Squares model [12, pp. 50-61] which
might overfit the variables.
Specifically, we choose a LASSO regerssion model which is a variant of the regression model
except that it is a penalized model i.e. it drives the regression variables near zero however not to
zero as noted above.
3.3Data preprocessing
Before conducting any analysis, we conduct several preprocessing activities aimed at improving
the quality of the data. The preprocessing techniques applied to the raw data include: data
cleaning i.e. dealing with missing data and outliers, data transformation i.e. scaling and
normalization. Some variables such as year, month, are dropped from the dataset and define the
date format for the “Date” column in Microsoft excel ™ before importing it to the R-statistical
software. Further, we select a subset of the data to include only entries from technology sector in
the final dataset.
tabler-icon-diamond-filled.svg

Paraphrase This Document

Need a fresh take? Get an instant paraphrase of this document with our AI Paraphraser
Document Page
4. Results
4.1Descriptive
Table 1
Table presents the summary statistics for some of the relevant variables in which for the year
2018 approximately 21736 stock prices went up with 9666 dropping. We note further that there
are 7820 entries from technology sectors, 7692 from Basic materials/resources, 5560 from
business/consumer services, 3534 from financial services, Agricultural entries totaled up to 3280
while retail/wholesale and “other” industries had 1771 and 1745 stock entries. This implies that
the technology sector was the most quoted in the Australian stock market in the year 2018.
4.2Predictive
Linear and LASSO regression
Our data mining linear model is defined in such a way that it seeks to determine the factors that
influence a subsequent opening price of the stock.
Document Page
Table 2: regression results
From table two, at 95% confidence interval, the model is significant with a p-value of 0.000.
When examining the significance of individual variables in predicting the Opening stock price,
only the Close and Close.Open variables have a p-value for the t-test being lower than 0.05. In
comparison with the LASSO regression model which was implemented in the analysis, the
multiple regression model accounts for a higher percentage of variation in the model which is up
to 1% compared to the 96.75 obtained by the LASSO. Further, the LASSO regression results
indicate that only “High” and “Low” variables are responsible for predicting the Opening stock
price (Appendix 1).
Document Page
The graph above shows the mean squared error of the LASSO regression model. Which is
approximately 1.3and decreases with decrease in the number of variables in the model.
Table 3: Mean squared Error
Time Series
The time series model was used to analyze the opening stock price of firms in the Technology
sector.
tabler-icon-diamond-filled.svg

Paraphrase This Document

Need a fresh take? Get an instant paraphrase of this document with our AI Paraphraser
Document Page
Table 4: Time series Forecast for Technology sector
Other interesting observations are drawn from the exponential smoothening fit. From table 4, the
highest Opening stock price forecasted for January 2019 is 31.305 with the lowest being -49.254
at 95% prediction intervals.
5. Conclusion
Data mining is a relatively wide area with some activities requiring immense efforts while some
are rather straight forward. Nevertheless, the application of data mining in various fields be it
medicine, business cannot be down trodden. From our data mining exercise though not entirely
Document Page
exhaustive of all the information hidden in the dataset, opens us up to a wider perspective of
what can be achieved from analysis of stock market.
First, let’s address our original research objective through answering out question, “what factors
influence the opening stock price?” Different models gave different results. However, through
use of the performance metrics set for the models, we adopt the multiple regression model as the
most optimal given its high adjusted R-Squared statistic which accounts for 100% of variability
in the data. As such, from the regression model we note that the factors influencing the
subsequent opening price of a stock is both the closing price and the functions of the closing
stock i.e. the price of the stock at the opening of the previous trading period subtract the closing
price of the stock in the close of the trading period.
In addition, forecasting is a useful model when it comes to analyzing the change of an attribute
with respect to time. For instance, the use of forecasting enabled us to forecast the opening stock
price for the trading month January. Through use of such information, the investor can therefore
make sound decisions as to what factors to consider when investing and in which industry are the
returns most likely to be high. Based on our results, an investor should consider the highest
opening stock price of a firm as well as the trend of the previous opening stocks before
considering an investment.
5.1Future work
The scope of this paper might not have conducted a comparison on the trend of stock prices in
different sectors. These time series trend analyses should be considered for future work since it
will be helpful to both investors who might want to know which industry is the most suitable
chevron_up_icon
1 out of 17
circle_padding
hide_on_mobile
zoom_out_icon
[object Object]