Applied Management Statistics: Stock Market Analysis - BCO127
VerifiedAdded on 2022/08/29
|10
|595
|19
Homework Assignment
AI Summary
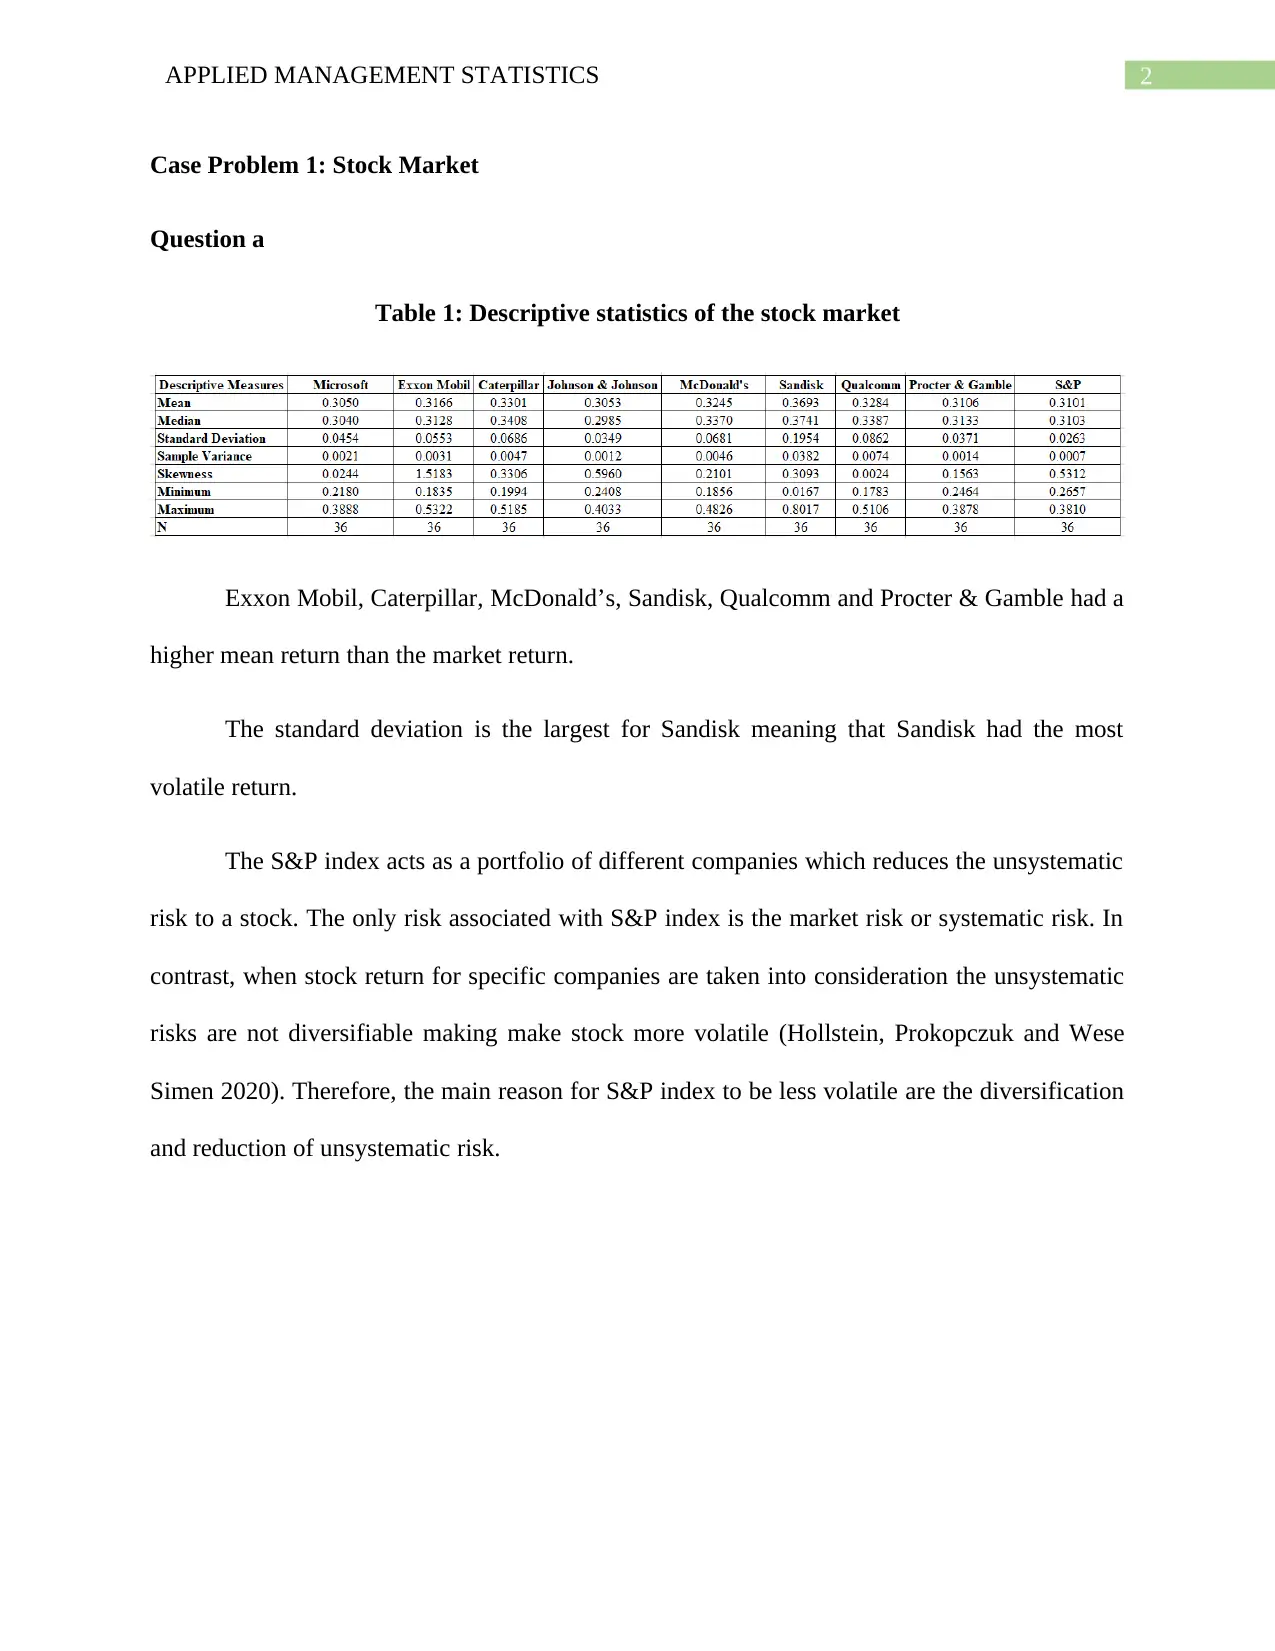
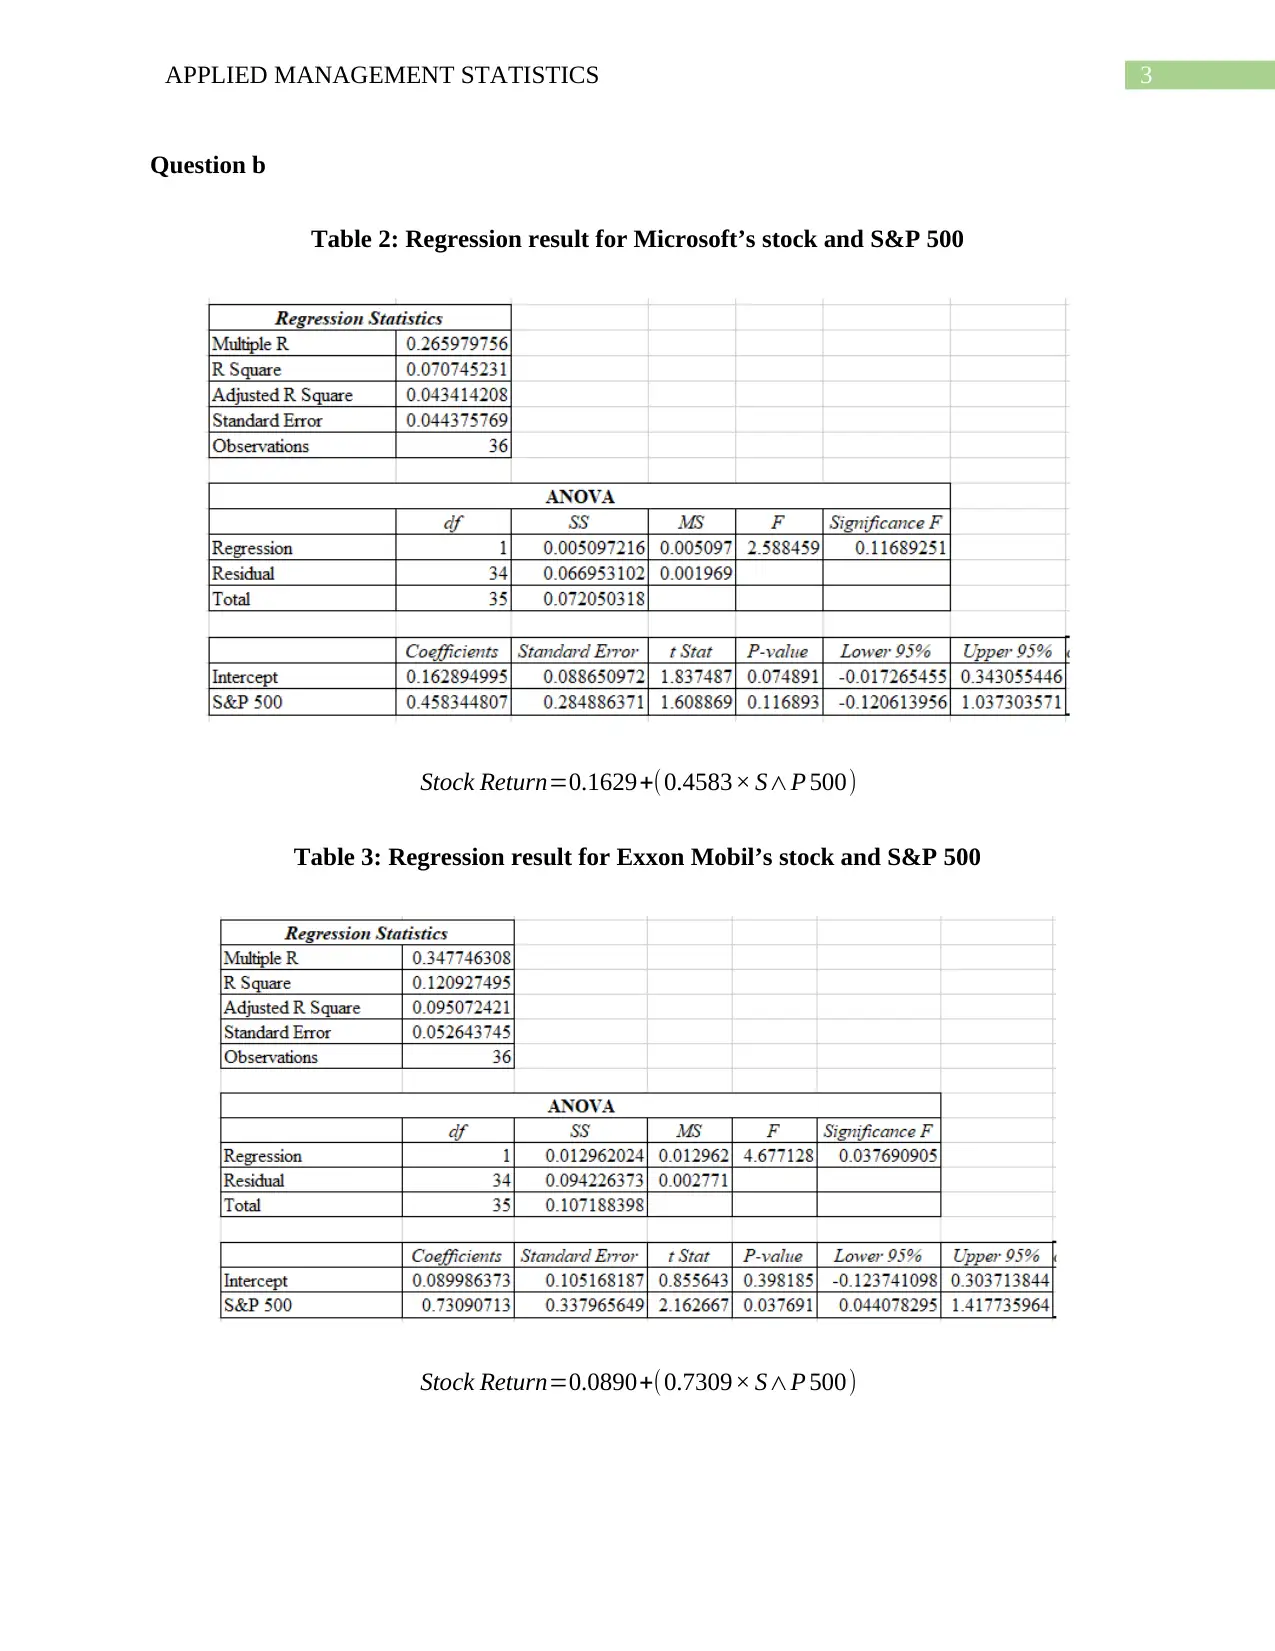
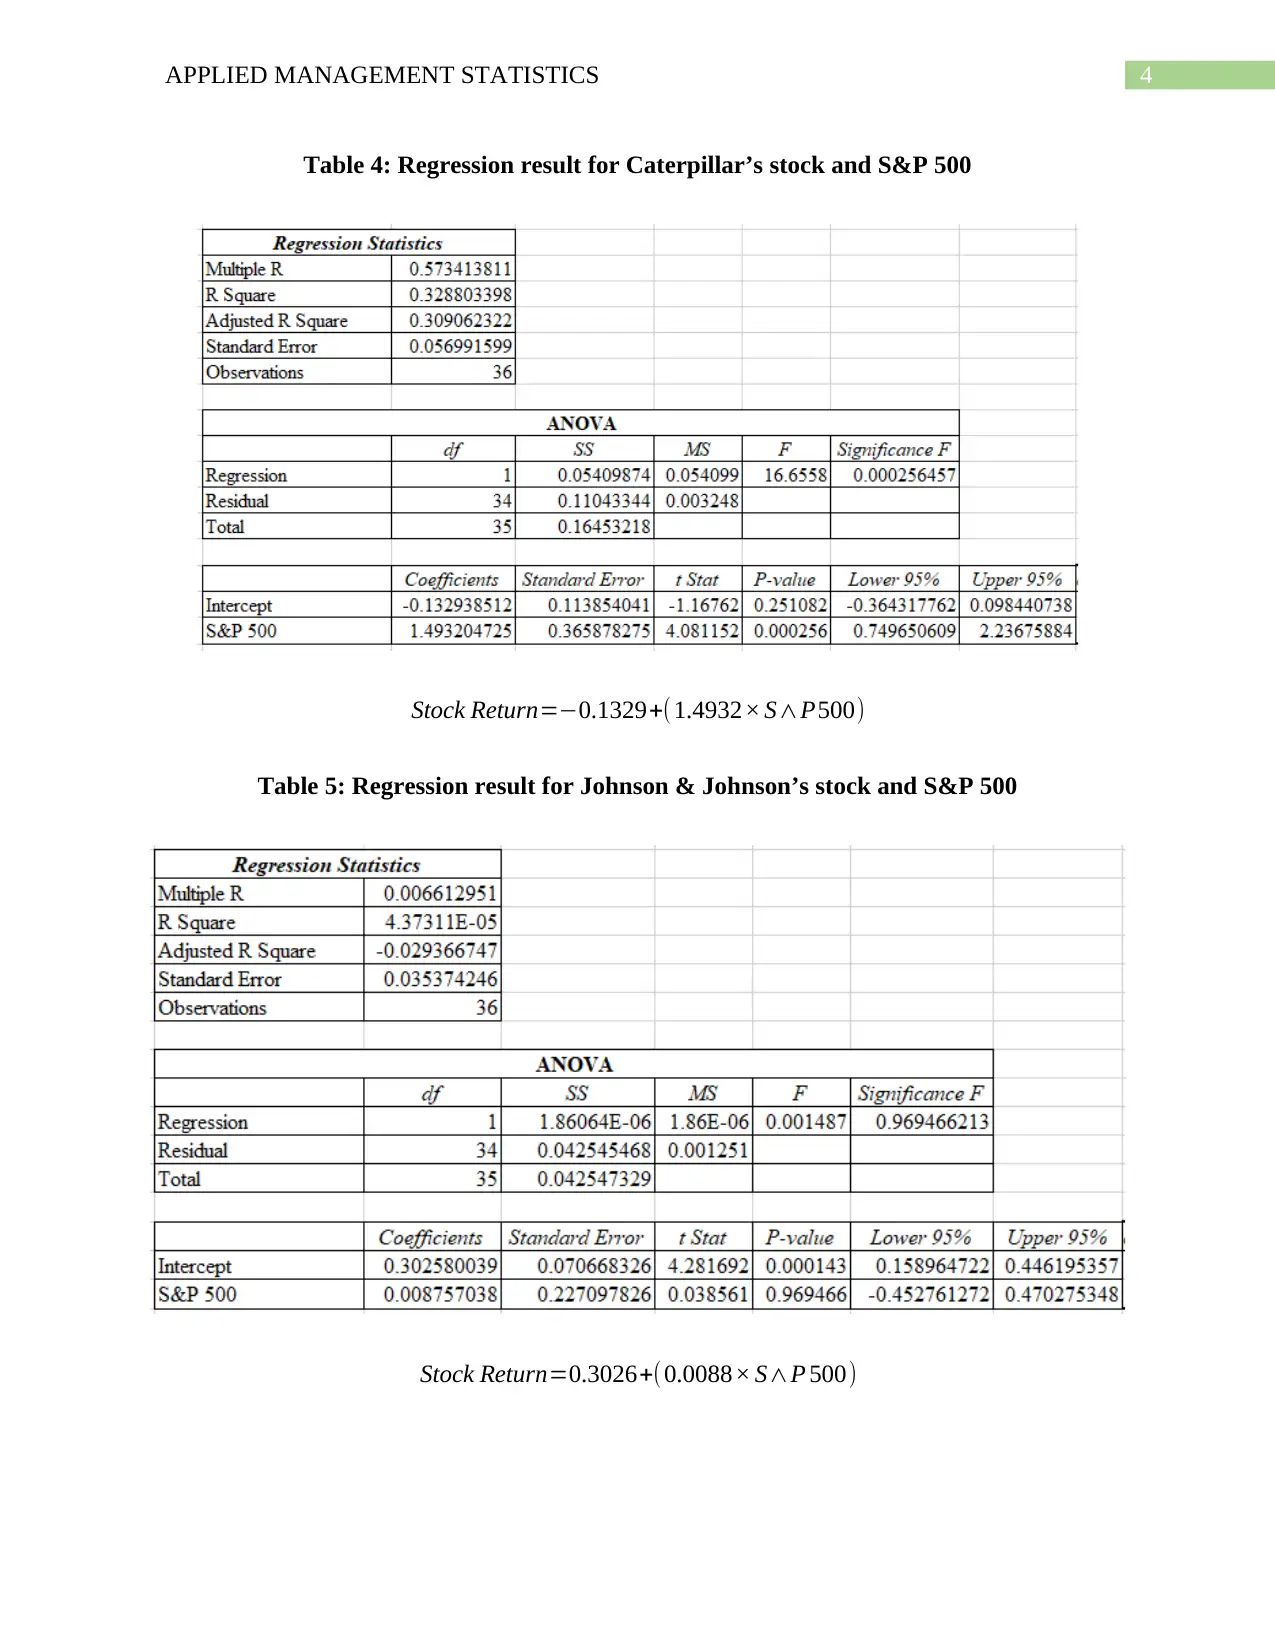
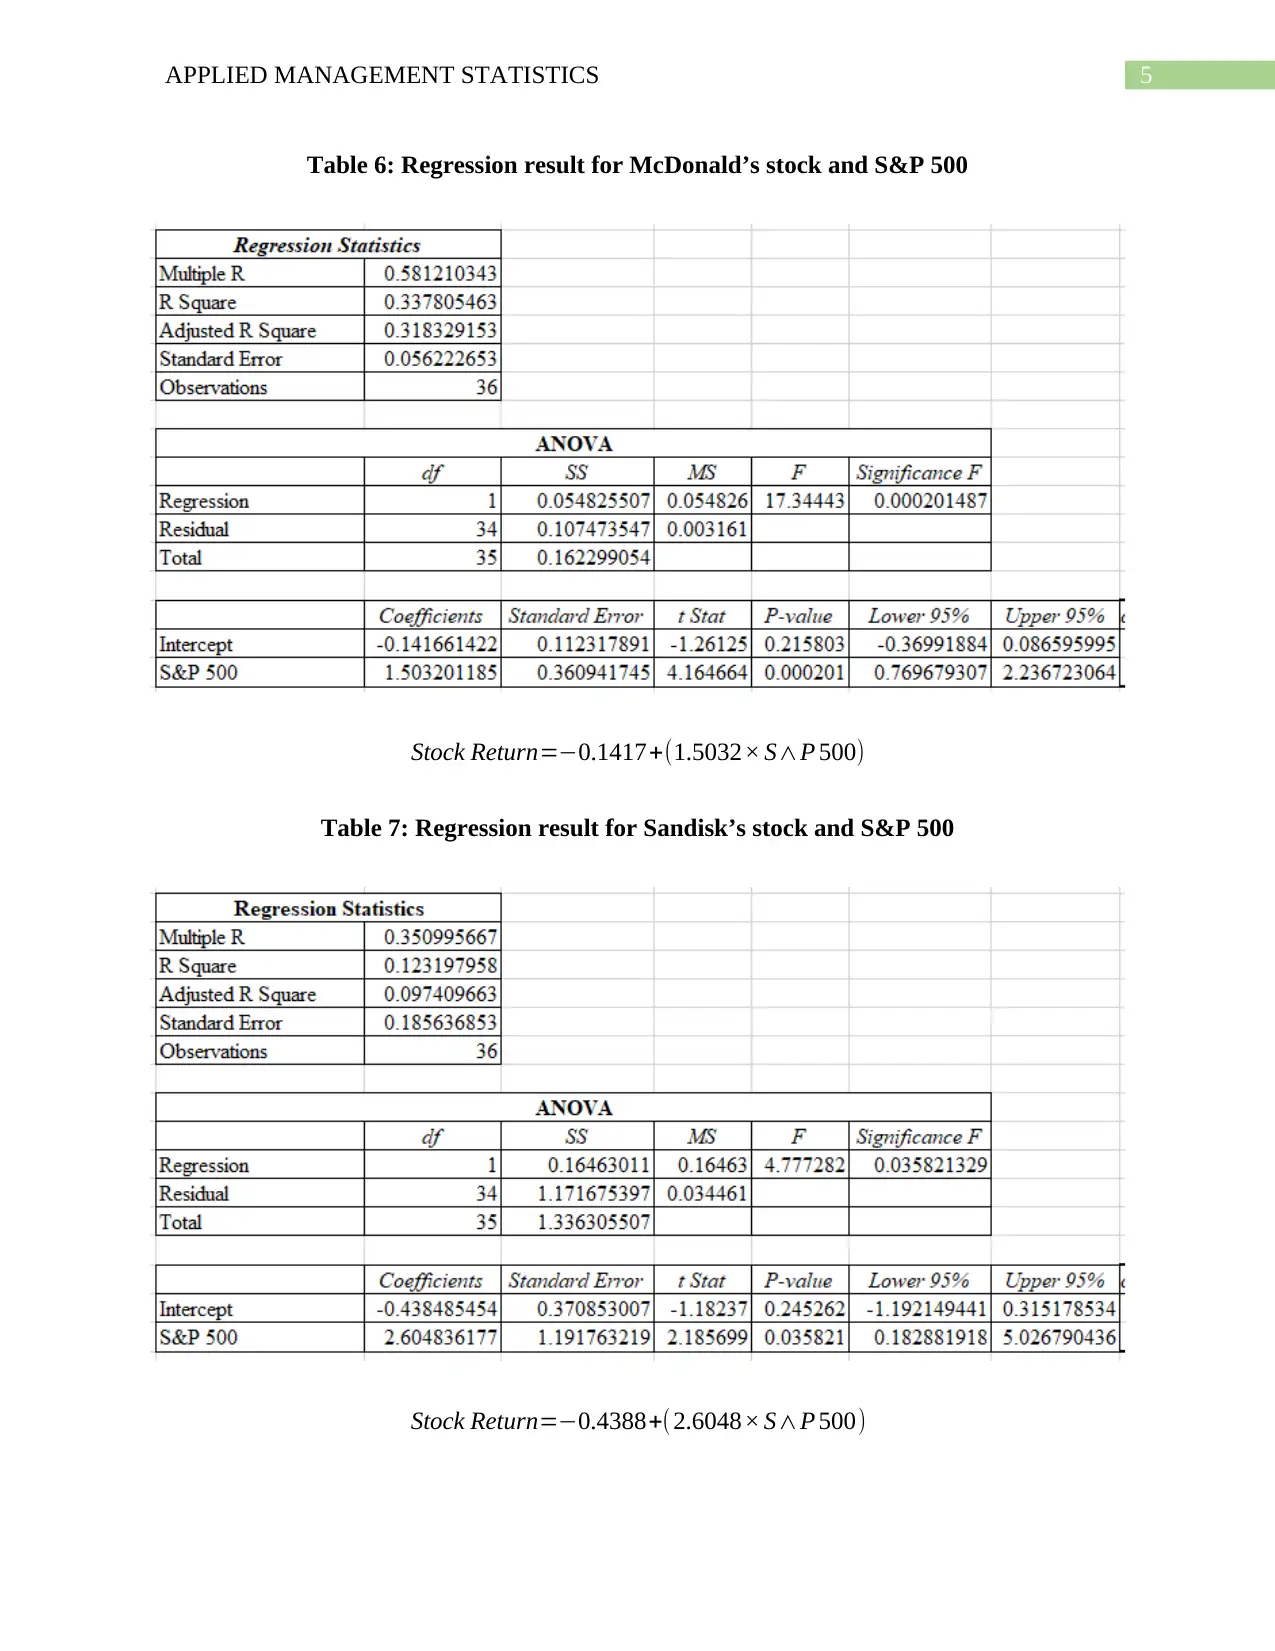
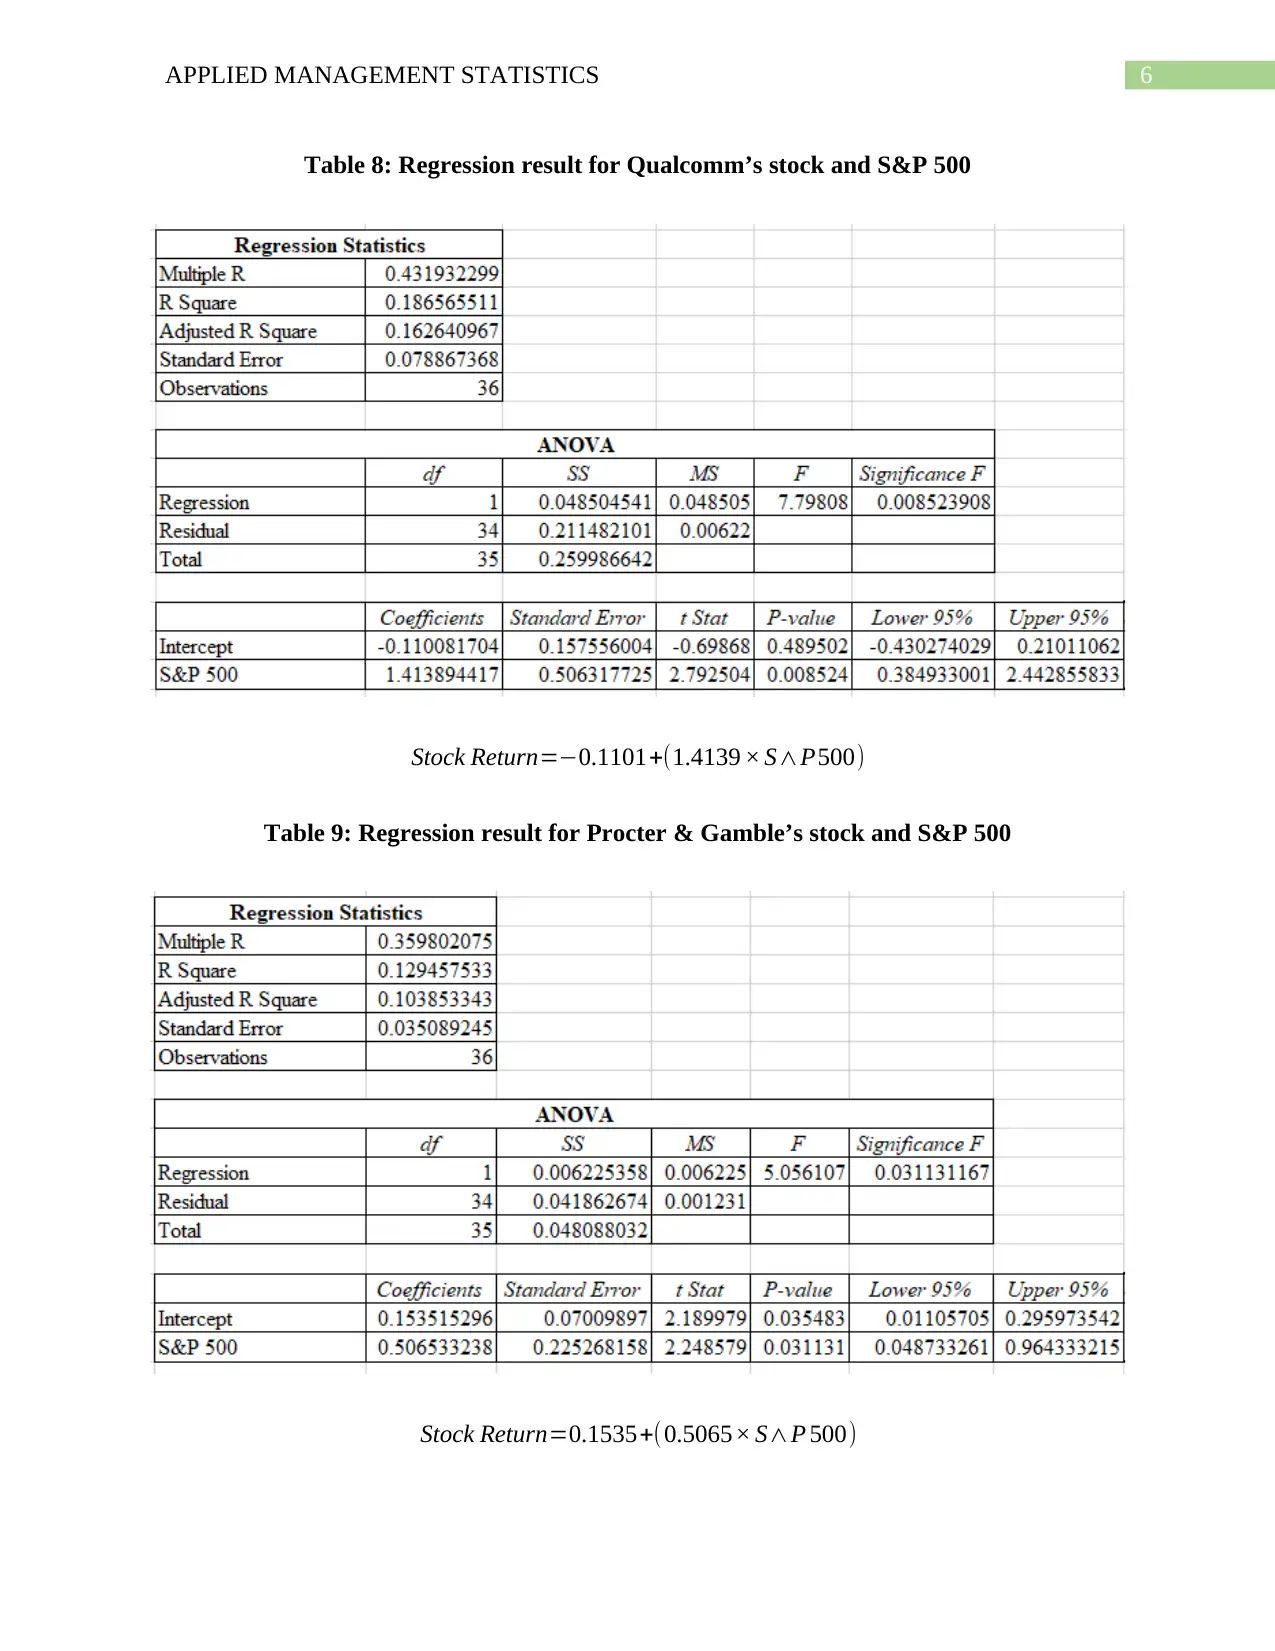
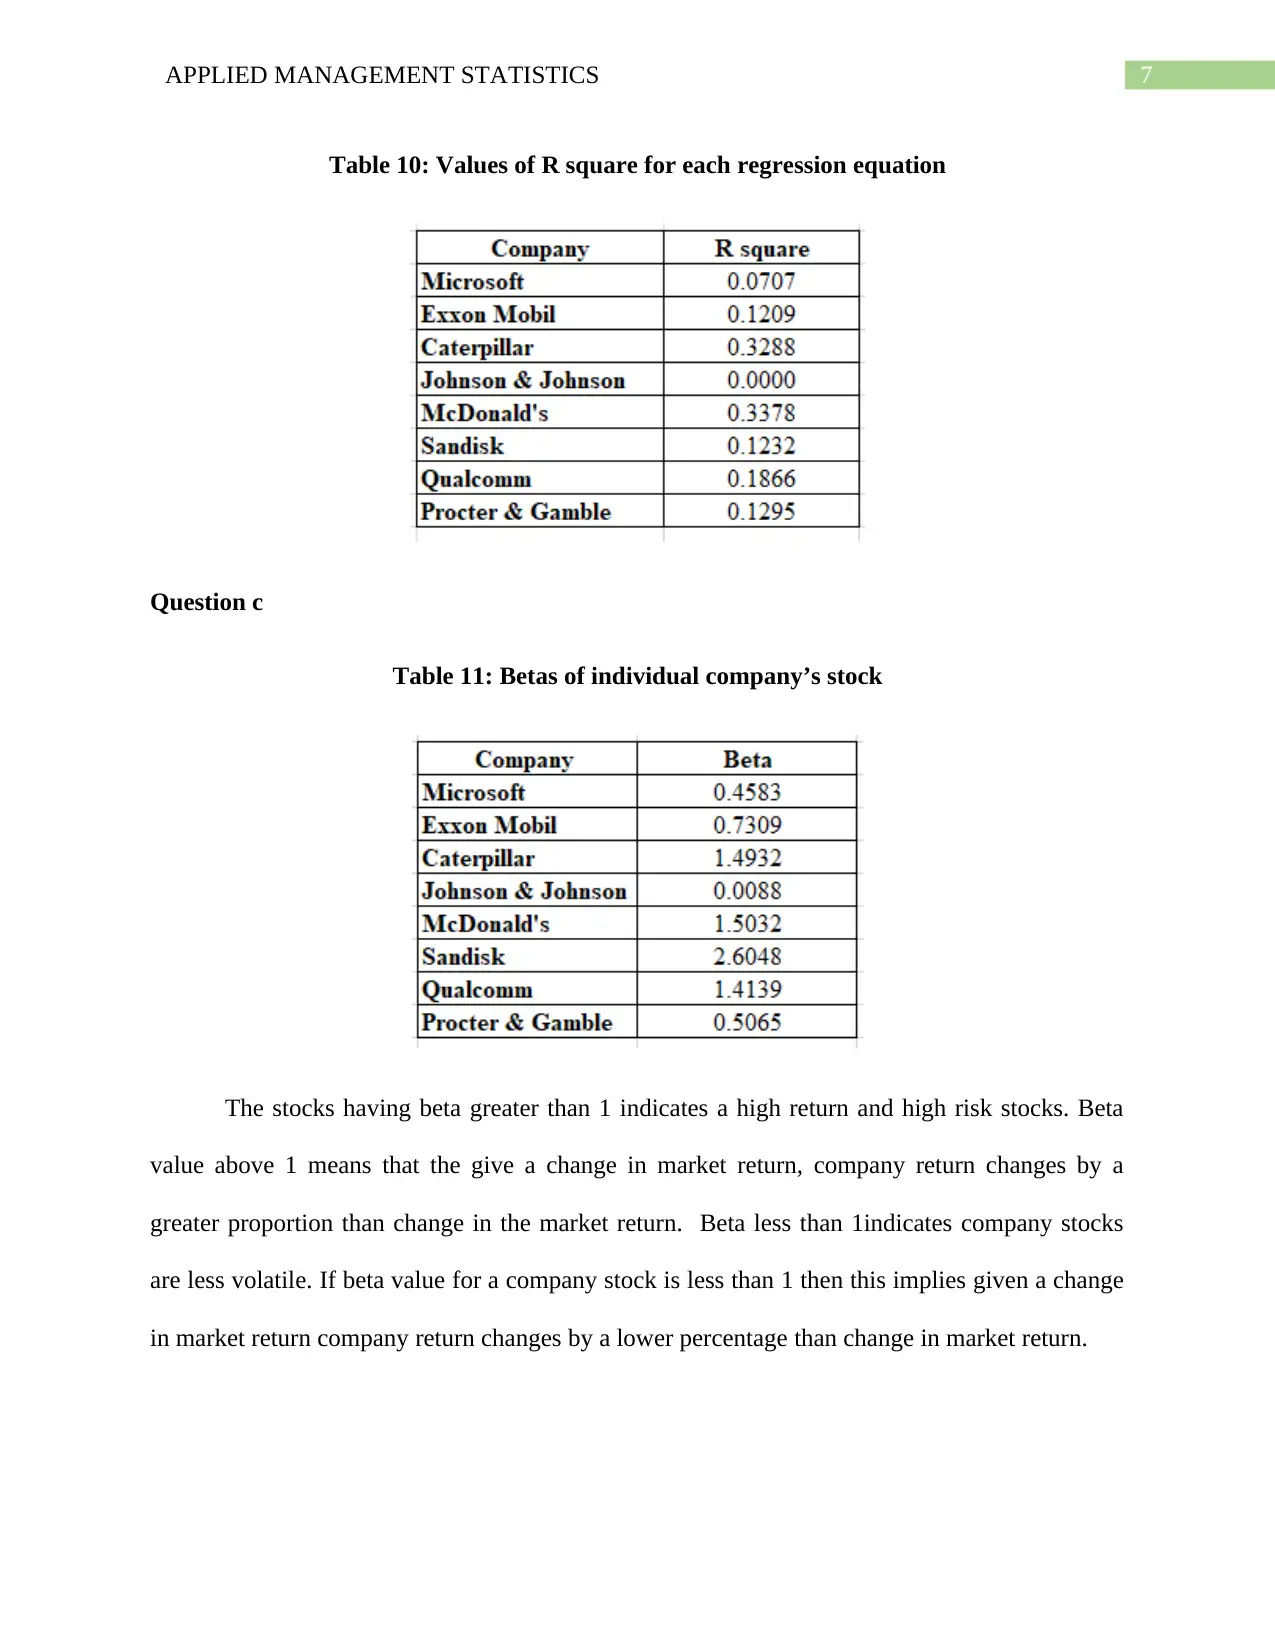
This assignment solution provides a comprehensive analysis of stock market data using statistical methods. It begins with descriptive statistics for various stocks (Exxon Mobil, Caterpillar, McDonald’s, Sandisk, Qualcomm, and Procter & Gamble) and the S&P 500, comparing their mean returns and volatility. The solution explains why the S&P 500 is less volatile due to diversification. It then presents regression results for each stock against the S&P 500, including R-squared values. The assignment further calculates and interprets the beta values for each stock, explaining the implications of beta values greater than and less than 1, and identifying which stocks benefit most from an up market. The R-squared values are explained in terms of the proportion of variation in a company's stock return explained by market return. References to relevant academic papers are also included. The assignment demonstrates a practical application of statistical concepts in financial analysis, addressing the key aspects of the assignment brief and providing a complete and well-structured response.
1 out of 10
Related Documents


Your All-in-One AI-Powered Toolkit for Academic Success.
+13062052269
info@desklib.com
Available 24*7 on WhatsApp / Email
![[object Object]](/_next/static/media/star-bottom.7253800d.svg)
Copyright © 2020–2026 A2Z Services. All Rights Reserved. Developed and managed by ZUCOL.