ISCG 8026 Data Science: Stock Market Analysis and SBI Share Price
VerifiedAdded on 2023/06/03
|20
|4044
|458
Report
AI Summary
This report provides a comprehensive analysis of the stock market, focusing on identifying trends in stock share prices to provide informed advice to investors. Using data from the State Bank of India (SBI), the study examines the relationship between stock prices and performance, high and low prices, and open and current trading prices. The research employs various methodologies, including simple moving average (SMA), Relative Strength Index (RSI), Rate of Change (ROC), correlation coefficient, and regression analysis, to analyze the data and draw conclusions about stock market behavior. The findings aim to assist financial institutions, corporations, and individual investors in understanding stock price trends and making informed investment decisions, while also contributing to the existing body of knowledge in finance and economics. Desklib offers similar solved assignments and resources for students.

STOCK MARKET ANALYSIS
SPECIAL TOPIC - INTRODUCTION TO DATA SCIENCE
ISCG 8026
SUBMITTED BY
Rajavarman Ariyaputhiran Ponnumani : 1500059
SPECIAL TOPIC - INTRODUCTION TO DATA SCIENCE
ISCG 8026
SUBMITTED BY
Rajavarman Ariyaputhiran Ponnumani : 1500059
Paraphrase This Document
Need a fresh take? Get an instant paraphrase of this document with our AI Paraphraser
Table of Contents
Introduction.................................................................................................................................................2
Research objectives.....................................................................................................................................3
Significance of the research.........................................................................................................................4
Literature review.........................................................................................................................................5
Interval........................................................................................................................................................6
Tick prices....................................................................................................................................................6
High price................................................................................................................................................6
Low price.................................................................................................................................................6
Open price...............................................................................................................................................7
Close price...............................................................................................................................................7
Trend.......................................................................................................................................................7
Research methodology................................................................................................................................9
The simple moving average (SMA)..........................................................................................................9
Relative Strength Index (RSI).................................................................................................................10
Rate of Change (ROC)............................................................................................................................10
Correlation coefficient...........................................................................................................................11
Regression analysis................................................................................................................................12
Data presentation..................................................................................................................................12
Data analysis..........................................................................................................................................12
Results.......................................................................................................................................................13
Univariate analysis on stock market for SBI...........................................................................................13
Findings from simple moving average...............................................................................................14
Bivariate analysis...................................................................................................................................14
Correlation.........................................................................................................................................14
Regression.........................................................................................................................................14
Limitations.................................................................................................................................................15
Conclusion.................................................................................................................................................16
References.................................................................................................................................................17
Introduction
The stock market has become a major source of great economic investment. The stock market
has become a vital part of the free market economy [1]. Several indicators are used to assess
stock market performance. Millions of investors make decisions every day that impact on the
stock market.
Returns from such equity investments are subject to vary thanks to the movement of share costs,
that rely on varied factors that might be internal or firm specific like earnings per share,
dividends and value or external factors like rate, Gross Domestic Product (GDP), inflation,
government rules and exchange Rate (FOREX).
The indicators of performance of a stock market include capitalization, liquidity and stock prices.
Capitalization indicates the total market value of all shares that are registered as well as traded at
the stock exchange. It is a product of the prevailing stock prices and number of shares issued by
quoted companies. The capitalization therefore moves with changes in share prices. Liquidity
refers to the extent to which the stock market allows trading of securities at stable prices whereas
stock prices refer to the prevailing market prices for securities driven by the forces of supply and
demand [2].
Stock analysis is an important aspect for informing decisions on stock market investments. Stock
analysis as defined by Roberts H.V. [3] refers to the evaluation of a particular trading instrument.
Stock analysis attempts to determine the future trends of stock market instruments like share
price. Investors depend on stock market analysis in order to make informed judgments on
whether and/or what amounts of their income to invest in the stock market [4].
⊘ This is a preview!⊘
Do you want full access?
Subscribe today to unlock all pages.
Trusted by 1+ million students worldwide

Transitions between rising and falling trends in stock markets are normally represented by price
patterns [5]. It is important to understand price movements in the stock market. Stock market
investments are determined by future price movements based on past and present price
movements.
The study sought to establish the determinants of stock market performance and used stock
prices as the indicator to be examined.
For cases of this research, we studied the trends of the State Bank of India (SBI) share price.
Trends in the share price movements were observed and recorded for purposes of making future
price forecasts.
Research objectives
The main aim of this research was to identify trends in stock share prices in order to provide
informed advice to stock markets.
The performance of the securities market in any country could be a robust indicator of general
economic performance and is an important part of the economy. With the introduction of free
and open economic policies and advanced technologies, investors are obtaining easy accessibility
to security markets round the world. The very fact that securities market indices became a sign of
the wellbeing of the economy of a rustic indicates the importance of stock markets. This
increasing significance of the securities market has actuated the formulation of the many theories
to explain the operating of the stock markets.
For purposes of this research, we shall therefore aim to analyze the effect of past and current
share prices on future stock share prices. Price analysis will help depict the overall stock market
Paraphrase This Document
Need a fresh take? Get an instant paraphrase of this document with our AI Paraphraser

performance. By processing historical price data of stocks, it is easy to anticipate how that stock
will be traded.
Research questions
The following research questions shall be used to guide us through the research study;
i) What is the relationship between stock prices and stock performance?
ii) What is the relationship between stock high prices and low prices?
iii) What is the relationship between stock open prices at given intervals and the current
trading prices at such intervals?
Hypotheses
The following hypotheses were formulated in order to answer the above research questions.
i) H0: Stock prices are not indicators of stock performance.
H1: Stock prices are indicators of stock performance.
ii) H0: Stock high prices are not predictive of stock low prices.
H1: Stock high prices are predictive of stock low prices.
iii) H0: Stock open prices are not predictive of stock current trading prices at given
intervals.
H1: Stock open prices are predictive of stock current trading prices at given intervals.
Significance of the research
The findings from this analysis can assist money establishments, corporations and individual
investors in understanding the trends of stock prices and that they are higher advised on the way

to gauge their investment choices whereas banks and different money establishments are able to
give better financial recommendations and products to investors who look for funding to finance
stock investments.
The results of this study would help stock markets and investors to make wise investment
decisions. Insight into how prices affect stock performance will help investors derive proper
valuations for their investments bearing in mind the price drivers.
Academicians and researchers can also benefit from the findings of this study because they will
use the findings as reference for future researches on stock markets price analysis.
The findings will also contribute to the existing body of knowledge in fields of finance and
economics.
⊘ This is a preview!⊘
Do you want full access?
Subscribe today to unlock all pages.
Trusted by 1+ million students worldwide

Literature review
This chapter examines the concepts and theories on stock price as an indicator of stock market
performance. It also lays out literatures from past researchers and scholars on stock market
performance.
Although common, the term stock market is being commonly confused with stock exchange.
Stock markets describe the totality of all stocks held within a country whereas stock exchange is
the entity of bringing together buyers and sellers to trade in stock [6].
In the past, buyers and sellers were individual investors but over time markets have become
institutionalized with individual sellers and buyers being replaced by institutions such as banks.
Shares of these institutions shall be traded in the stock exchange [7].
Existing literature has outlined that stock returns are partly predictable. Predictability of these
stock returns were shown to be attributed to past returns. Similarly, stock share prices can be
predicted by examining past share prices [8].
Stock markets greatly depend on share prices. The value of stock shares determines the amount
of investment that shall be made in the stocks [9]. A stock market achieves efficiency when stock
investments reflect the market share prices.
Market potency theory suggests that a market is rational and provides correct rating. That is,
these security prices square measure near to their elementary values owing to either the rational
investors or the arbitragers obtain and sell action of under-priced or over-priced stocks. It's
argued that in a potent economical market actual prices of individual securities already reflect the
consequences of information based mostly each on events that have already occurred and on
events that as of currently the market expects to occur in future. In different words, in an
Paraphrase This Document
Need a fresh take? Get an instant paraphrase of this document with our AI Paraphraser

efficient economical market at any instance in time the particular value of a security are going to
be a decent estimate of its inherent worth. On the contrary, determined market anomalies have a
challenge for this argument.
Market efficiency is a desirable aspect in the stock market [10]. Most of past work on market
efficiency relied on forecasting returns based on past returns. However, little research has been
done on establishing market efficiency by forecasting share prices based on past share prices.
The issue of relation between major economic variables and share returns over the years has
raised controversies among researchers owing to varying findings. On paper, major economic
variables are believed to have an effect on returns on equities. However over the years, the
determined pattern of the influence of macroeconomic variables (in signs and magnitude) on
share returns varies from one study to a different in several stock markets.
In this research, we shall try to establish relationships between share prices and stock returns.
For purposes of this research we review the following key terms;
Interval
Interval refers to the time periods within which trades take place. Intervals can be intra-day,
daily, weekly, monthly or annually. Interval helps investors know when is the optimal time to
either buy or sell stock.
Tick prices
At each stock interval, stock will have four price types related to the interval; high price, low
price, open price and close price.
High price
High price is the highest value at which stock was traded at in a particular interval.

Low price
Low price refers to the lowest price at which certain stock was traded at in a particular interval.
Open price
This refers to the price at which stock trade took at in a particular interval.
Close price
This refers to the price at which stock was last traded at in a particular interval.
Trend
Trend refers to the general direction in which stock parameters change. At any instantaneous
moment, stock can either have higher demand than supply or higher supply than demand. A
stock that has higher demand than supply is said to be in Bullish trend while a stock that has
higher supply than demand is said to be in Bearish trend.
Trend is important in depicting the general current and future performance of the stock market.
Interpretation of trend shall help in informing judgment on whether or when to invest in the stock
market.
At times trend could be positive while at other times trend could be negative, impacting
differently on investors’ decisions.
Three types of trend do exist in the stock market;
Uptrends: This type of trend depicts a scenario whereby both the peaks and the troughs of a
stock chart keep increasing successively. So, after given observational intervals, the stock prices
get to a new high price and the low price becomes higher than the previous.
Downtrends: In this case, stock is constantly falling. After given observational intervals, the
stock prices get to lower high and low prices compared to the previous highs and lows.
⊘ This is a preview!⊘
Do you want full access?
Subscribe today to unlock all pages.
Trusted by 1+ million students worldwide

Sideways/horizontal trends: In this type of trend, stock does not notably fall or rise over an
extended interval. Price highs and lows remain constant. It is difficult to decide whether and
when to buy or sell stock when this type of trend is observed.
Peaks and troughs can be connected by a trend line. Trend lines that connect peaks will help in
understanding the growth that a stock has displayed over an interval or period of time. Trend
lines that connect troughs help in understanding the risks inherent in the stock over intervals or
periods of time.
Paraphrase This Document
Need a fresh take? Get an instant paraphrase of this document with our AI Paraphraser
Research methodology
This research is qualitative research. The data used in this research is secondary data by taking
samples from the State Bank of India (SBI). Sampling was done by purposive sampling
technique. Price averages was performed using the simple moving average method.
Data collection
The data that was used in this study is secondary data that was collected based on the daily
market statistics released by the State Bank of India (SBI) for the entire period of the study.
Indicator calculation
For purposes of this research, price was studied as an indicator of stock market performance.
Calculation of the price indicators for purposes of this research was done using the following
methods.
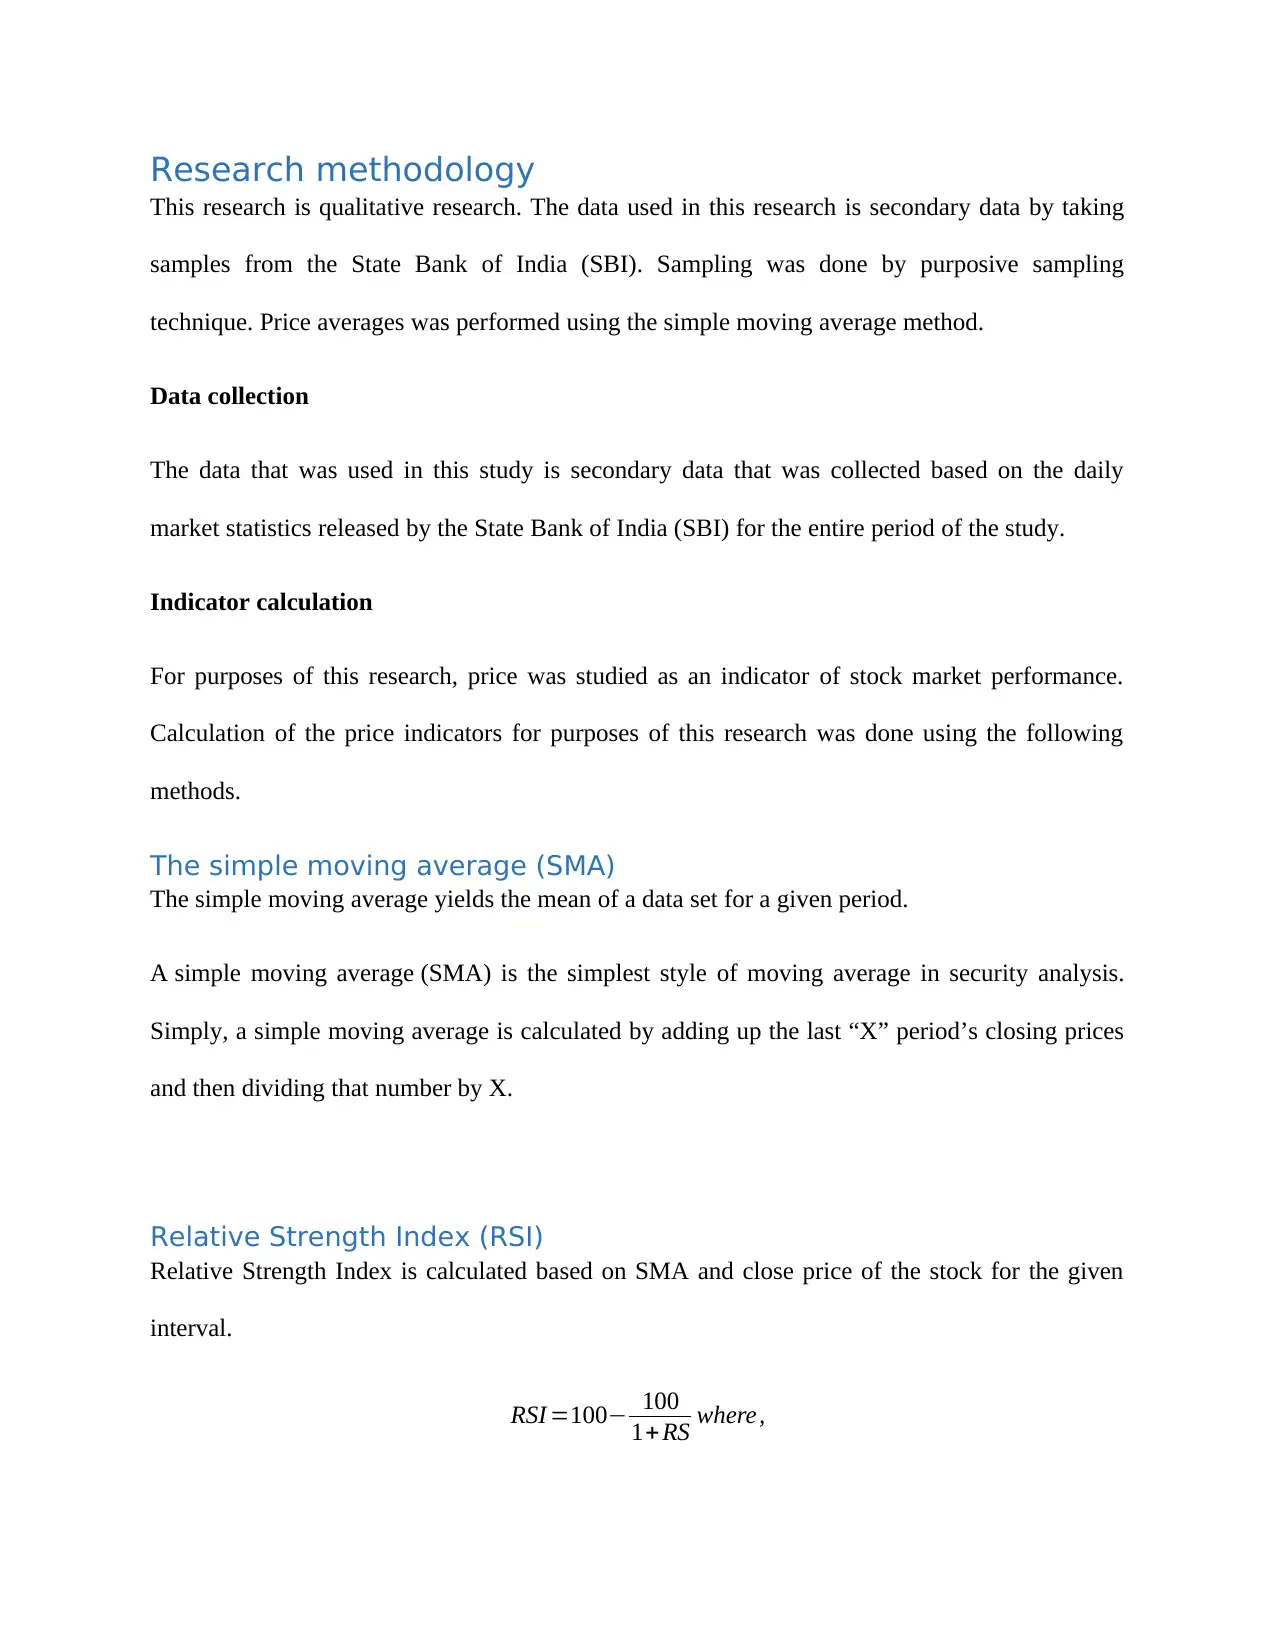
The simple moving average (SMA)
The simple moving average yields the mean of a data set for a given period.
A simple moving average (SMA) is the simplest style of moving average in security analysis.
Simply, a simple moving average is calculated by adding up the last “X” period’s closing prices
and then dividing that number by X.
Relative Strength Index (RSI)
Relative Strength Index is calculated based on SMA and close price of the stock for the given
interval.
RSI =100− 100
1+RS where,
This research is qualitative research. The data used in this research is secondary data by taking
samples from the State Bank of India (SBI). Sampling was done by purposive sampling
technique. Price averages was performed using the simple moving average method.
Data collection
The data that was used in this study is secondary data that was collected based on the daily
market statistics released by the State Bank of India (SBI) for the entire period of the study.
Indicator calculation
For purposes of this research, price was studied as an indicator of stock market performance.
Calculation of the price indicators for purposes of this research was done using the following
methods.
The simple moving average (SMA)
The simple moving average yields the mean of a data set for a given period.
A simple moving average (SMA) is the simplest style of moving average in security analysis.
Simply, a simple moving average is calculated by adding up the last “X” period’s closing prices
and then dividing that number by X.
Relative Strength Index (RSI)
Relative Strength Index is calculated based on SMA and close price of the stock for the given
interval.
RSI =100− 100
1+RS where,
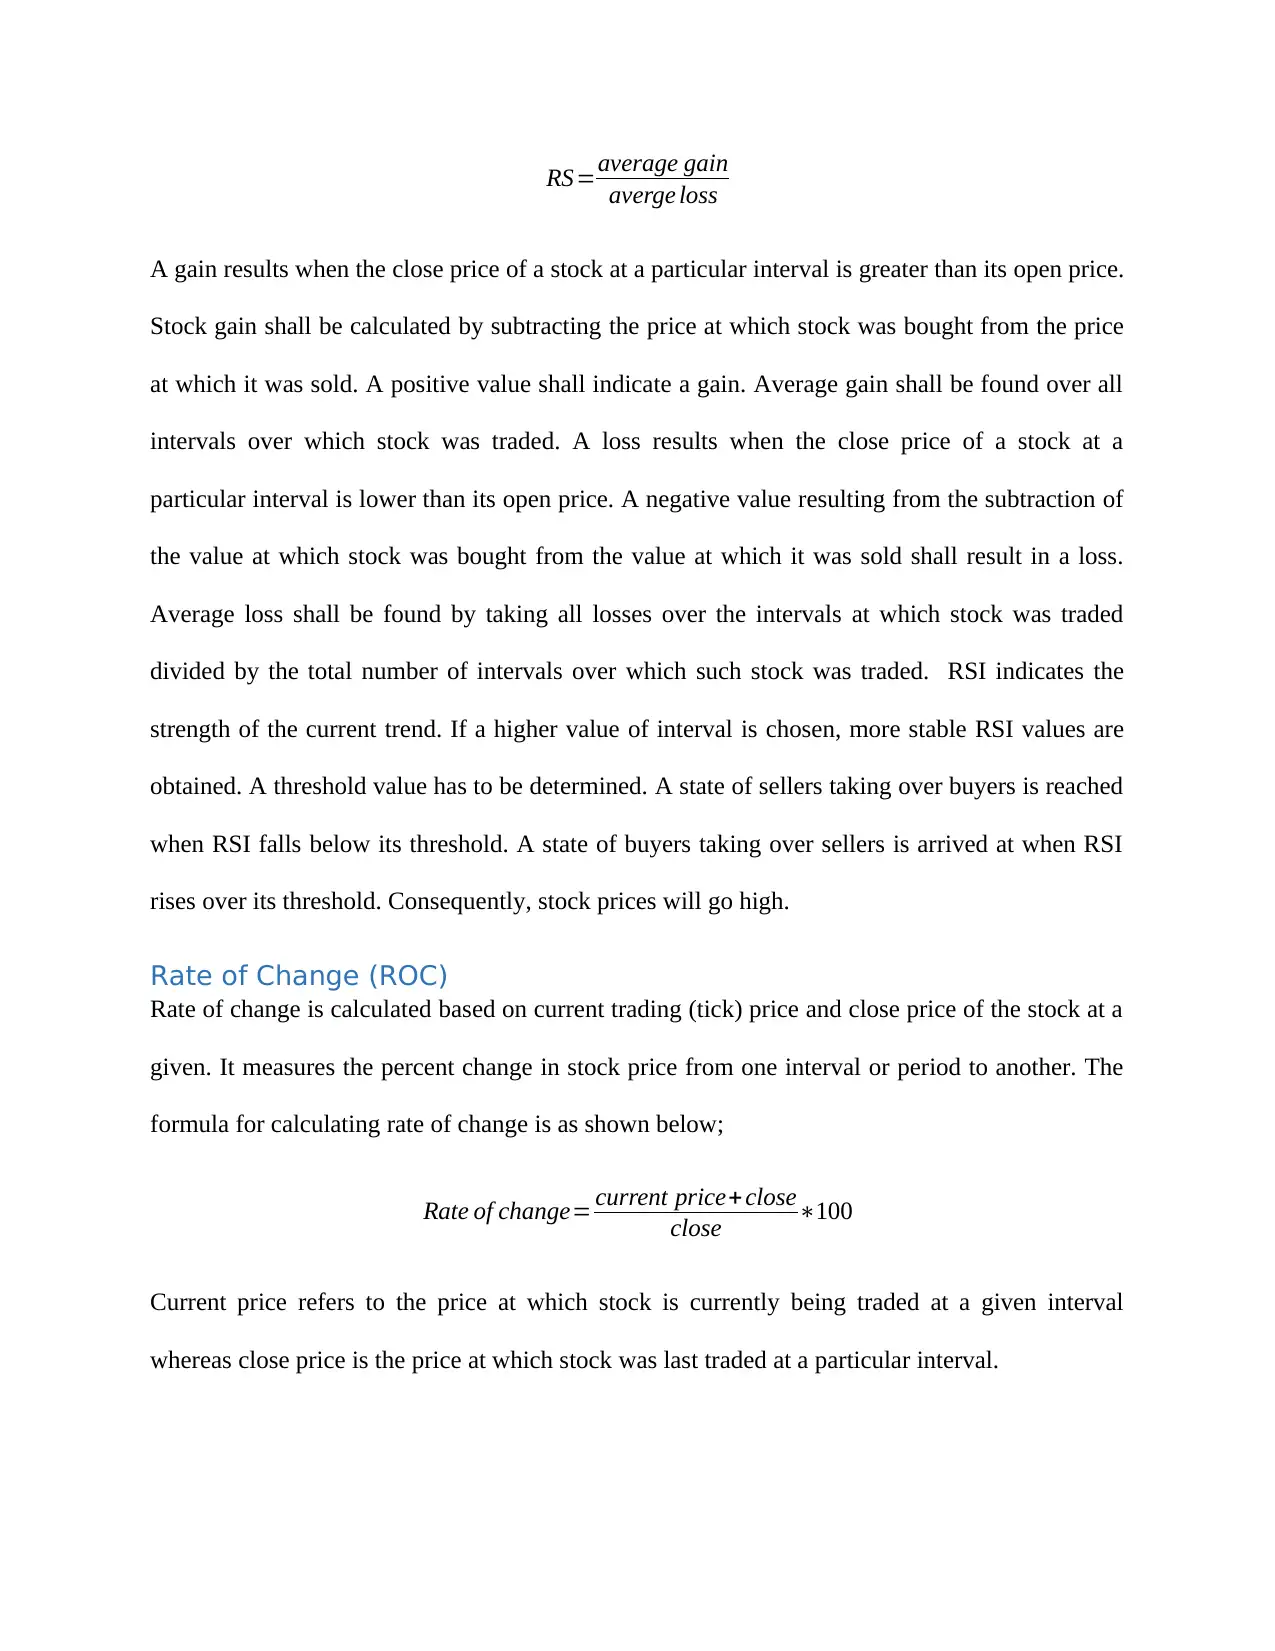
RS=average gain
averge loss
A gain results when the close price of a stock at a particular interval is greater than its open price.
Stock gain shall be calculated by subtracting the price at which stock was bought from the price
at which it was sold. A positive value shall indicate a gain. Average gain shall be found over all
intervals over which stock was traded. A loss results when the close price of a stock at a
particular interval is lower than its open price. A negative value resulting from the subtraction of
the value at which stock was bought from the value at which it was sold shall result in a loss.
Average loss shall be found by taking all losses over the intervals at which stock was traded
divided by the total number of intervals over which such stock was traded. RSI indicates the
strength of the current trend. If a higher value of interval is chosen, more stable RSI values are
obtained. A threshold value has to be determined. A state of sellers taking over buyers is reached
when RSI falls below its threshold. A state of buyers taking over sellers is arrived at when RSI
rises over its threshold. Consequently, stock prices will go high.
Rate of Change (ROC)
Rate of change is calculated based on current trading (tick) price and close price of the stock at a
given. It measures the percent change in stock price from one interval or period to another. The
formula for calculating rate of change is as shown below;
Rate of change= current price+ close
close ∗100
Current price refers to the price at which stock is currently being traded at a given interval
whereas close price is the price at which stock was last traded at a particular interval.
⊘ This is a preview!⊘
Do you want full access?
Subscribe today to unlock all pages.
Trusted by 1+ million students worldwide
1 out of 20
Related Documents


Your All-in-One AI-Powered Toolkit for Academic Success.
+13062052269
info@desklib.com
Available 24*7 on WhatsApp / Email
![[object Object]](/_next/static/media/star-bottom.7253800d.svg)
Unlock your academic potential
Copyright © 2020–2026 A2Z Services. All Rights Reserved. Developed and managed by ZUCOL.