ACC306 - Portfolio and FCF Analysis: Stock Performance Review
VerifiedAdded on 2020/05/28
|18
|2614
|87
Project
AI Summary
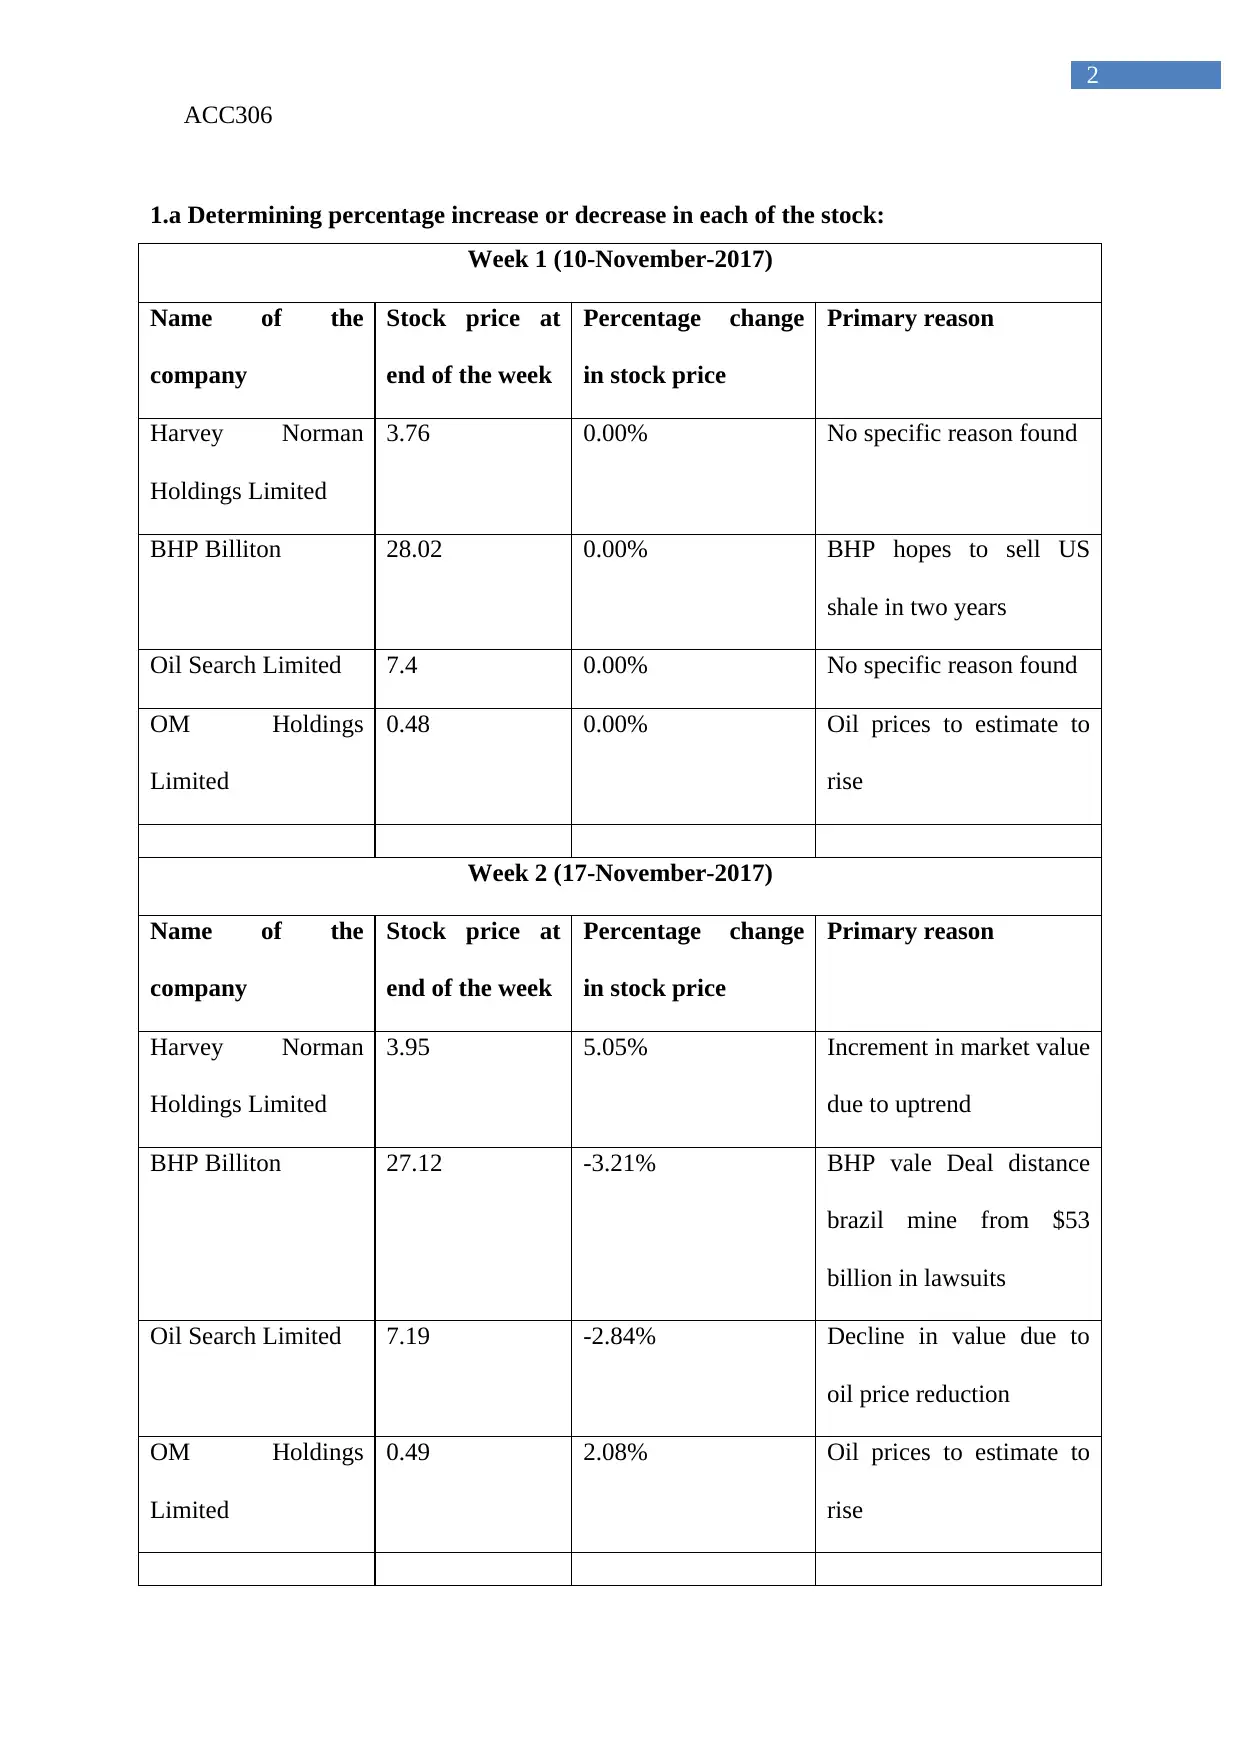
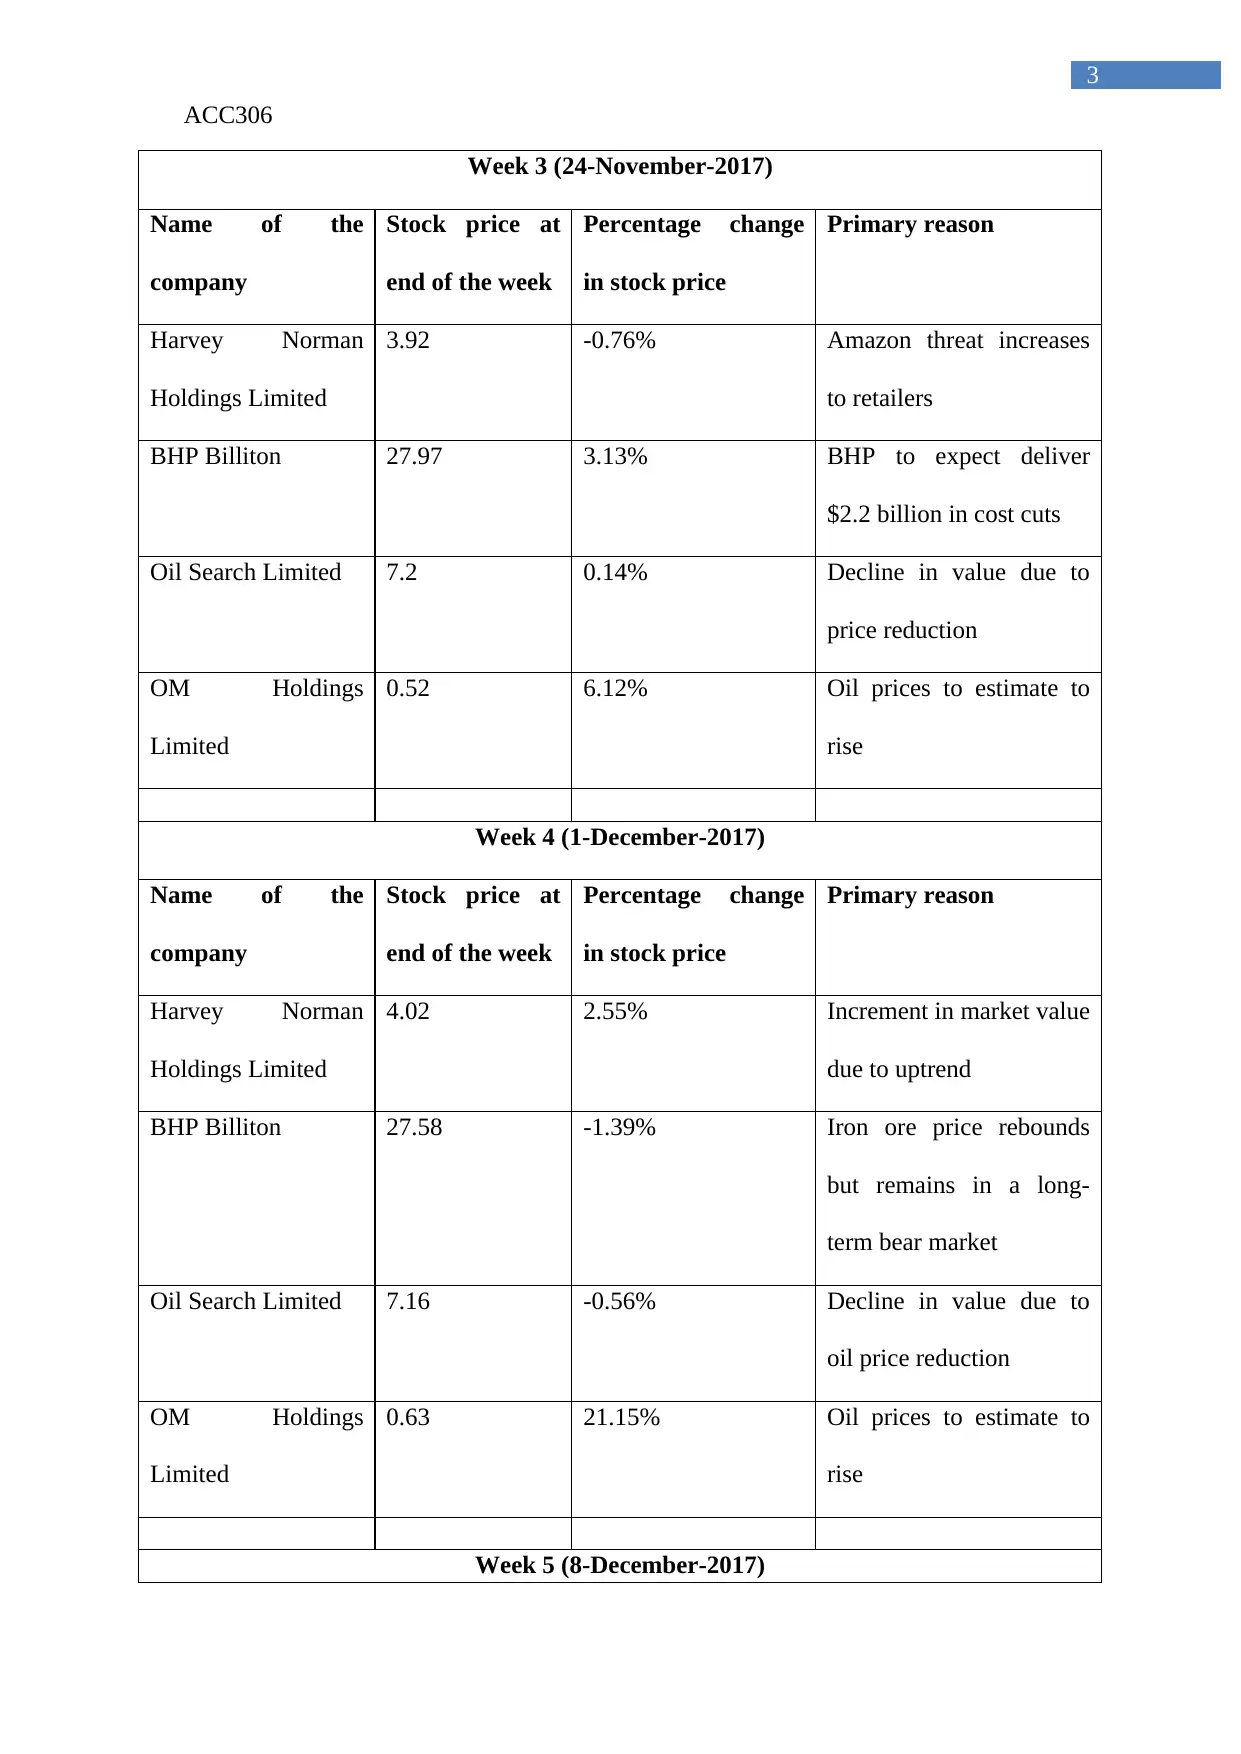
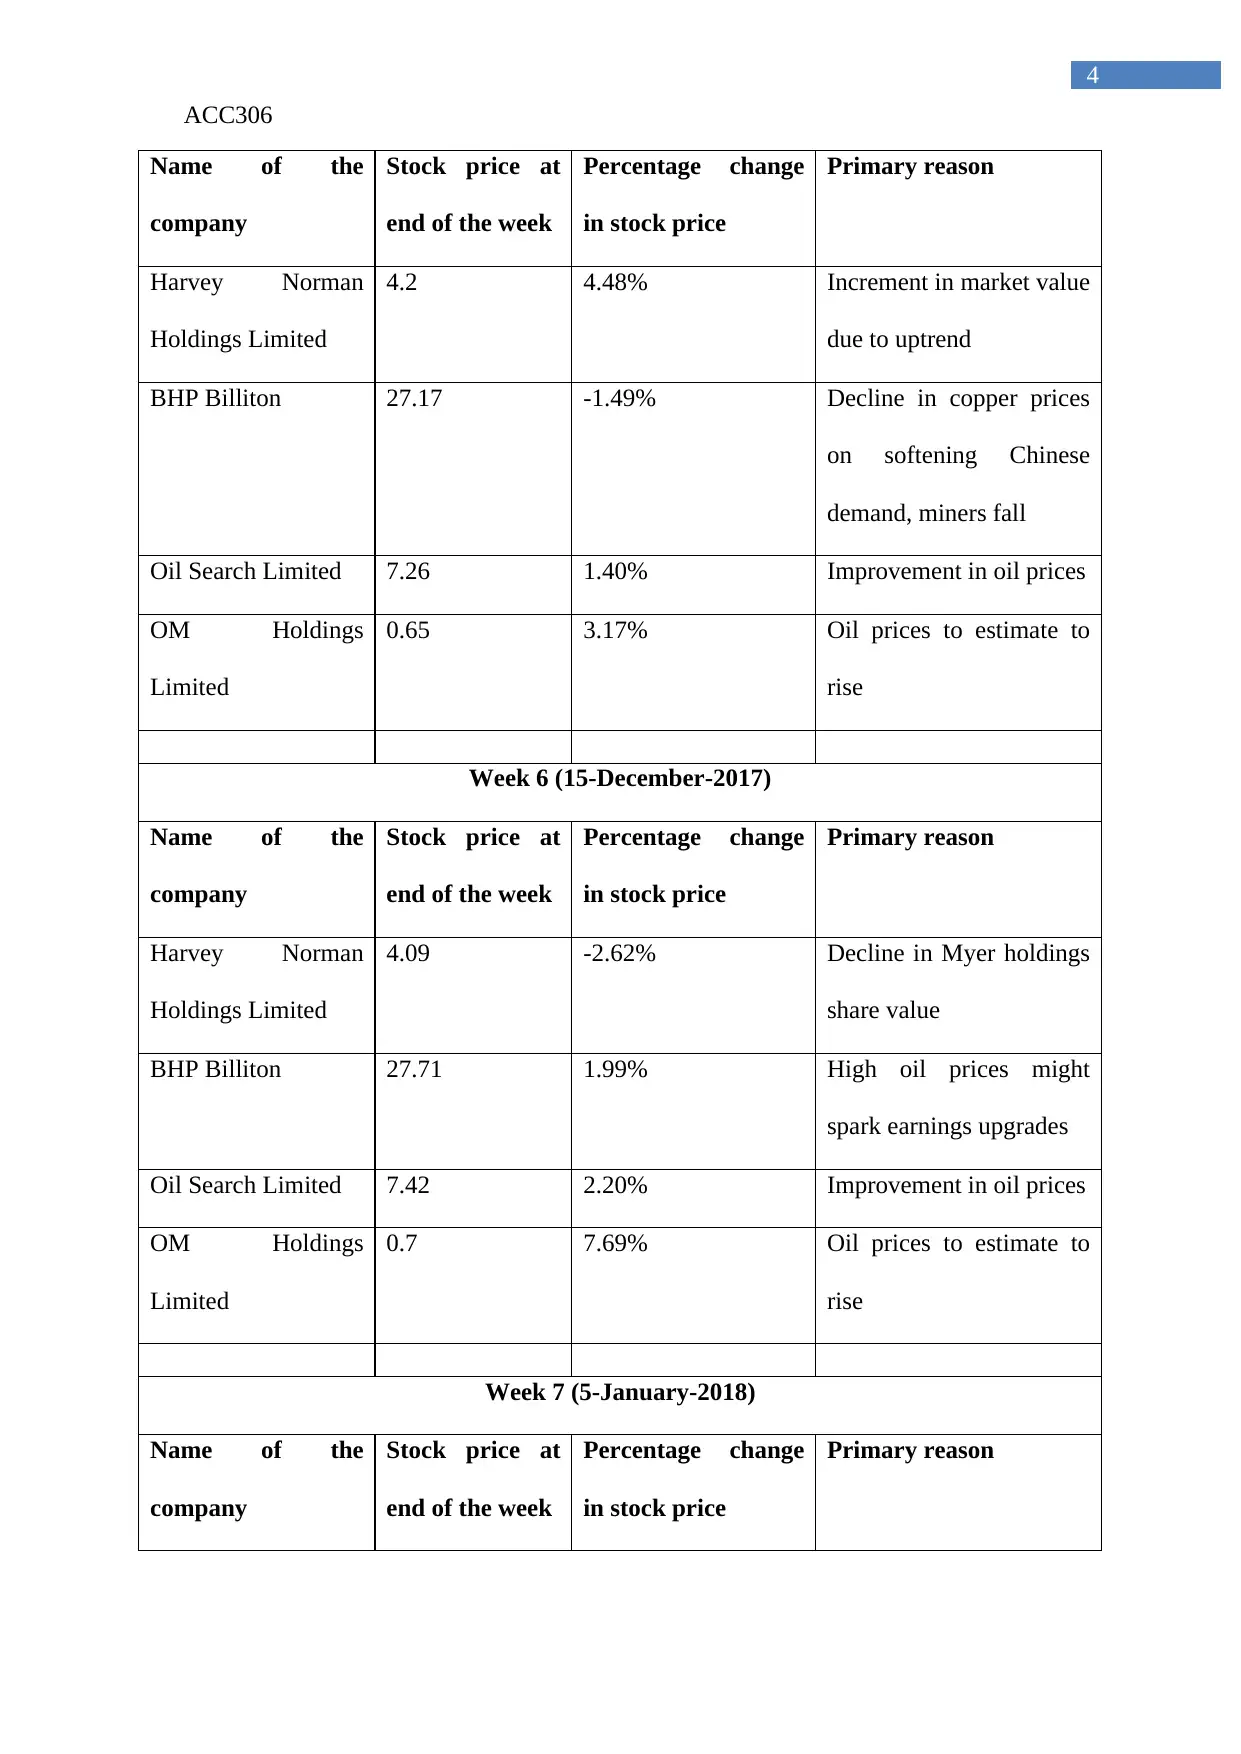
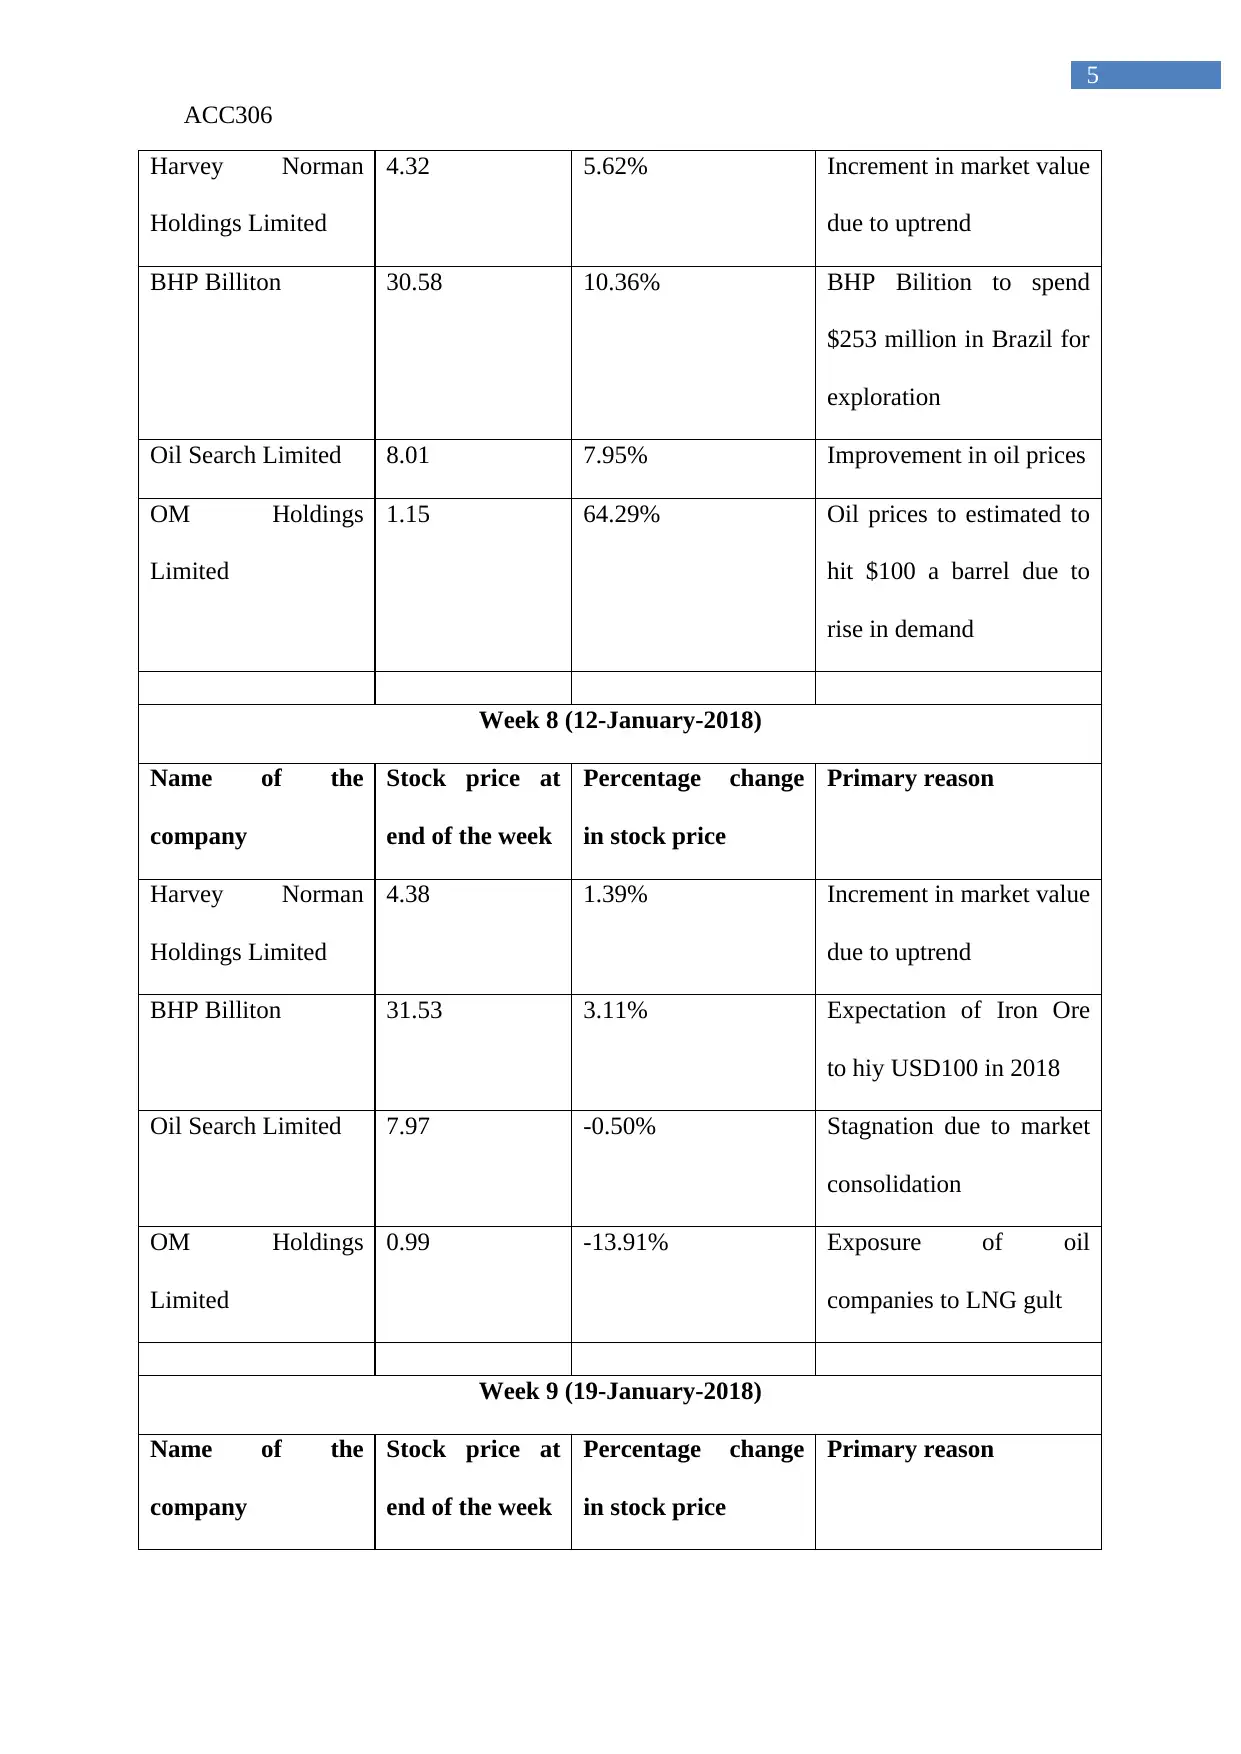
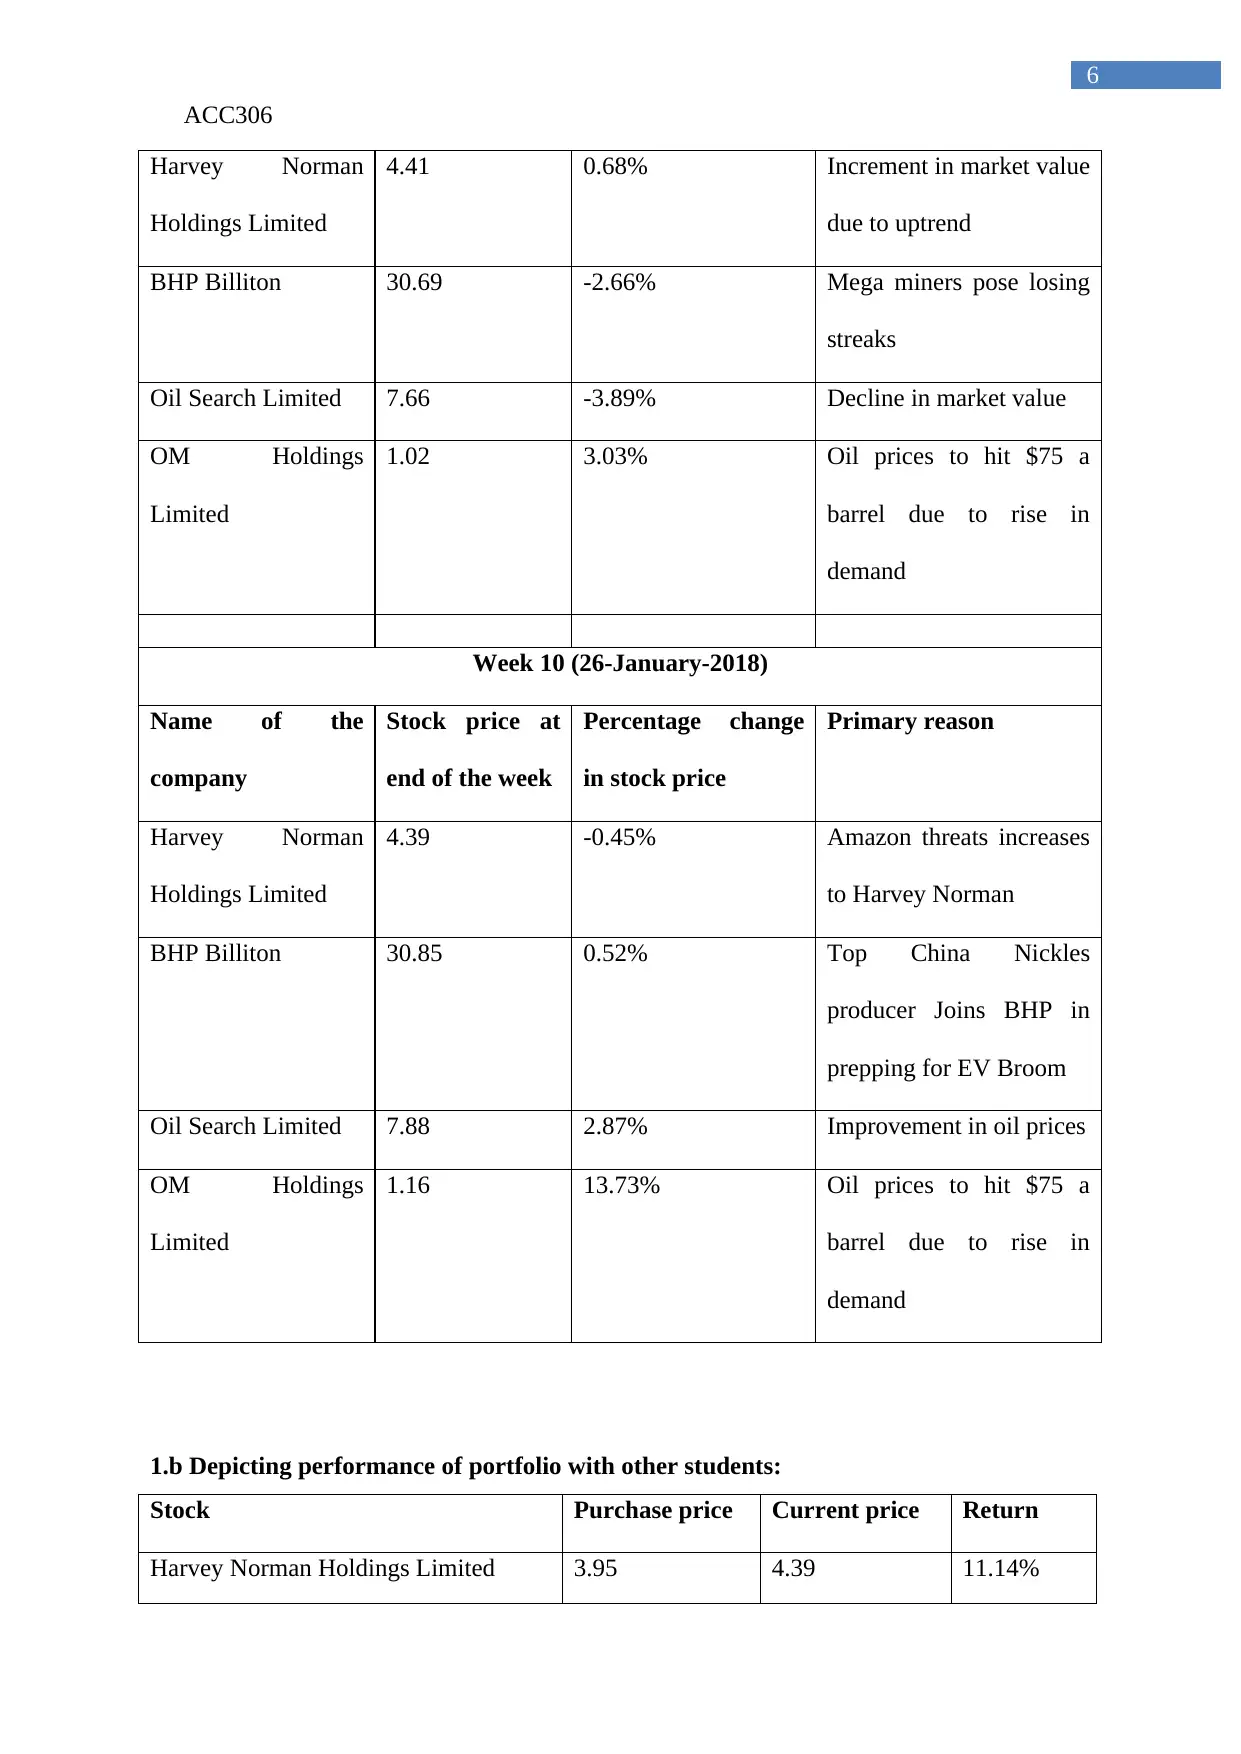
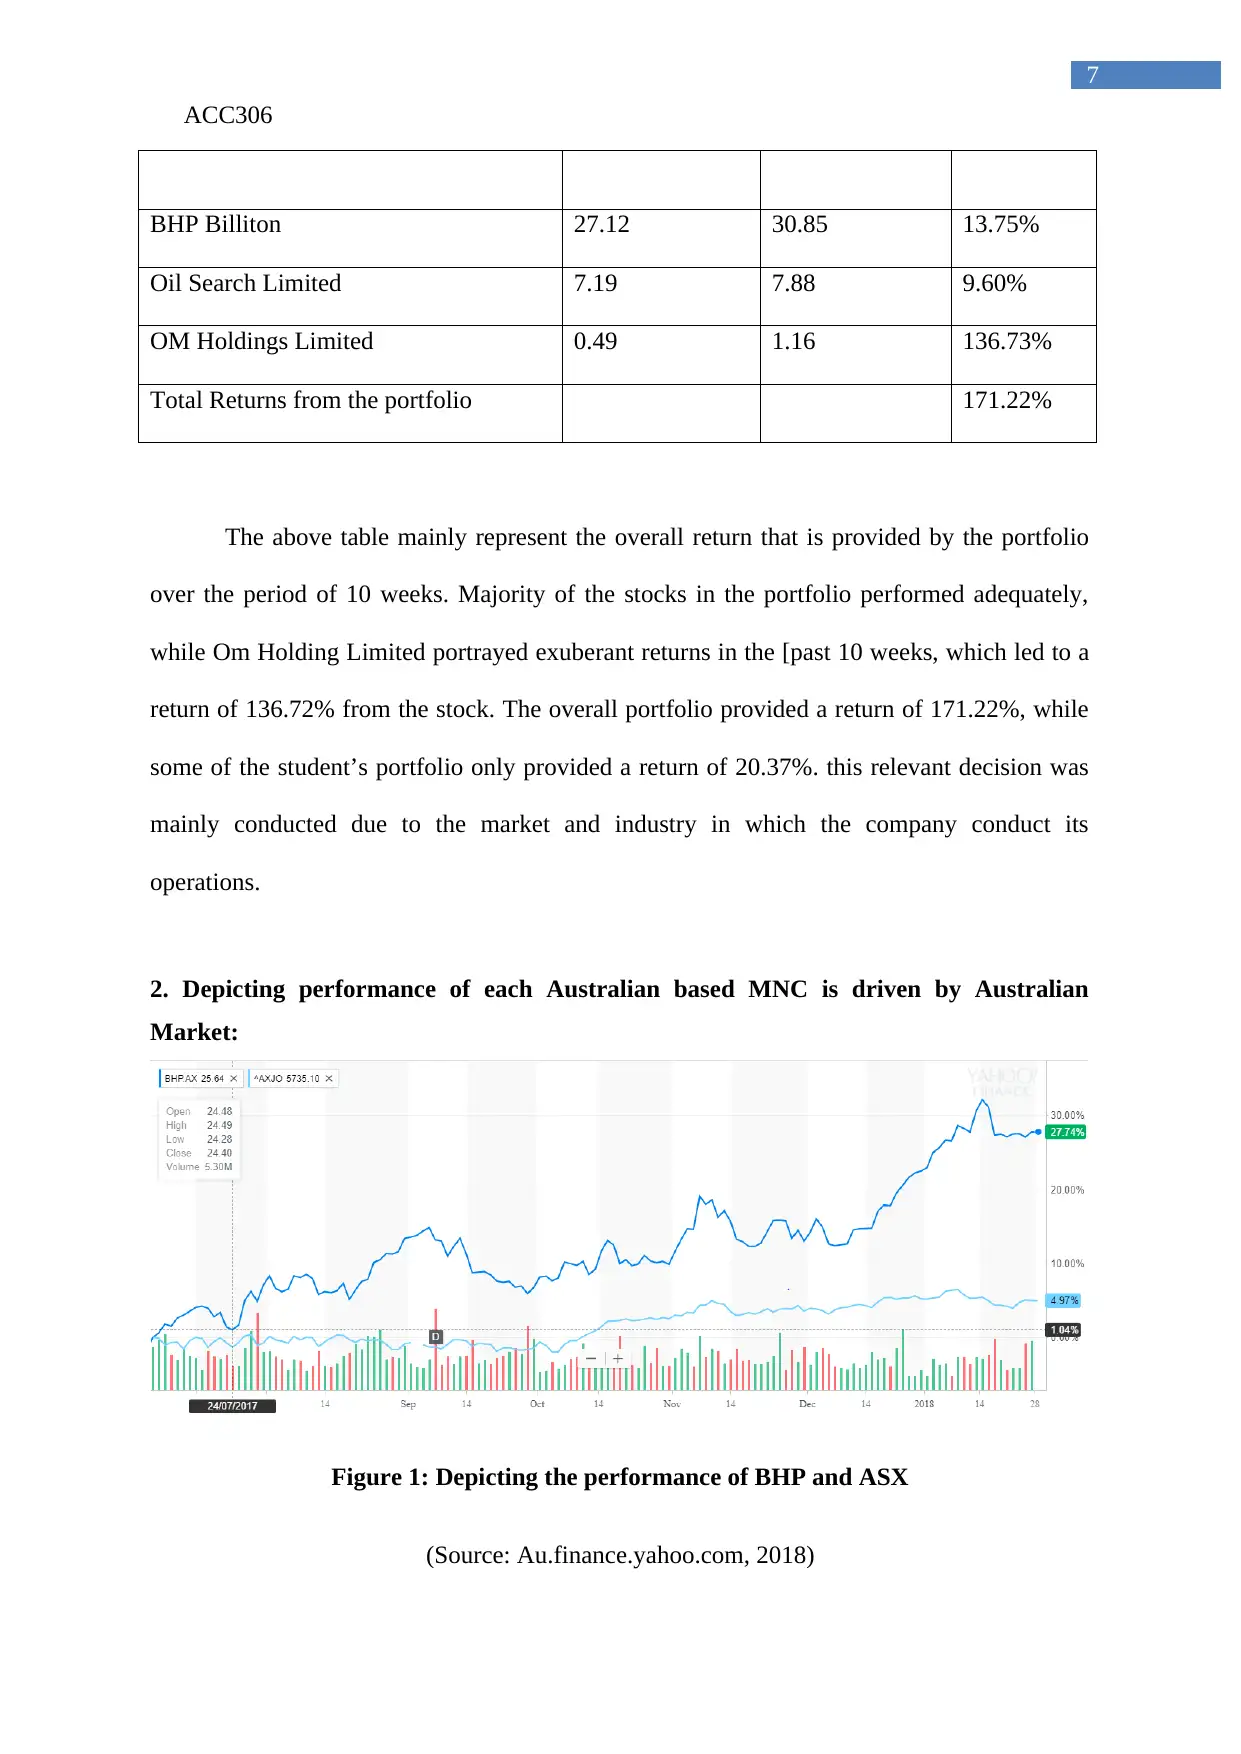
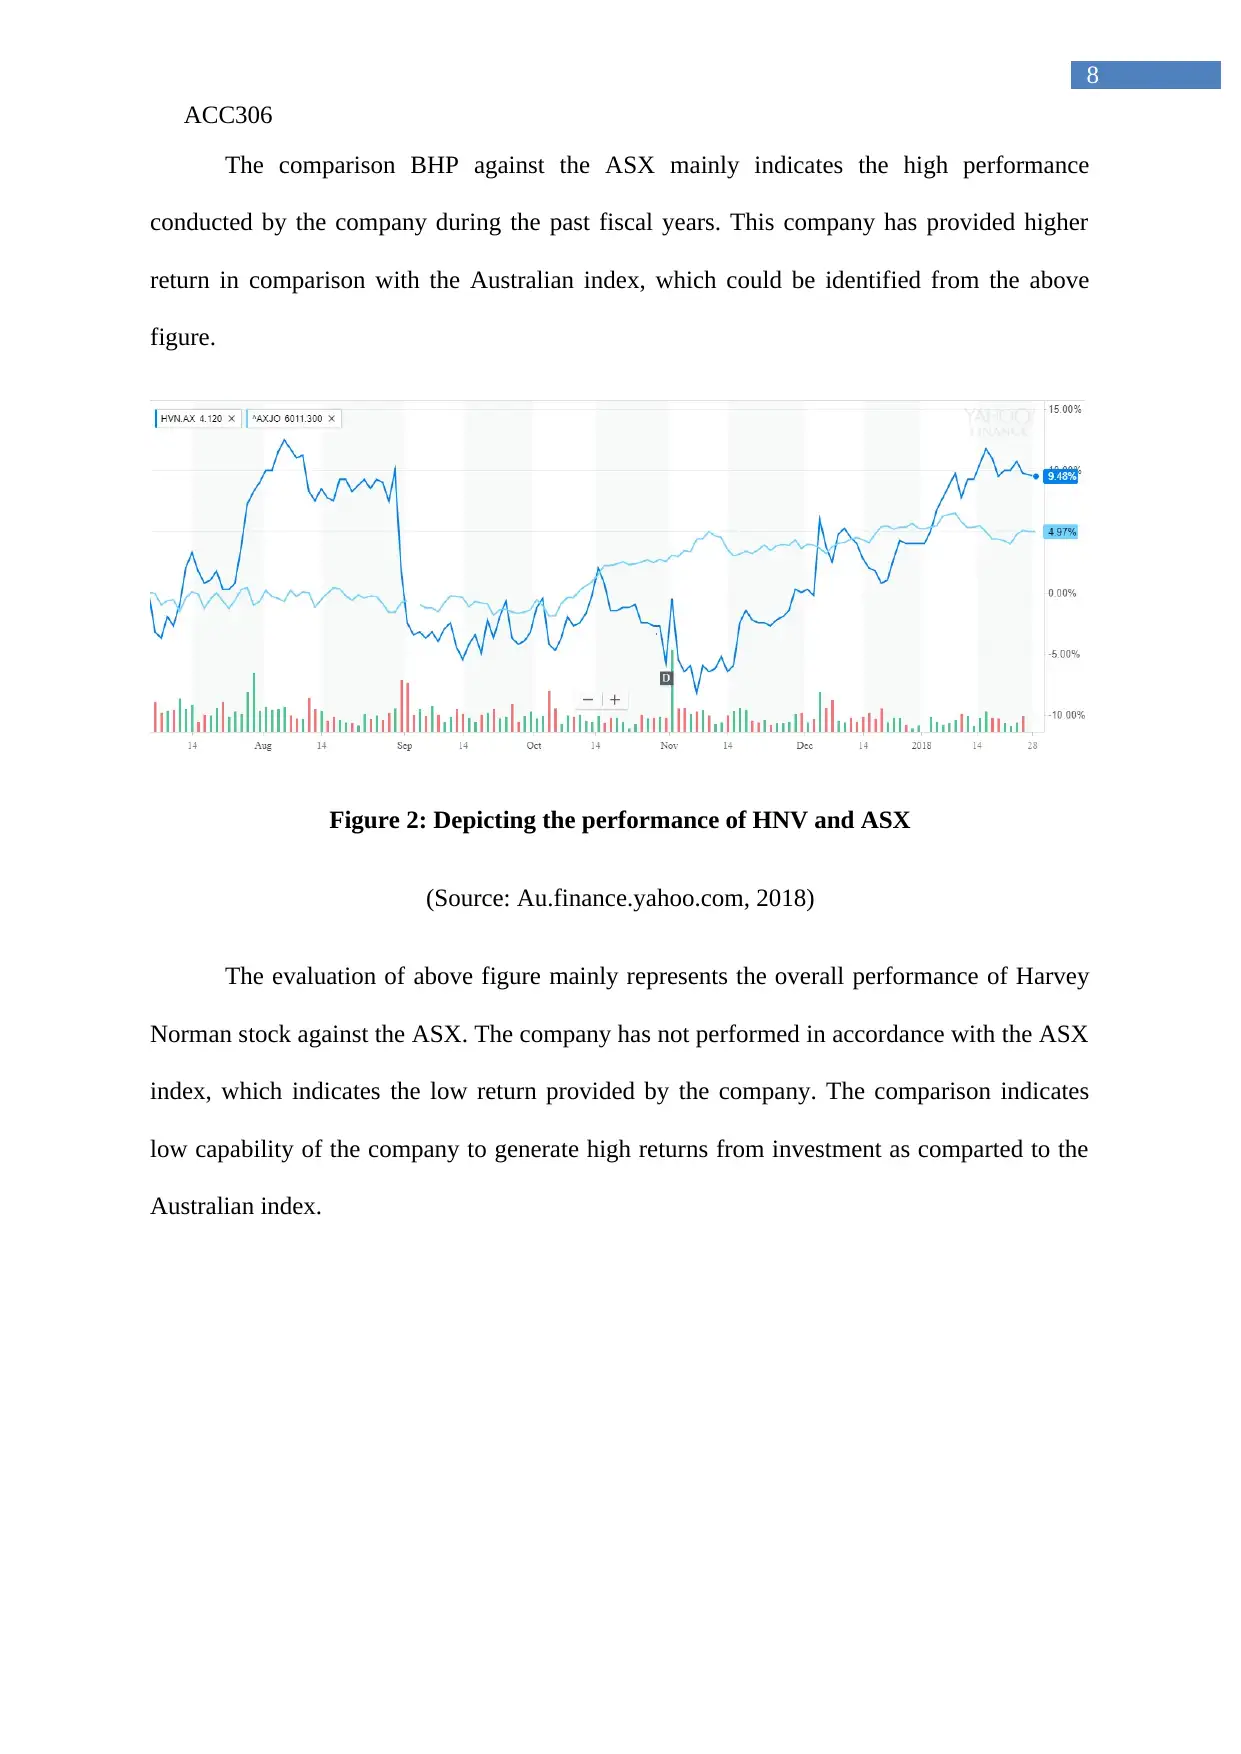
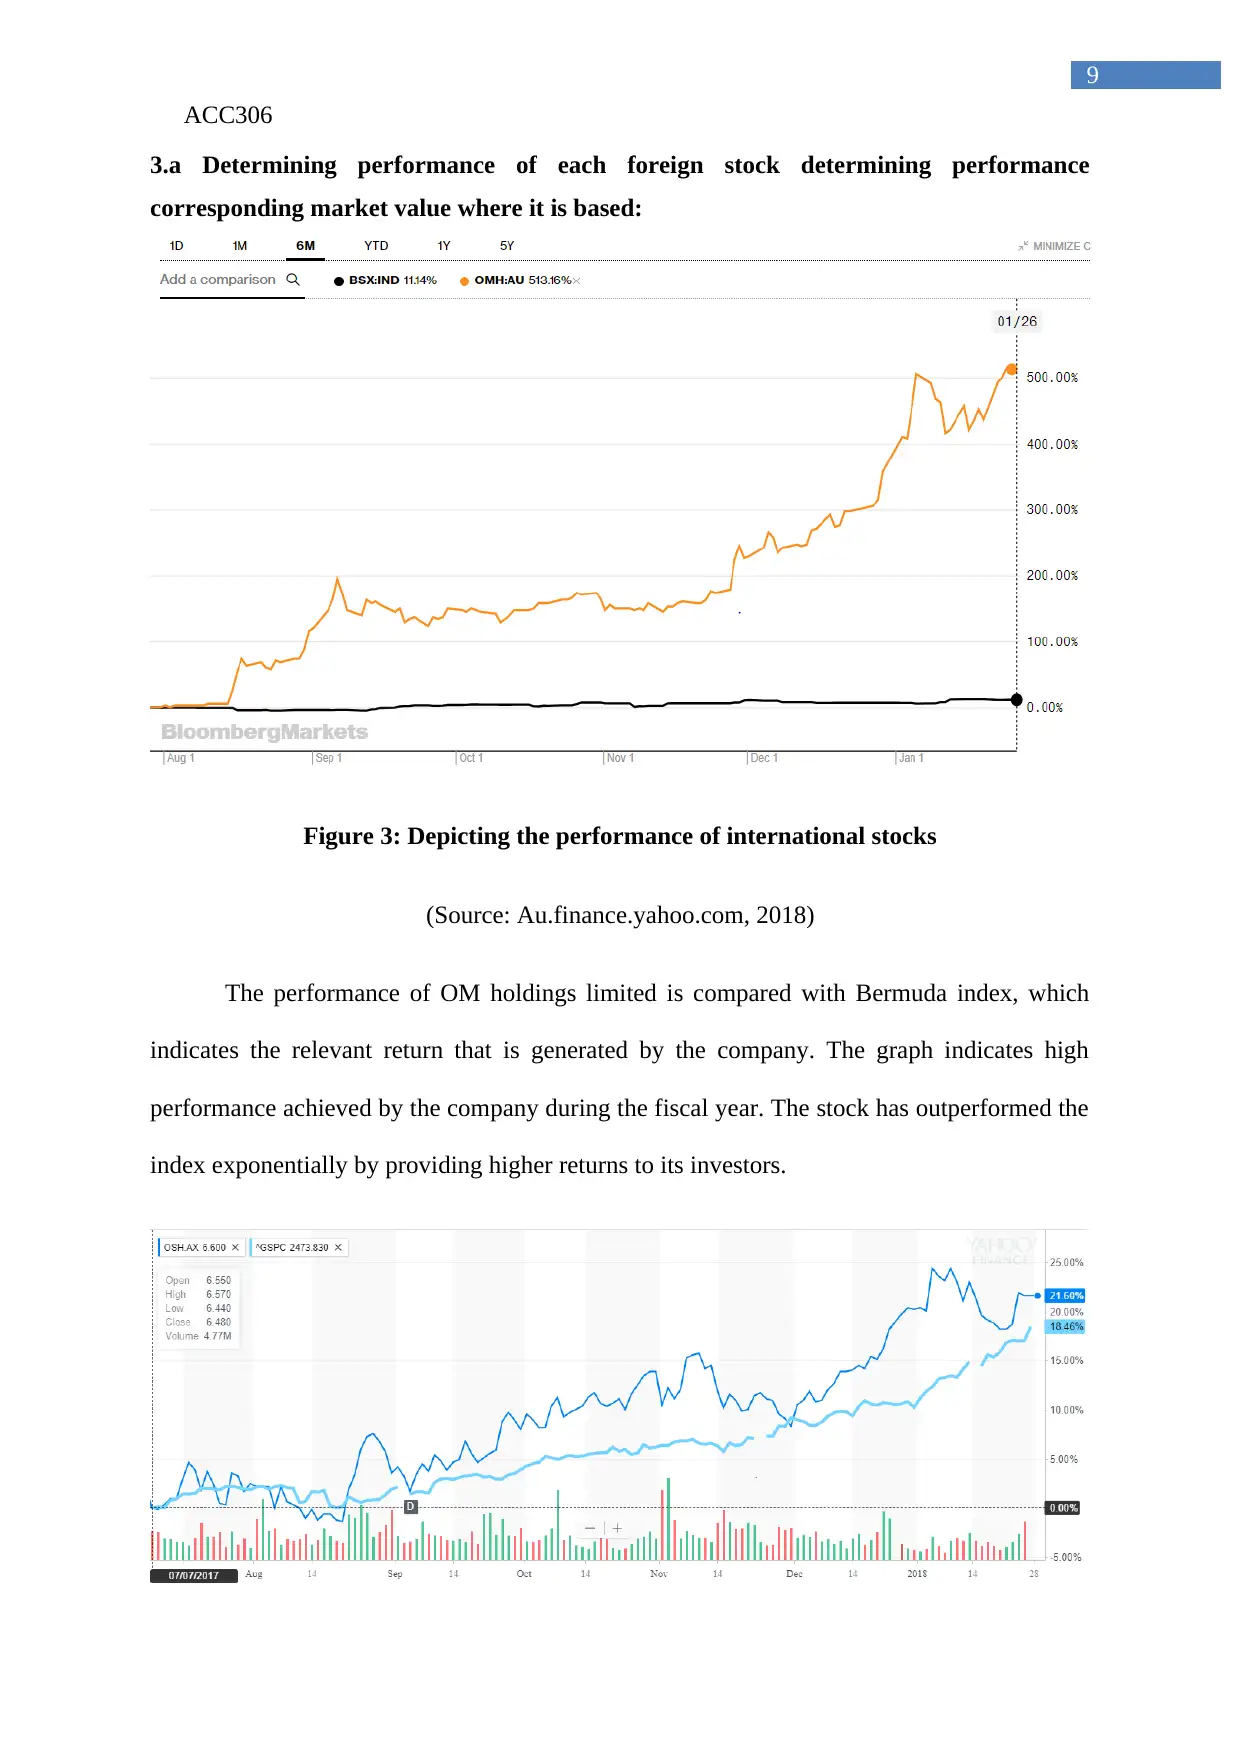
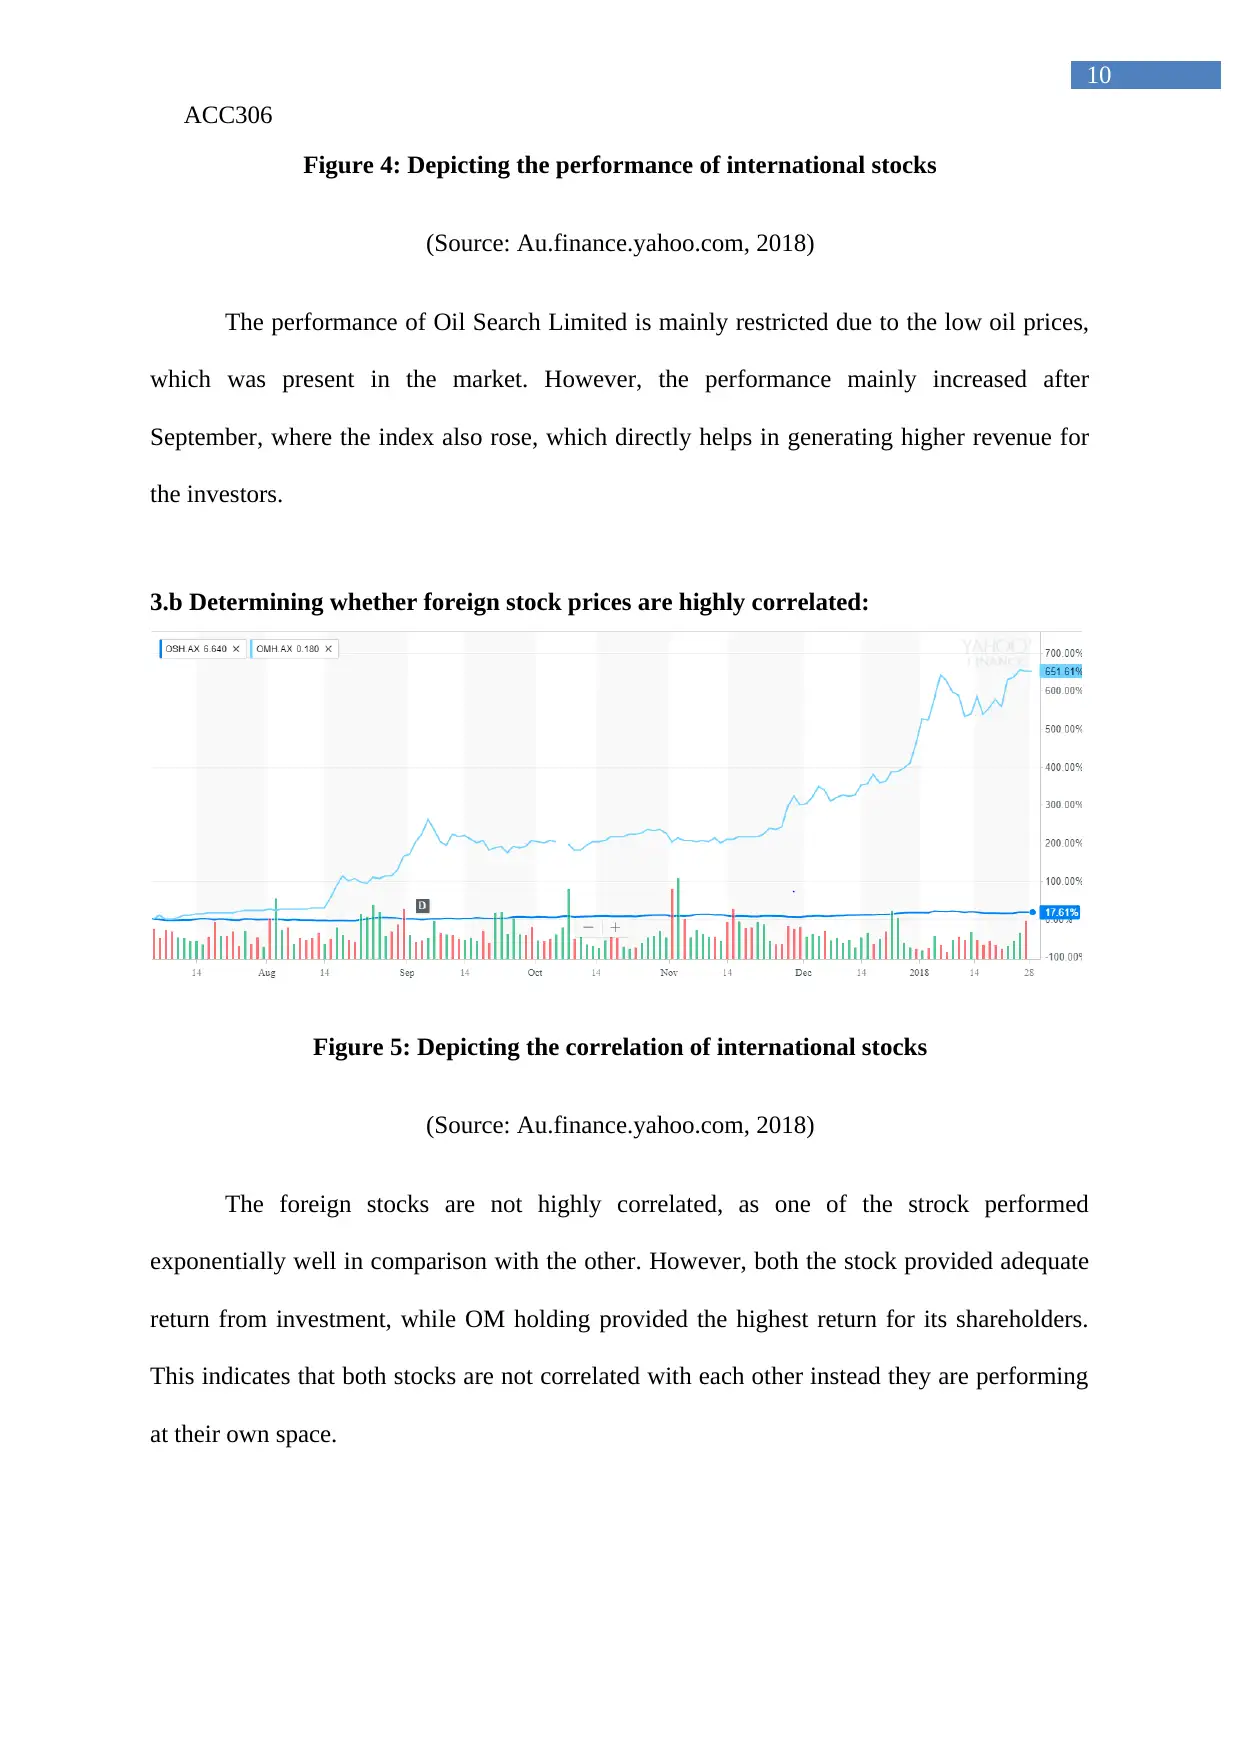
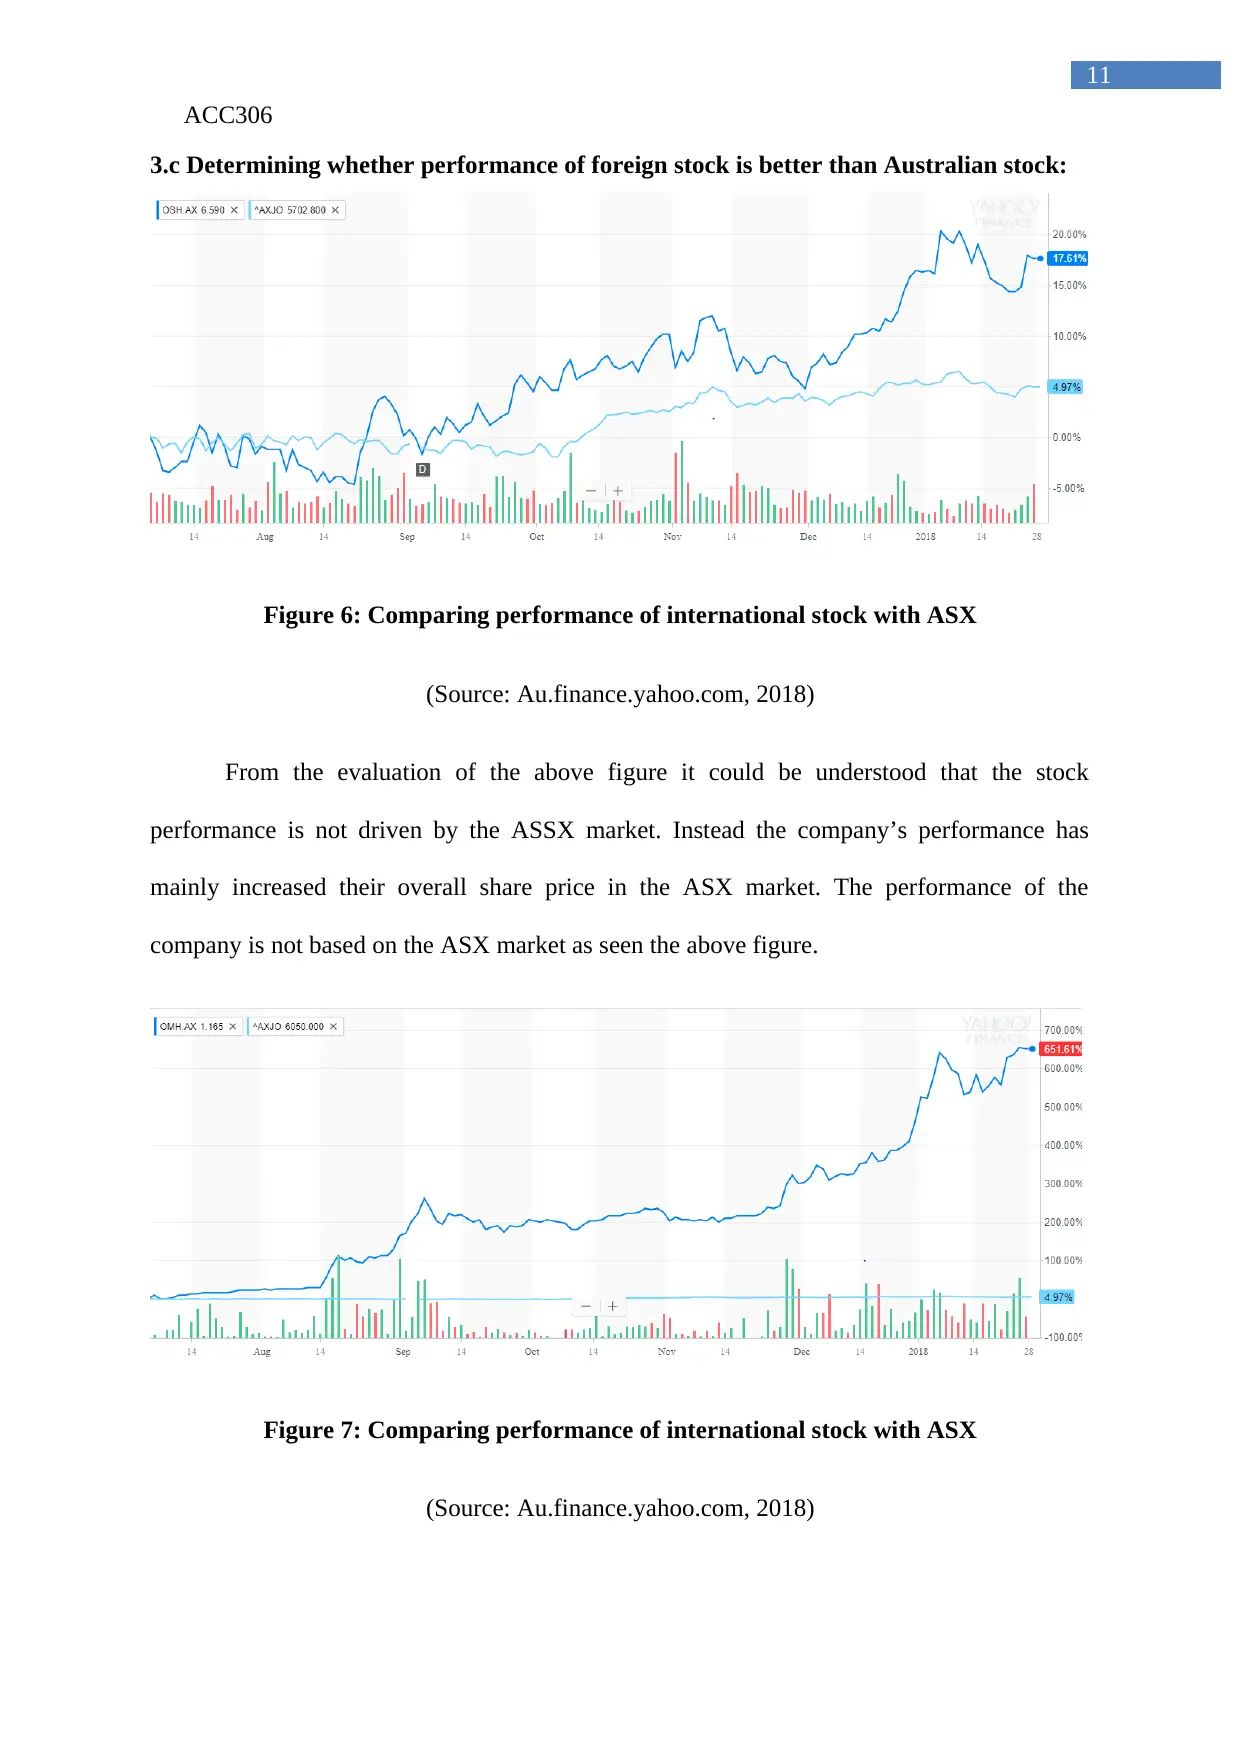
This ACC306 project analyzes the performance of a stock portfolio over a 10-week period, including the percentage change in stock prices for companies like Harvey Norman, BHP Billiton, Oil Search, and OM Holdings. The analysis compares the portfolio's returns with those of other students and the Australian Securities Exchange (ASX) index. It also examines the influence of the Australian market and foreign currency exchange rates on the performance of Australian-based multinational corporations and foreign stocks. Furthermore, the project delves into free cash flow (FCF) analysis for 2009, evaluating FCF with and without growth projections. The student reviews annual reports and news articles to support the financial analysis and determine whether foreign stock prices are correlated. Overall, the assignment offers a comprehensive financial analysis of stock performance, portfolio returns, and FCF valuation.

Running head: ACC306
ACC306
Name of the Student:
Name of the University:
Authors Note:
ACC306
Name of the Student:
Name of the University:
Authors Note:
Paraphrase This Document
Need a fresh take? Get an instant paraphrase of this document with our AI Paraphraser

ACC306
1
Table of Contents
1.a Determining percentage increase or decrease in each of the stock:.....................................2
1.b Depicting performance of portfolio with other students:.....................................................6
2. Depicting performance of each Australian based MNC is driven by Australian Market:.....7
3.a Determining performance of each foreign stock determining performance corresponding
market value where it is based:..................................................................................................9
3.b Determining whether foreign stock prices are highly correlated:......................................10
3.c Determining whether performance of foreign stock is better than Australian stock:........11
4.a Reviewing annual report and news about Australian based MNC’s:.................................12
4.b Reviewing annual report and news about Australian based MNC’s:................................13
5.a Determining whether stock performance of each foreign companies its influenced by
exchange rate of local currency with Australian currency:......................................................13
5.b Determining performance of foreign stock:.......................................................................14
6.a Detecting FCF during 2009:...............................................................................................15
6.b Detecting FCF during 2009 with 3% growth:....................................................................16
7.a Detecting value of FCF with method 1 and method 2:......................................................16
7.b Detecting value of FCF with reported values:...................................................................17
Reference and Bibliography:....................................................................................................18

ACC306
2
1.a Determining percentage increase or decrease in each of the stock:
Week 1 (10-November-2017)
Name of the
company
Stock price at
end of the week
Percentage change
in stock price
Primary reason
Harvey Norman
Holdings Limited
3.76 0.00% No specific reason found
BHP Billiton 28.02 0.00% BHP hopes to sell US
shale in two years
Oil Search Limited 7.4 0.00% No specific reason found
OM Holdings
Limited
0.48 0.00% Oil prices to estimate to
rise
Week 2 (17-November-2017)
Name of the
company
Stock price at
end of the week
Percentage change
in stock price
Primary reason
Harvey Norman
Holdings Limited
3.95 5.05% Increment in market value
due to uptrend
BHP Billiton 27.12 -3.21% BHP vale Deal distance
brazil mine from $53
billion in lawsuits
Oil Search Limited 7.19 -2.84% Decline in value due to
oil price reduction
OM Holdings
Limited
0.49 2.08% Oil prices to estimate to
rise
⊘ This is a preview!⊘
Do you want full access?
Subscribe today to unlock all pages.

Trusted by 1+ million students worldwide

ACC306
3
Week 3 (24-November-2017)
Name of the
company
Stock price at
end of the week
Percentage change
in stock price
Primary reason
Harvey Norman
Holdings Limited
3.92 -0.76% Amazon threat increases
to retailers
BHP Billiton 27.97 3.13% BHP to expect deliver
$2.2 billion in cost cuts
Oil Search Limited 7.2 0.14% Decline in value due to
price reduction
OM Holdings
Limited
0.52 6.12% Oil prices to estimate to
rise
Week 4 (1-December-2017)
Name of the
company
Stock price at
end of the week
Percentage change
in stock price
Primary reason
Harvey Norman
Holdings Limited
4.02 2.55% Increment in market value
due to uptrend
BHP Billiton 27.58 -1.39% Iron ore price rebounds
but remains in a long-
term bear market
Oil Search Limited 7.16 -0.56% Decline in value due to
oil price reduction
OM Holdings
Limited
0.63 21.15% Oil prices to estimate to
rise
Week 5 (8-December-2017)
Paraphrase This Document
Need a fresh take? Get an instant paraphrase of this document with our AI Paraphraser

ACC306
4
Name of the
company
Stock price at
end of the week
Percentage change
in stock price
Primary reason
Harvey Norman
Holdings Limited
4.2 4.48% Increment in market value
due to uptrend
BHP Billiton 27.17 -1.49% Decline in copper prices
on softening Chinese
demand, miners fall
Oil Search Limited 7.26 1.40% Improvement in oil prices
OM Holdings
Limited
0.65 3.17% Oil prices to estimate to
rise
Week 6 (15-December-2017)
Name of the
company
Stock price at
end of the week
Percentage change
in stock price
Primary reason
Harvey Norman
Holdings Limited
4.09 -2.62% Decline in Myer holdings
share value
BHP Billiton 27.71 1.99% High oil prices might
spark earnings upgrades
Oil Search Limited 7.42 2.20% Improvement in oil prices
OM Holdings
Limited
0.7 7.69% Oil prices to estimate to
rise
Week 7 (5-January-2018)
Name of the
company
Stock price at
end of the week
Percentage change
in stock price
Primary reason

ACC306
5
Harvey Norman
Holdings Limited
4.32 5.62% Increment in market value
due to uptrend
BHP Billiton 30.58 10.36% BHP Bilition to spend
$253 million in Brazil for
exploration
Oil Search Limited 8.01 7.95% Improvement in oil prices
OM Holdings
Limited
1.15 64.29% Oil prices to estimated to
hit $100 a barrel due to
rise in demand
Week 8 (12-January-2018)
Name of the
company
Stock price at
end of the week
Percentage change
in stock price
Primary reason
Harvey Norman
Holdings Limited
4.38 1.39% Increment in market value
due to uptrend
BHP Billiton 31.53 3.11% Expectation of Iron Ore
to hiy USD100 in 2018
Oil Search Limited 7.97 -0.50% Stagnation due to market
consolidation
OM Holdings
Limited
0.99 -13.91% Exposure of oil
companies to LNG gult
Week 9 (19-January-2018)
Name of the
company
Stock price at
end of the week
Percentage change
in stock price
Primary reason
⊘ This is a preview!⊘
Do you want full access?
Subscribe today to unlock all pages.

Trusted by 1+ million students worldwide

ACC306
6
Harvey Norman
Holdings Limited
4.41 0.68% Increment in market value
due to uptrend
BHP Billiton 30.69 -2.66% Mega miners pose losing
streaks
Oil Search Limited 7.66 -3.89% Decline in market value
OM Holdings
Limited
1.02 3.03% Oil prices to hit $75 a
barrel due to rise in
demand
Week 10 (26-January-2018)
Name of the
company
Stock price at
end of the week
Percentage change
in stock price
Primary reason
Harvey Norman
Holdings Limited
4.39 -0.45% Amazon threats increases
to Harvey Norman
BHP Billiton 30.85 0.52% Top China Nickles
producer Joins BHP in
prepping for EV Broom
Oil Search Limited 7.88 2.87% Improvement in oil prices
OM Holdings
Limited
1.16 13.73% Oil prices to hit $75 a
barrel due to rise in
demand
1.b Depicting performance of portfolio with other students:
Stock Purchase price Current price Return
Harvey Norman Holdings Limited 3.95 4.39 11.14%
Paraphrase This Document
Need a fresh take? Get an instant paraphrase of this document with our AI Paraphraser

ACC306
7
BHP Billiton 27.12 30.85 13.75%
Oil Search Limited 7.19 7.88 9.60%
OM Holdings Limited 0.49 1.16 136.73%
Total Returns from the portfolio 171.22%
The above table mainly represent the overall return that is provided by the portfolio
over the period of 10 weeks. Majority of the stocks in the portfolio performed adequately,
while Om Holding Limited portrayed exuberant returns in the [past 10 weeks, which led to a
return of 136.72% from the stock. The overall portfolio provided a return of 171.22%, while
some of the student’s portfolio only provided a return of 20.37%. this relevant decision was
mainly conducted due to the market and industry in which the company conduct its
operations.
2. Depicting performance of each Australian based MNC is driven by Australian
Market:
Figure 1: Depicting the performance of BHP and ASX
(Source: Au.finance.yahoo.com, 2018)

ACC306
8
The comparison BHP against the ASX mainly indicates the high performance
conducted by the company during the past fiscal years. This company has provided higher
return in comparison with the Australian index, which could be identified from the above
figure.
Figure 2: Depicting the performance of HNV and ASX
(Source: Au.finance.yahoo.com, 2018)
The evaluation of above figure mainly represents the overall performance of Harvey
Norman stock against the ASX. The company has not performed in accordance with the ASX
index, which indicates the low return provided by the company. The comparison indicates
low capability of the company to generate high returns from investment as comparted to the
Australian index.
⊘ This is a preview!⊘
Do you want full access?
Subscribe today to unlock all pages.

Trusted by 1+ million students worldwide

ACC306
9
3.a Determining performance of each foreign stock determining performance
corresponding market value where it is based:
Figure 3: Depicting the performance of international stocks
(Source: Au.finance.yahoo.com, 2018)
The performance of OM holdings limited is compared with Bermuda index, which
indicates the relevant return that is generated by the company. The graph indicates high
performance achieved by the company during the fiscal year. The stock has outperformed the
index exponentially by providing higher returns to its investors.
Paraphrase This Document
Need a fresh take? Get an instant paraphrase of this document with our AI Paraphraser

ACC306
10
Figure 4: Depicting the performance of international stocks
(Source: Au.finance.yahoo.com, 2018)
The performance of Oil Search Limited is mainly restricted due to the low oil prices,
which was present in the market. However, the performance mainly increased after
September, where the index also rose, which directly helps in generating higher revenue for
the investors.
3.b Determining whether foreign stock prices are highly correlated:
Figure 5: Depicting the correlation of international stocks
(Source: Au.finance.yahoo.com, 2018)
The foreign stocks are not highly correlated, as one of the strock performed
exponentially well in comparison with the other. However, both the stock provided adequate
return from investment, while OM holding provided the highest return for its shareholders.
This indicates that both stocks are not correlated with each other instead they are performing
at their own space.

ACC306
11
3.c Determining whether performance of foreign stock is better than Australian stock:
Figure 6: Comparing performance of international stock with ASX
(Source: Au.finance.yahoo.com, 2018)
From the evaluation of the above figure it could be understood that the stock
performance is not driven by the ASSX market. Instead the company’s performance has
mainly increased their overall share price in the ASX market. The performance of the
company is not based on the ASX market as seen the above figure.
Figure 7: Comparing performance of international stock with ASX
(Source: Au.finance.yahoo.com, 2018)
⊘ This is a preview!⊘
Do you want full access?
Subscribe today to unlock all pages.

Trusted by 1+ million students worldwide
1 out of 18
Related Documents
Your All-in-One AI-Powered Toolkit for Academic Success.
+13062052269
info@desklib.com
Available 24*7 on WhatsApp / Email
Unlock your academic potential
Copyright © 2020–2026 A2Z Services. All Rights Reserved. Developed and managed by ZUCOL.


