Investment Analysis Report: Stock Performance & Portfolio Analysis

Verified

Added on  2022/12/15

|3
|531
|433
Report
AI Summary
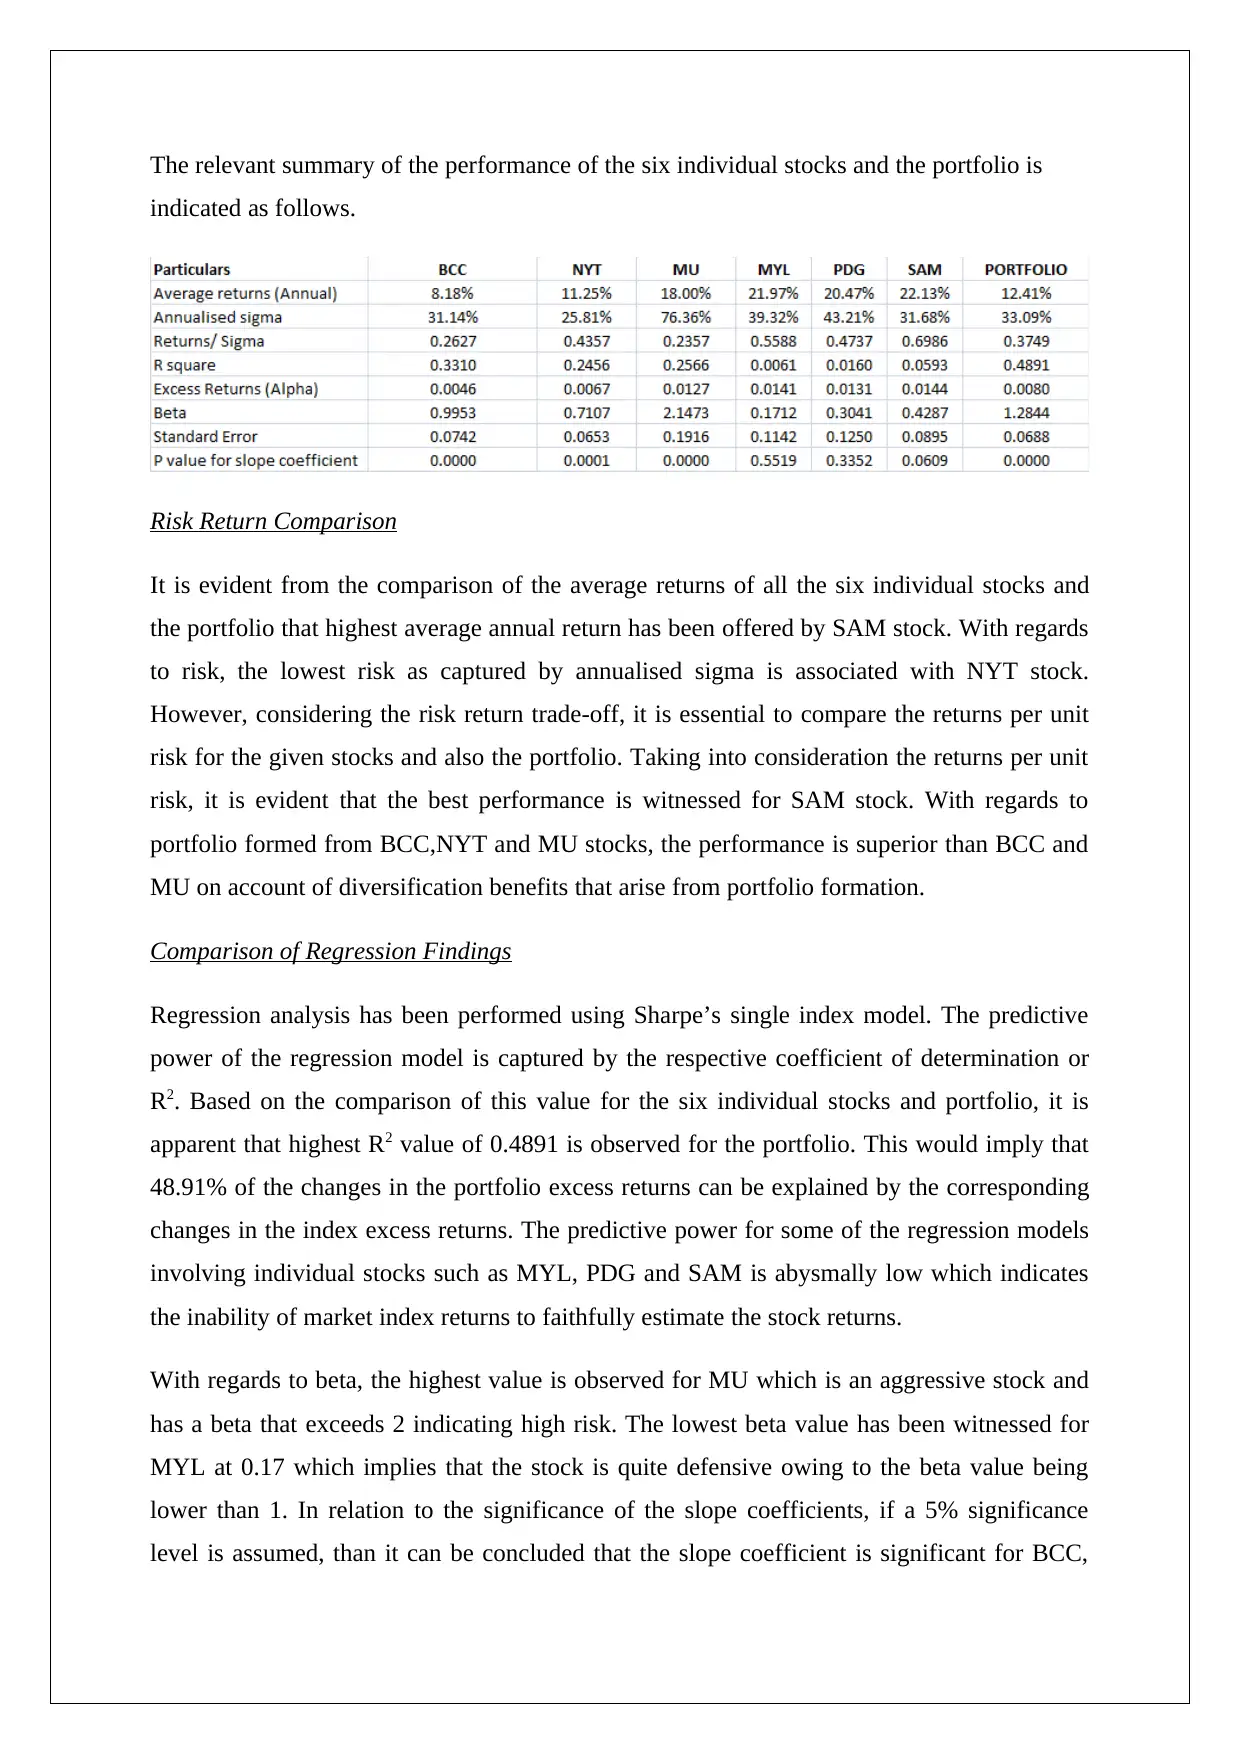
This report provides a detailed analysis of the performance of six individual stocks and a portfolio, focusing on risk-return comparisons and regression analysis. The highest average annual return was offered by SAM stock, while NYT exhibited the lowest risk. SAM stock demonstrated the best performance considering returns per unit risk. Regression analysis, using Sharpe's single index model, revealed a high R2 value for the portfolio, indicating strong predictive power. The analysis also examined the significance of regression parameters, highlighting the impact of beta and the intercept value on stock performance. The report concludes with a comparison of the regression results and an assessment of the overall strength of the regression models for the individual stocks and the portfolio.
Document Page
INVESTMENT ANALYIS
STUDENT ID:
[Pick the date]
tabler-icon-diamond-filled.svg

Paraphrase This Document

Need a fresh take? Get an instant paraphrase of this document with our AI Paraphraser
Document Page
The relevant summary of the performance of the six individual stocks and the portfolio is
indicated as follows.
Risk Return Comparison
It is evident from the comparison of the average returns of all the six individual stocks and
the portfolio that highest average annual return has been offered by SAM stock. With regards
to risk, the lowest risk as captured by annualised sigma is associated with NYT stock.
However, considering the risk return trade-off, it is essential to compare the returns per unit
risk for the given stocks and also the portfolio. Taking into consideration the returns per unit
risk, it is evident that the best performance is witnessed for SAM stock. With regards to
portfolio formed from BCC,NYT and MU stocks, the performance is superior than BCC and
MU on account of diversification benefits that arise from portfolio formation.
Comparison of Regression Findings
Regression analysis has been performed using Sharpe’s single index model. The predictive
power of the regression model is captured by the respective coefficient of determination or
R2. Based on the comparison of this value for the six individual stocks and portfolio, it is
apparent that highest R2 value of 0.4891 is observed for the portfolio. This would imply that
48.91% of the changes in the portfolio excess returns can be explained by the corresponding
changes in the index excess returns. The predictive power for some of the regression models
involving individual stocks such as MYL, PDG and SAM is abysmally low which indicates
the inability of market index returns to faithfully estimate the stock returns.
With regards to beta, the highest value is observed for MU which is an aggressive stock and
has a beta that exceeds 2 indicating high risk. The lowest beta value has been witnessed for
MYL at 0.17 which implies that the stock is quite defensive owing to the beta value being
lower than 1. In relation to the significance of the slope coefficients, if a 5% significance
level is assumed, than it can be concluded that the slope coefficient is significant for BCC,
Document Page
NYT, MU and the PORTFOLIO. For the other three stocks, the slop coefficient is not
significant which would imply that the returns on the stock is not reliably determined by the
corresponding movements on the index and therefore other relevant parameters need to be
added to the regression model.
The intercept value highlighted the risk adjusted excess return which is highest for the SAM
stock and hints at the superior performance of the stock in comparison to the other individual
stocks and the portfolio. The standard error highlights the deviation between the actual
returns and the estimated returns from the regression model for the various stocks and
portfolio. A lower error value would be preference as it indicates that the regression model is
able to accurately predict the excess returns of the stock. Minimum standard error is observed
for NYT stock.
chevron_up_icon
1 out of 3
circle_padding
hide_on_mobile
zoom_out_icon
[object Object]