Stock Performance Analysis: Assessing Risk-Return for Investment
VerifiedAdded on 2023/06/03
|10
|1152
|422
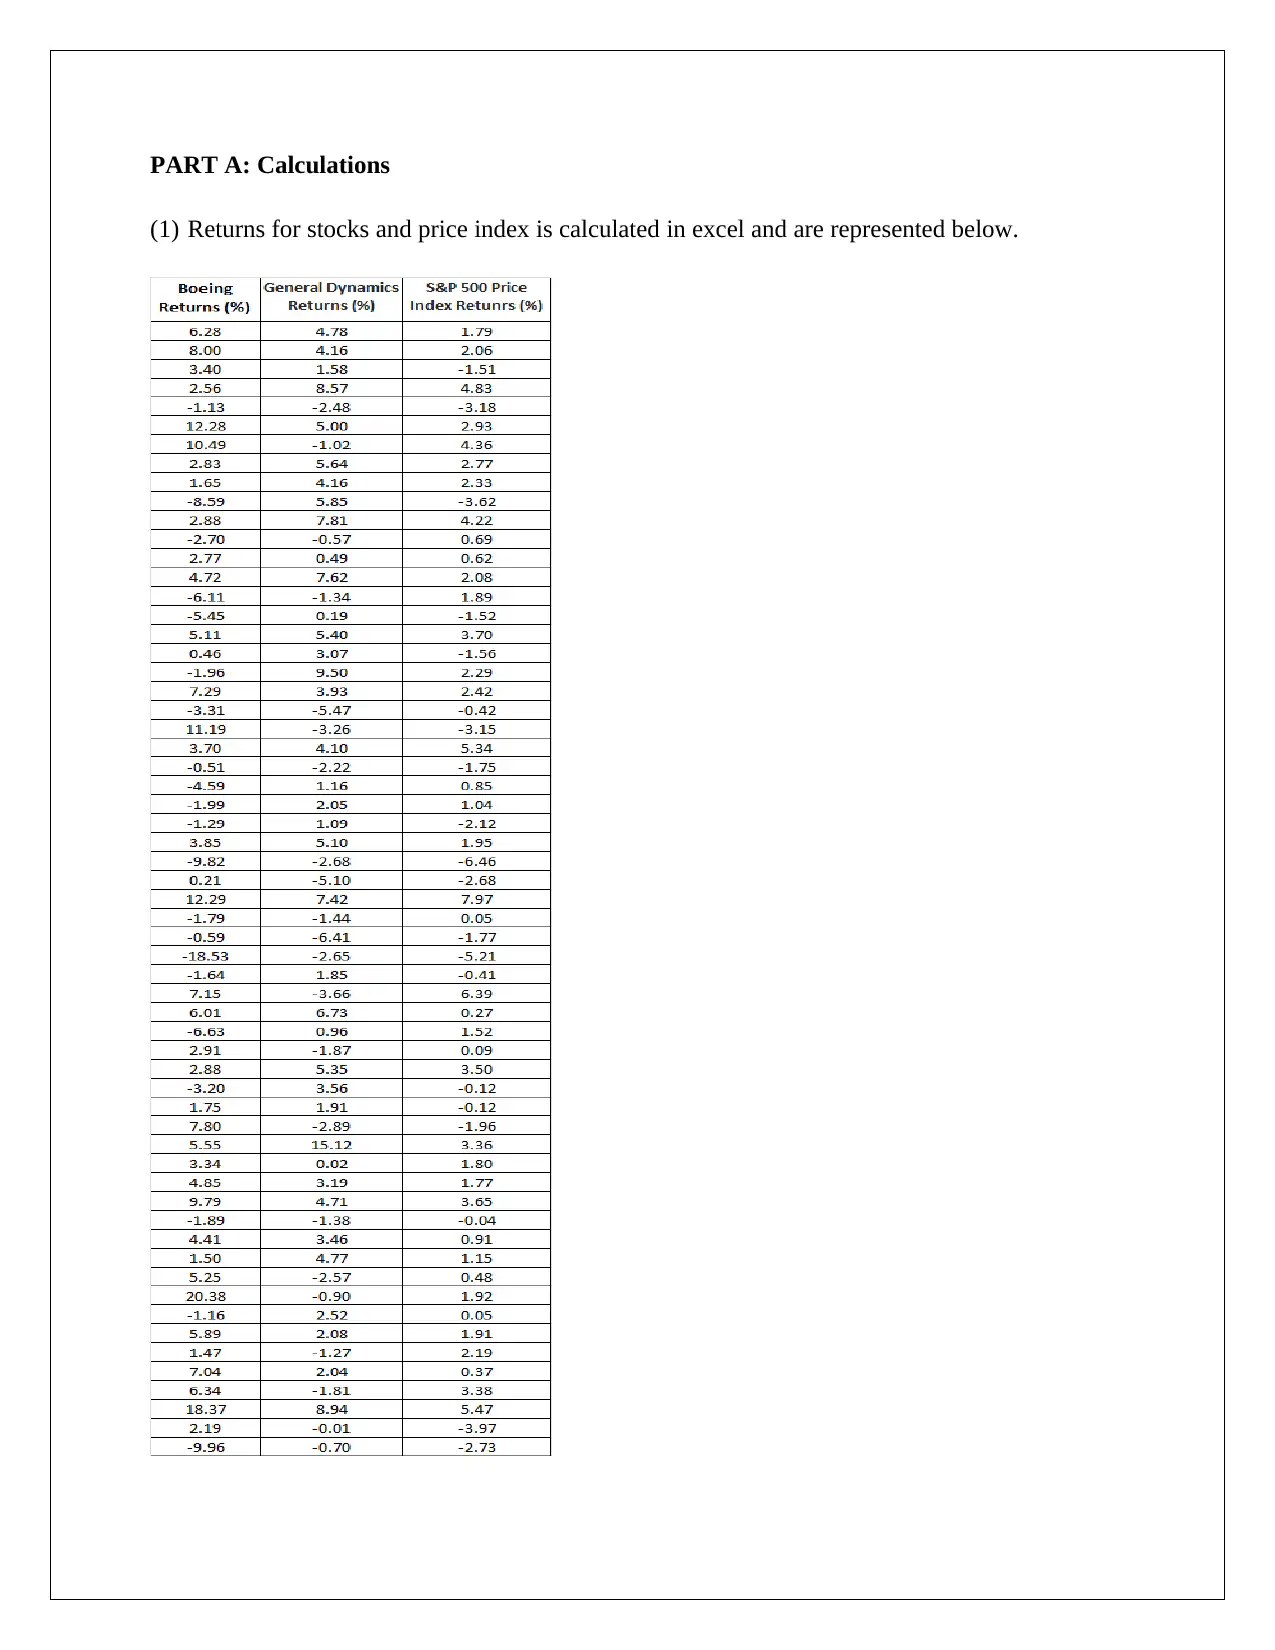
Report
AI Summary
This report provides a comprehensive analysis of two stocks, General Dynamics (GD) and Boeing, to determine which offers a better risk-return profile for investment. The analysis includes calculations of stock returns, Jarque-Bera tests for normality, hypothesis testing to compare mean returns and risk levels, and CAPM model implementation to estimate beta and assess the relationship between excess market returns and stock excess returns. The findings indicate that GD stock may be superior due to offering similar returns at a significantly lower risk compared to Boeing. The report also interprets the statistical results, including beta values, R-squared, and confidence intervals, to provide a well-rounded recommendation for the client.

1 out of 10
Related Documents
![Statistical Analysis of Business and Finance Data - [Semester]](/_next/image/?url=https%3A%2F%2Fdesklib.com%2Fmedia%2Fbusiness-finance-statistics-hypothesis-interpretation_page_2.jpg&w=256&q=75)


Your All-in-One AI-Powered Toolkit for Academic Success.
+13062052269
info@desklib.com
Available 24*7 on WhatsApp / Email
![[object Object]](/_next/static/media/star-bottom.7253800d.svg)
Copyright © 2020–2026 A2Z Services. All Rights Reserved. Developed and managed by ZUCOL.