Financial Markets: Portfolio Construction, Risk, and Return Analysis
VerifiedAdded on 2023/05/30
|9
|1777
|51
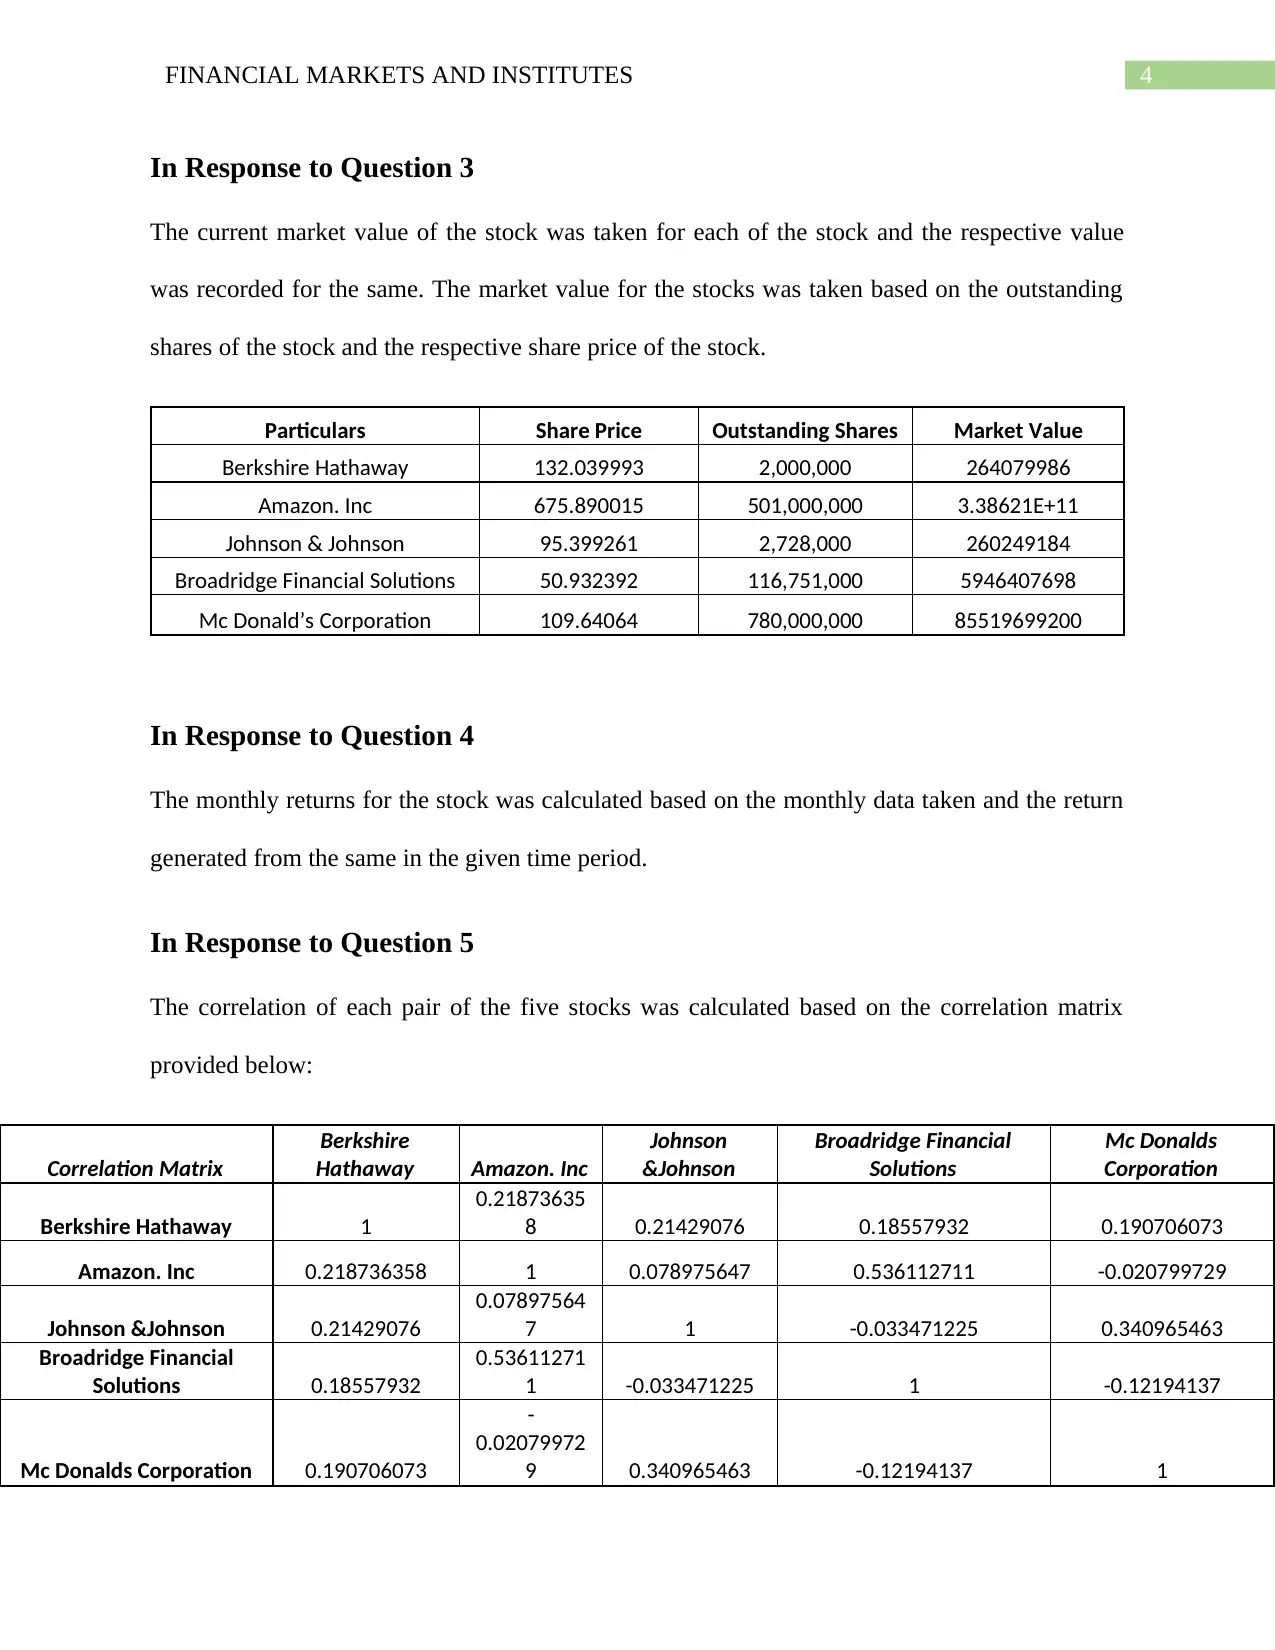
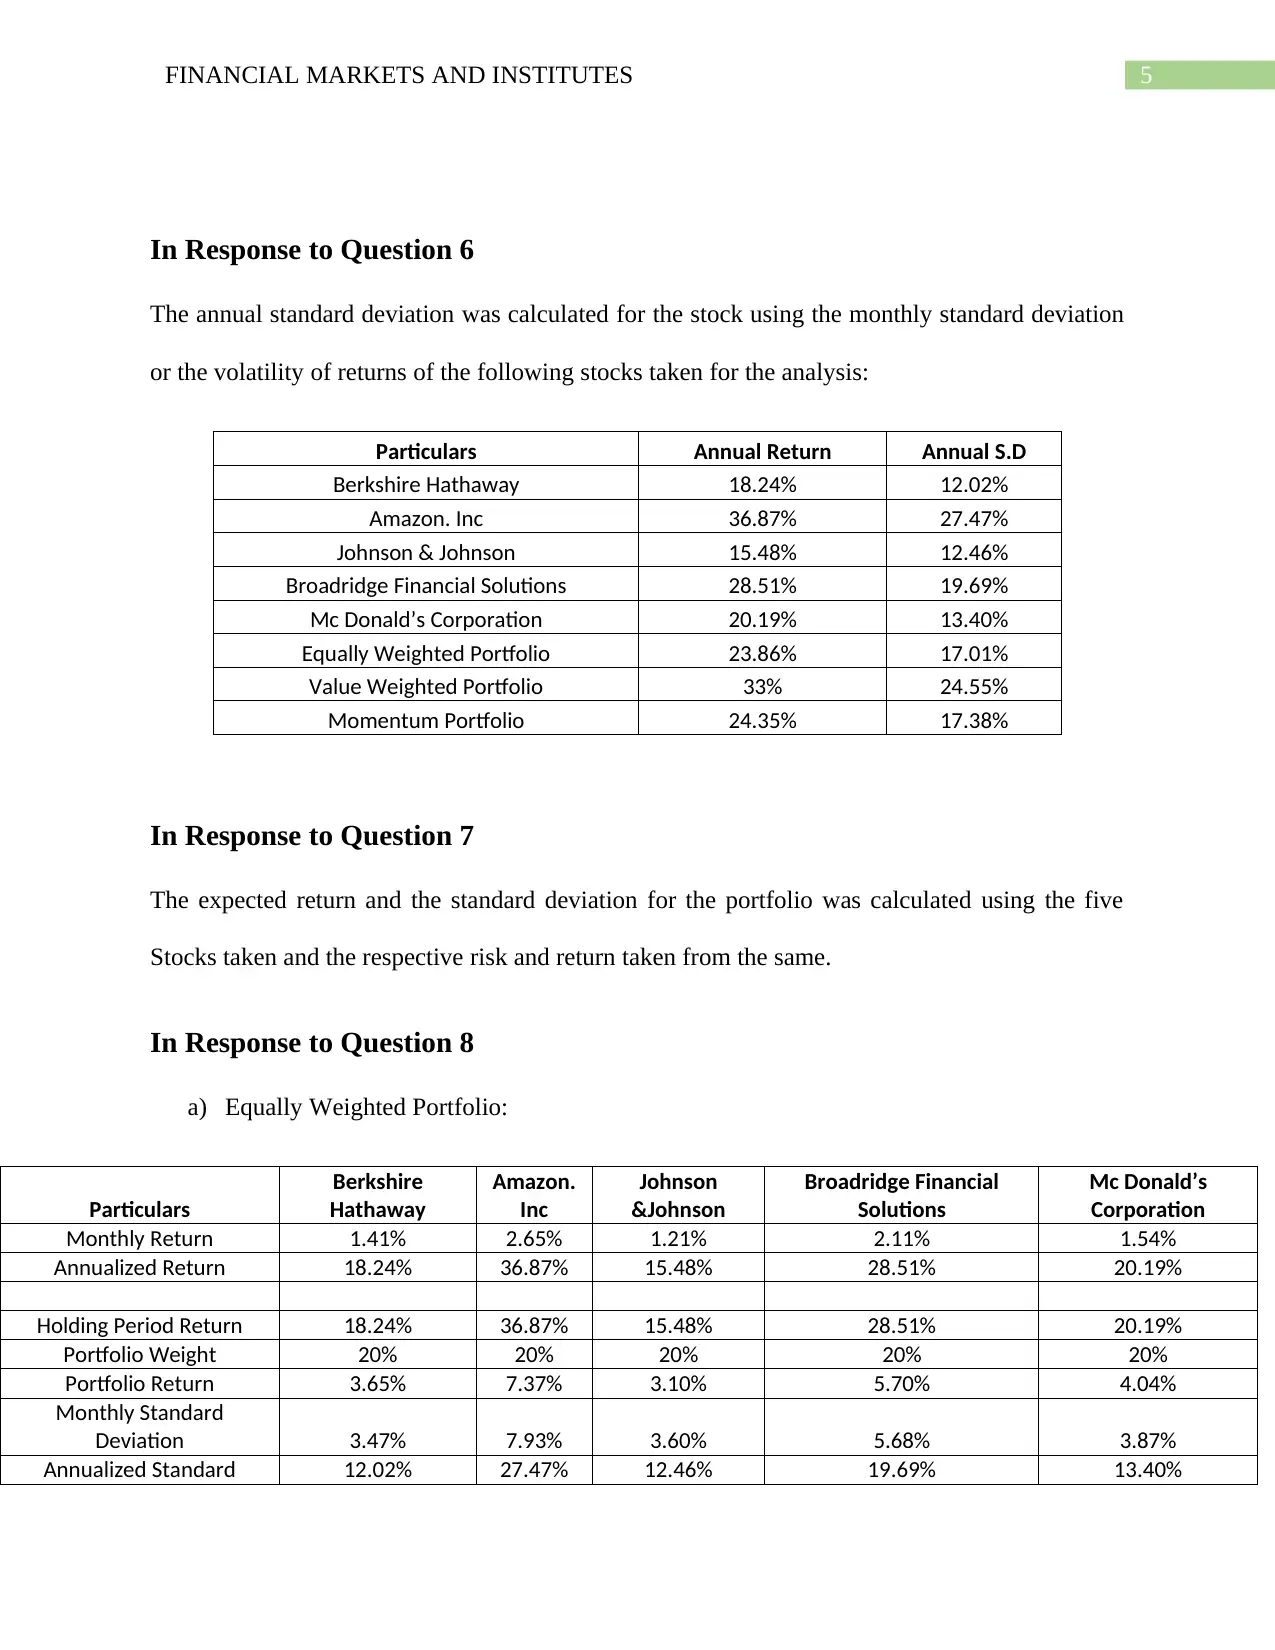
Homework Assignment
AI Summary
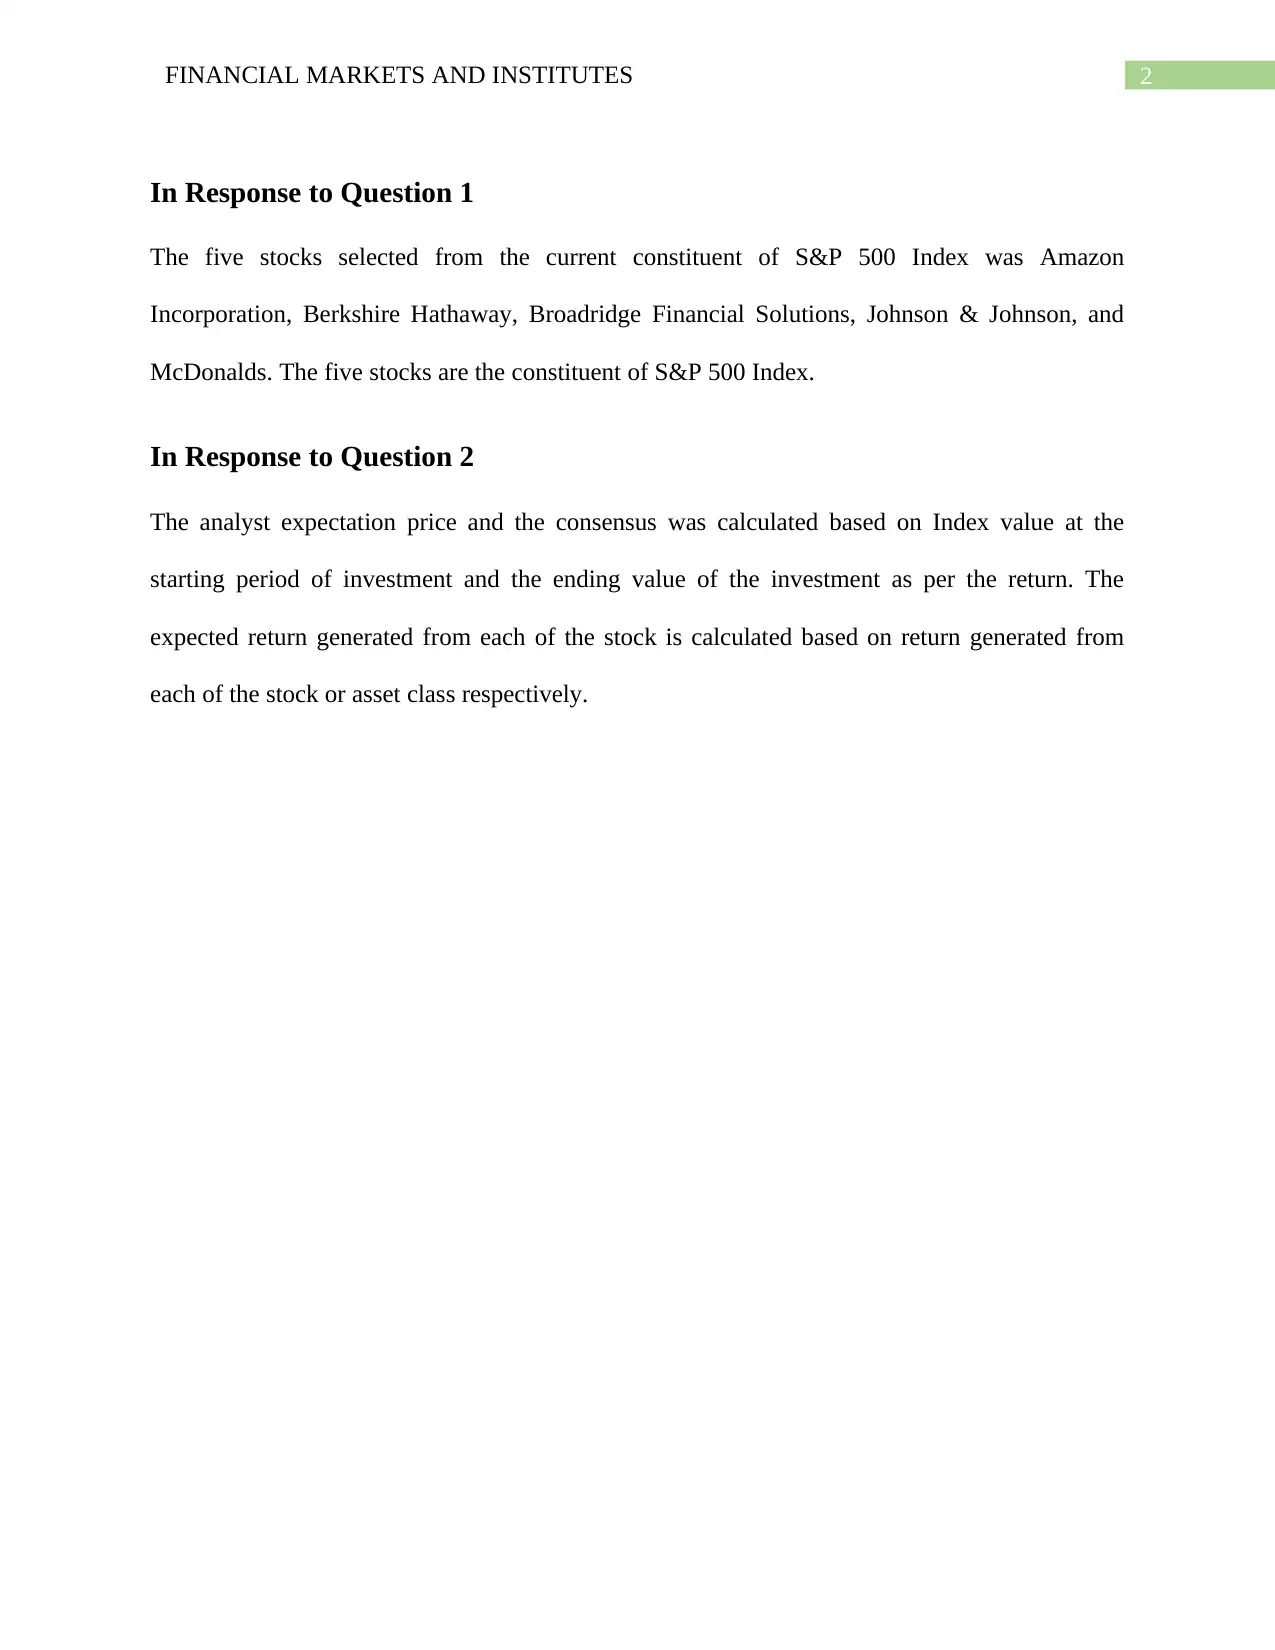
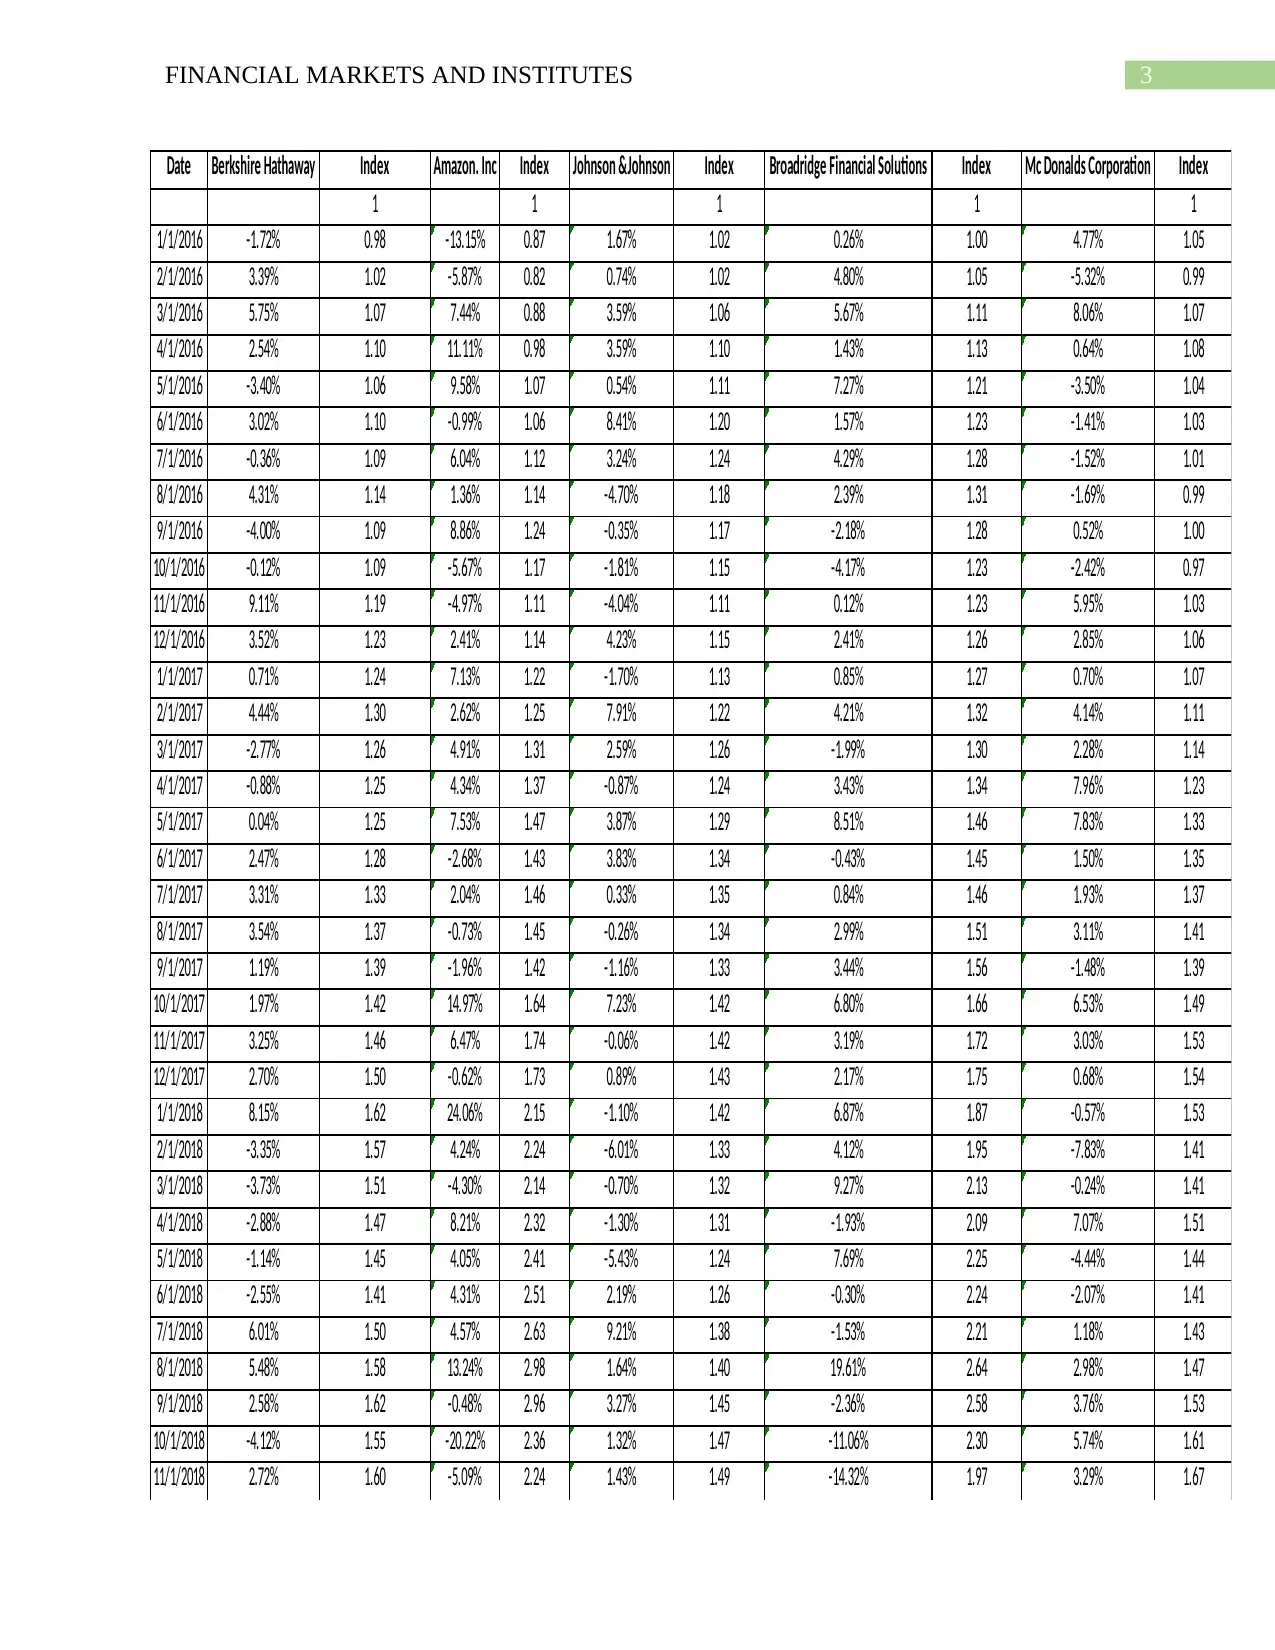
This assignment focuses on analyzing investment risk and return within financial markets, specifically using stocks from the S&P 500 index. It involves calculating expected returns, standard deviations, and correlations for selected stocks like Amazon, Berkshire Hathaway, and Johnson & Johnson. The analysis extends to constructing and evaluating different portfolio strategies, including equally weighted, market value-weighted, and momentum-based portfolios. The assignment also covers calculating monthly and annualized excess returns, and Sharpe ratios. Ultimately, the goal is to understand the trade-offs between risk and return in portfolio management and to visually represent investment alternatives through risk-return graphs. This document is available on Desklib, a platform offering study tools and resources for students.
1 out of 9


Your All-in-One AI-Powered Toolkit for Academic Success.
+13062052269
info@desklib.com
Available 24*7 on WhatsApp / Email
![[object Object]](/_next/static/media/star-bottom.7253800d.svg)
Copyright © 2020–2026 A2Z Services. All Rights Reserved. Developed and managed by ZUCOL.