Financial Analysis: Stock Valuation of API Case Study Report
VerifiedAdded on 2023/06/04
|12
|3345
|282
Report
AI Summary
This report provides a comprehensive stock valuation case study of Australian Pharmaceutical Industries (API), employing various financial models such as the Dividend Discount Model (DDM), Residual Income Model (RIM), Residual Operating Income Model (ROIM), and Free Cash Flow Model (FCFM) to estimate the firm's share value and compare it to its current stock price. The analysis includes a five-year forecast of the company's financial performance, sensitivity analysis on key forecasting assumptions using the Residual Operating Income Model, and a discussion of potential opportunities for improvement and challenges for the firm, presented as management consulting advice. The report uses historical data from API's annual reports to forecast future financial ratios and assesses whether the stock is undervalued or overvalued based on the valuation models. It also explores strategies for API to enhance its efficiency, product development, and capital mobilization techniques.
1
Stock Valuation: a case study of Australian Pharmaceutical Industries
Stock Valuation: a case study of Australian Pharmaceutical Industries
Paraphrase This Document
Need a fresh take? Get an instant paraphrase of this document with our AI Paraphraser
2
Table of Contents
Forecast......................................................................................................................................3
Valuation....................................................................................................................................3
DDM......................................................................................................................................4
RIM........................................................................................................................................4
ROIM.....................................................................................................................................5
FCFM.....................................................................................................................................5
Sensitive analysis.......................................................................................................................6
Management consulting advice..................................................................................................6
Reference list..............................................................................................................................8
Appendices...............................................................................................................................11
3
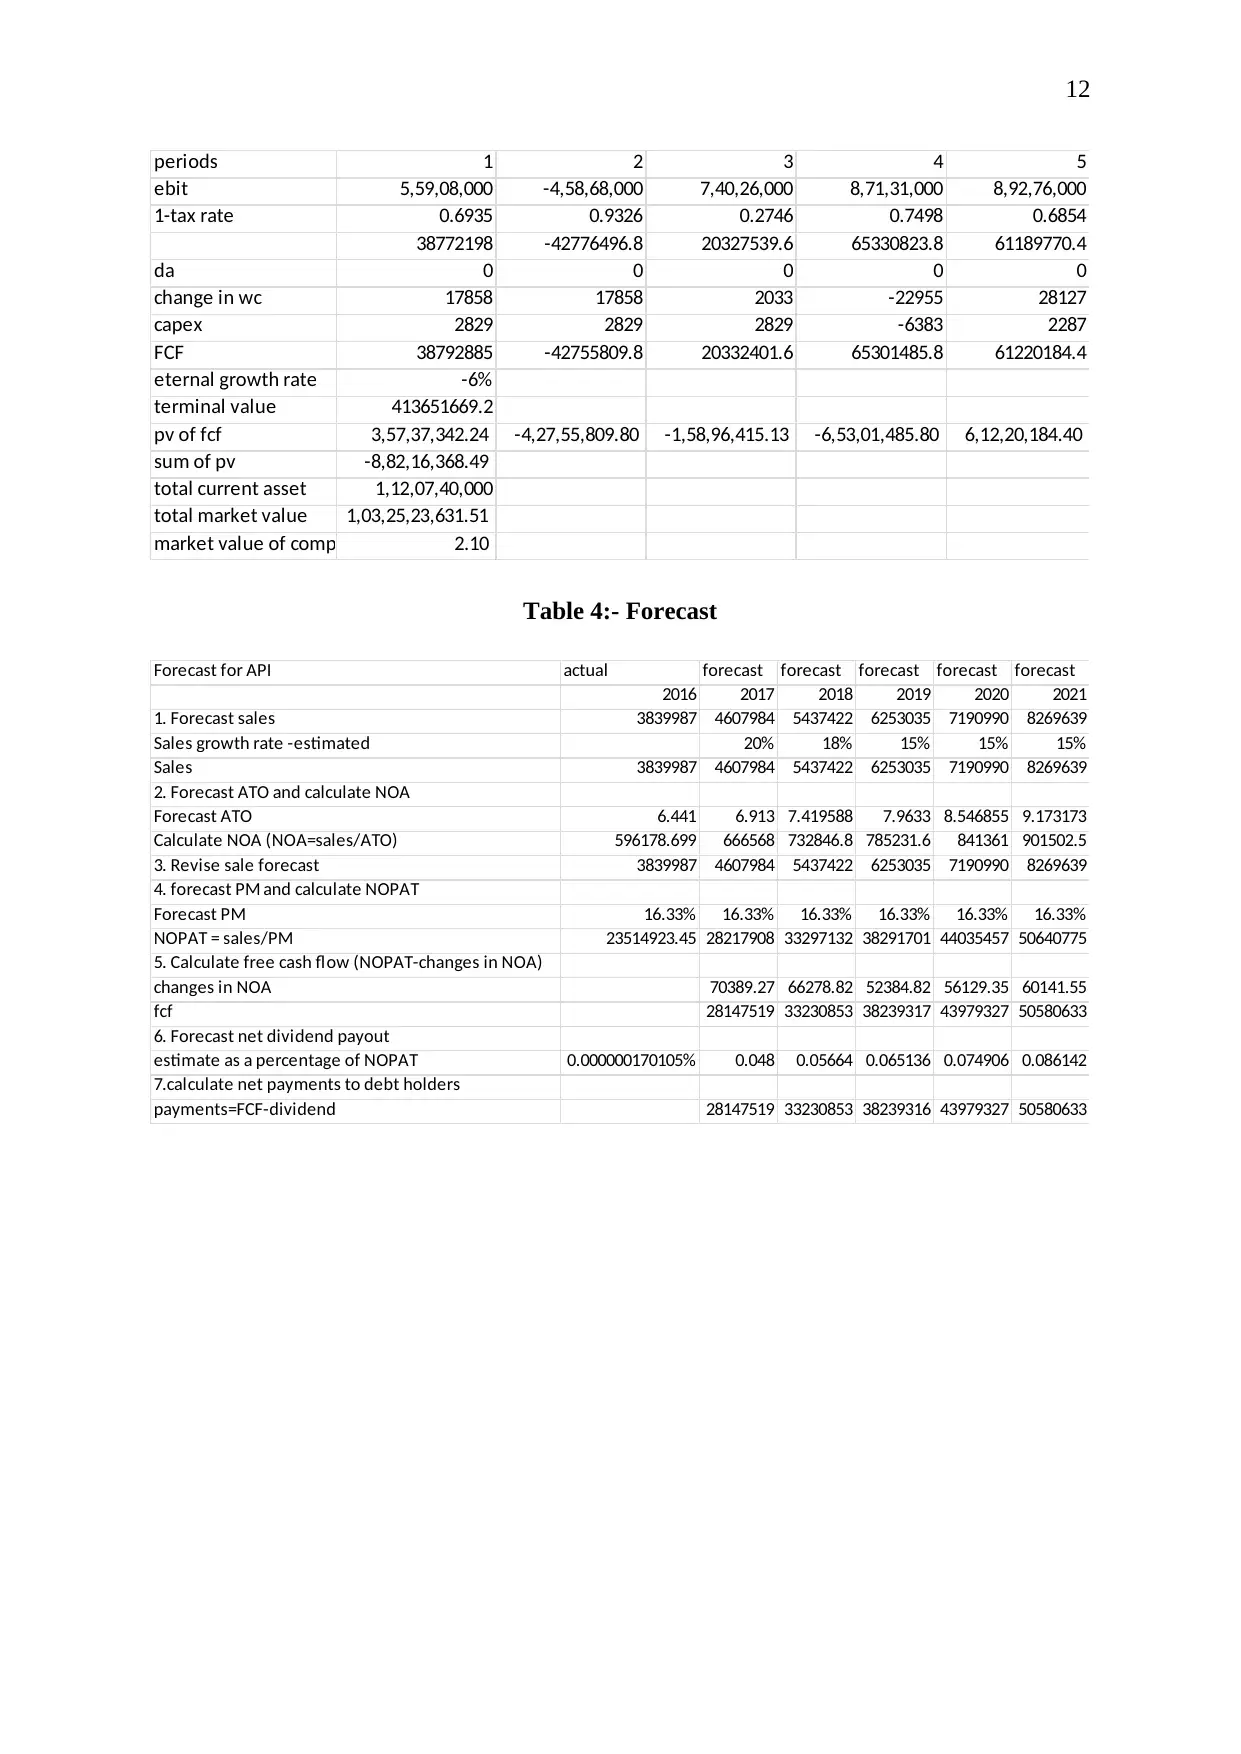
Forecast
Sales and other ratios of the company have been forecasted for a period of 5 years. The actual
year upon which the estimators calculated is 2016. In this case the discounted growth rate has
been calculated for the historic data from 2013-2017. Sales, income ratios and many others
ratio has been forecasted in order to observe the health of the company in future periods.
Refer to appendix table number for the calculations that has been carried out for forecasting
the future periods. The sales will be increasing in 15% on average every year. The ATO is
increasing at seven percent on average every year. The net operating profit after tax is at a
rate of fifteen percent per year. In the historic data the PM of the company was wobbly but
after the new reforms and the new product launched the company has been estimated to
maintain constant growth rate of 16.33% (API, 2018b).
In the initial calculation of the financial ratios of the historic data was used for the
calculation. During the forecast the average growth rates discounted to all historic period has
been utilised as the estimate to calculate the future financial ratios of the company. The
growth rate has been discounted on the basis of total years for the historical data four years.
This factor is then added to previous year growth rate.
Valuation
The present price of API in the Australian stock exchange is one dollar and sixty-five cents.
The present research has used various valuation models to estimate the price of the share and
check whether the stock is undervalued or overvalued. If the estimate of the stock is above
the marketable price then the stock is undervalued, while when the estimate is lower than the
actual price then the stock is termed as overvalued. Investors usually sell away the
overvalued stocks while buys undervalued stock. Investors tend to do this because the stocks
which are undervalued have the potential to grow in the future. With time the demand of such
stocks increases, which increases the stock price. Soon the stock becomes overvalued and this
lowers the price of the stock by increasing its supply. Thus it can be inferred that investors
are sceptic towards overvalued stocks. Investors use different valuation models for valuing
the stocks. Presently four valuation models have been used, the four valuation model are
dividend discount model (DDM), residual income model (RIM), residual operating income
model (ROIM) and free cash flow model (FCFM). The data mining was conducted from the
⊘ This is a preview!⊘
Do you want full access?
Subscribe today to unlock all pages.
Trusted by 1+ million students worldwide
4
last five annual reports of the company available on its website that is from 2016-17 to 2013-
14 (API, 2018a).
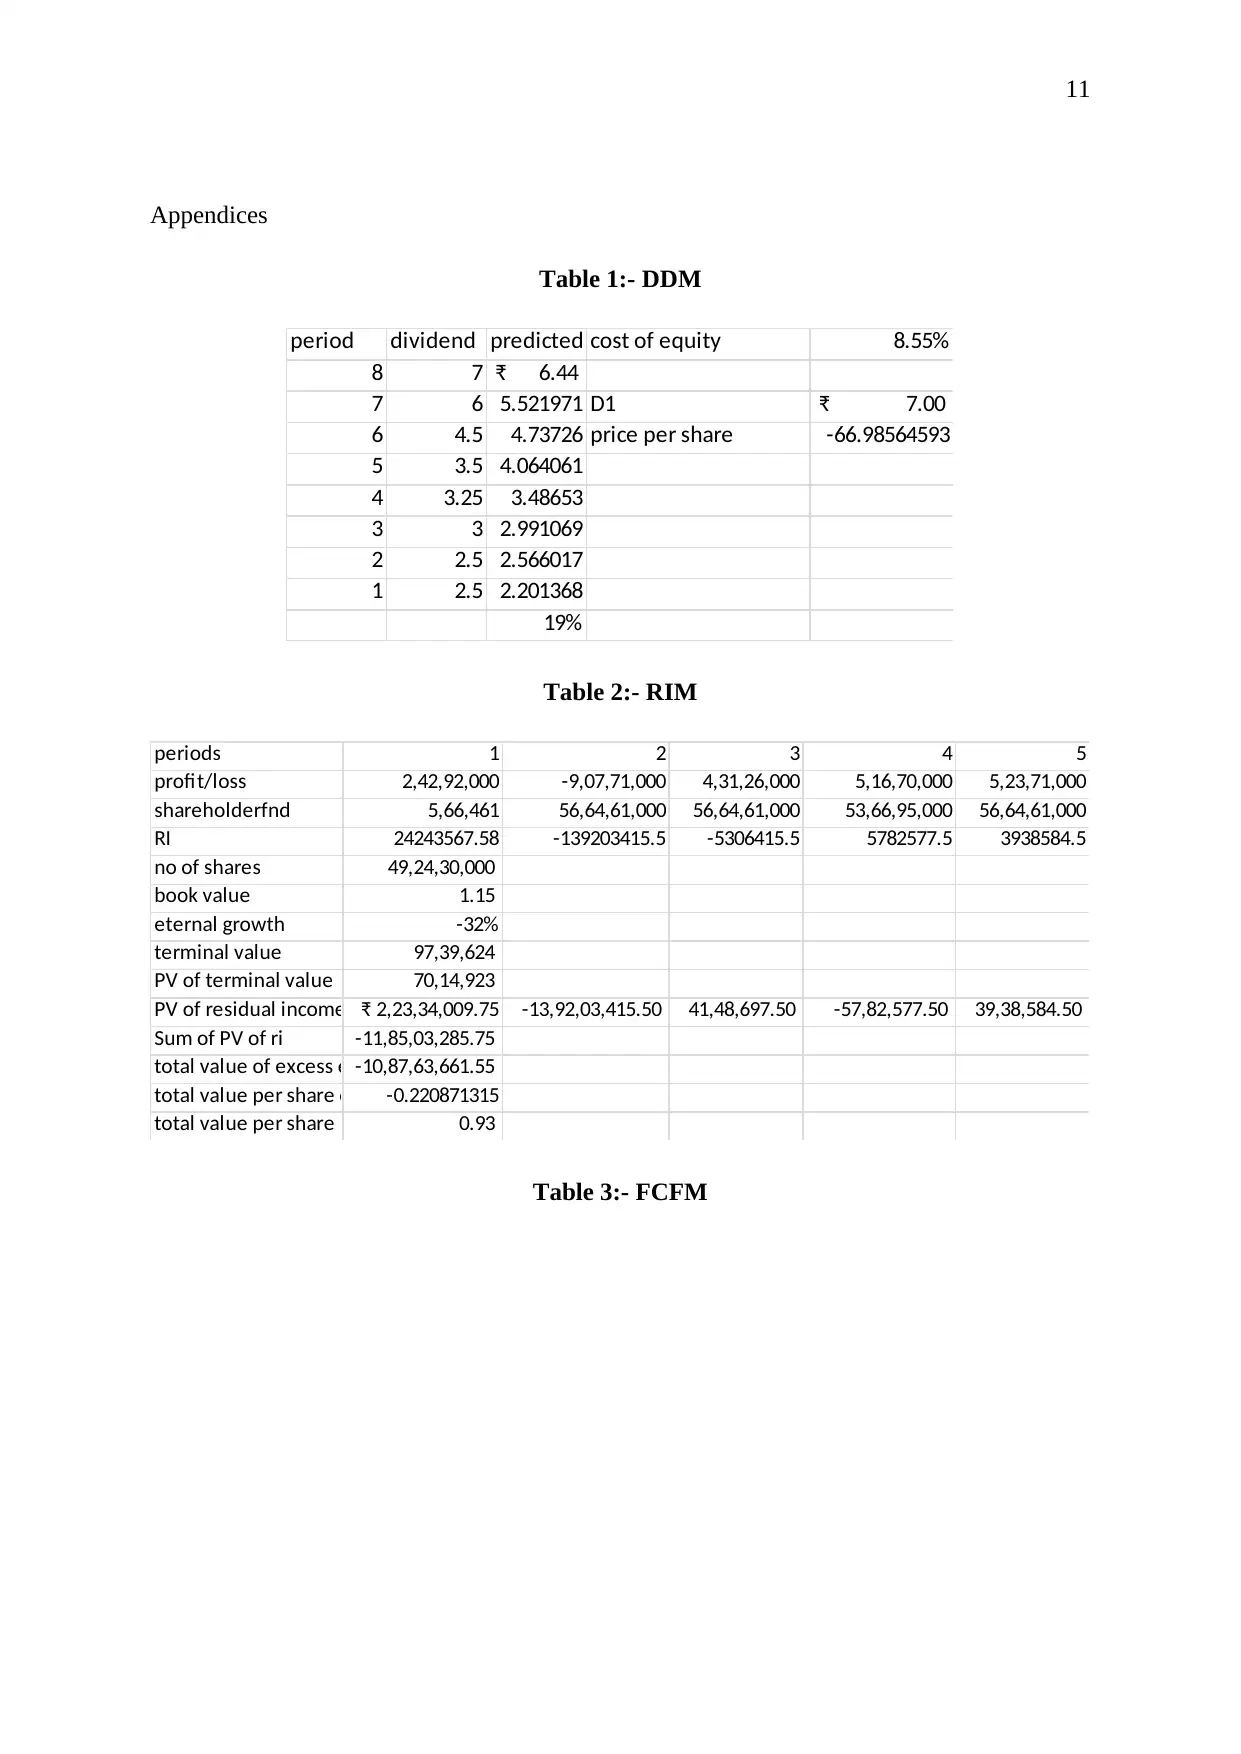
DDM
DDM is the basic valuation model that is used to value a firm’s stock. The theory behind this
model is that the stock is worth of its entire future dividend payments, discounted to their
present value. The formula can be written down as P = Dₒ (1+g)/(r-g) (Mehta and Shah,
2018; Penman, 1998; Penman and Sougiannis, 1998.). Here P stands for the price of the
stock, Dₒ represents the initial dividend payment made by the firm, g is termed as the
constant growth rate of the dividends and r is the desired rate of return. The basic assumption
of this model is that dividends grow at a constant growth rate throughout its life.
In case for API the DDM is not the best suited model to derive the price of the stock. This is
because the growth rate of the dividend (19%) is much higher than the desired growth rate of
the stock (API, 2018b; API, 2017; API, 2016; API, 2015; API, 2014). As the investors want
to cover up their expense of equity, that is why it has been assumed that the cost of equity is
the desired rate of return. In this case the cost of equity for the investors is 8.55%. Observing
the rates it can be inferred that r is lesser than g (r<g). Therefore, the denominator of the ratio
becomes negative and an infinite value is obtained as the result of this ratio, which is not at
all desirable (Ibrahim, Topowijono and Nurlaily, 2018). Moreover, in case for API the
dividend growth rate is not constant throughout the time period, this is another reason that
makes DDM unsuitable for the stock valuation of API.
RIM
It is another approach of valuating the stocks of a company. The term residual denotes the
excess opportunity cost which is measured in relation to the book value of shareholders’
equity (Kaszas and Janda, 2018). This approach is similar to the model of economic value
added. Thus residual income is the level by which the firm has outperformed the expectations
of the investors. Thus the residual income is calculated by subtracting the shareholders’ funds
from the gross profit of the firm (Bergeron, Gueyie and Sedzro, 2018). The present value of
the residual income is calculated and this reveals the expected price of the stock (Saleh,
2017).
In this case also the cost of equity has been assumed as the expected rate of return for the
investors. According to this method, the stock price of API happened to be ninety-three
last five annual reports of the company available on its website that is from 2016-17 to 2013-
14 (API, 2018a).
DDM
DDM is the basic valuation model that is used to value a firm’s stock. The theory behind this
model is that the stock is worth of its entire future dividend payments, discounted to their
present value. The formula can be written down as P = Dₒ (1+g)/(r-g) (Mehta and Shah,
2018; Penman, 1998; Penman and Sougiannis, 1998.). Here P stands for the price of the
stock, Dₒ represents the initial dividend payment made by the firm, g is termed as the
constant growth rate of the dividends and r is the desired rate of return. The basic assumption
of this model is that dividends grow at a constant growth rate throughout its life.
In case for API the DDM is not the best suited model to derive the price of the stock. This is
because the growth rate of the dividend (19%) is much higher than the desired growth rate of
the stock (API, 2018b; API, 2017; API, 2016; API, 2015; API, 2014). As the investors want
to cover up their expense of equity, that is why it has been assumed that the cost of equity is
the desired rate of return. In this case the cost of equity for the investors is 8.55%. Observing
the rates it can be inferred that r is lesser than g (r<g). Therefore, the denominator of the ratio
becomes negative and an infinite value is obtained as the result of this ratio, which is not at
all desirable (Ibrahim, Topowijono and Nurlaily, 2018). Moreover, in case for API the
dividend growth rate is not constant throughout the time period, this is another reason that
makes DDM unsuitable for the stock valuation of API.
RIM
It is another approach of valuating the stocks of a company. The term residual denotes the
excess opportunity cost which is measured in relation to the book value of shareholders’
equity (Kaszas and Janda, 2018). This approach is similar to the model of economic value
added. Thus residual income is the level by which the firm has outperformed the expectations
of the investors. Thus the residual income is calculated by subtracting the shareholders’ funds
from the gross profit of the firm (Bergeron, Gueyie and Sedzro, 2018). The present value of
the residual income is calculated and this reveals the expected price of the stock (Saleh,
2017).
In this case also the cost of equity has been assumed as the expected rate of return for the
investors. According to this method, the stock price of API happened to be ninety-three
Paraphrase This Document
Need a fresh take? Get an instant paraphrase of this document with our AI Paraphraser
5
Australian cents. The present market value of the stock is one Australian dollar and sixty-five
cents. Thus it can be evaluated that stock is overvalued in this period. Thus it better for the
investor to sell this particular stock right now.
ROIM
It is another method of valuating the stocks of a firm, it also analyses the sensitivity of the
core assumptions that has been used in other models (Hand, Coyne, Green and Zhang, 2017).
It is calculated by deducting the weighted average cost of capital times the net operating
assets of the earlier period from the net operating profit after tax.
FCFM
It is another process of evaluating businesses or projects. The underlying assumption in this
case is that, the value of the stock or the business is equal to the present value of the free cash
flow generated by the company (Bian, et al, 2018). The free cash flow of the company can be
calculated by using three different approaches.
In this case the free cash flow of API has been calculated through the earnings before interest
and tax (EBIT) approach (Kadioglu, Kilic and Yilmaz, 2017). In this case the stock has been
undervalued from its estimate. According to the model the price of the stock should be two
dollar and ten cents. The problem in this approach was that the company did not disclose
their depreciation rate on their assets (Olsson and Levin, 2015). This can be the prime reason
for such high stock value.
Thus all the four models are showing the value of the stock in between one dollar to two
dollar. Thus the investors in turmoil position, where they cannot decide whether to keep the
stock or sell it. Thus the nature of the investors will lead them to focus on the on the value
derived from these models. The investors who are of risk-averse will focus on the value
derived from RIM and will try to sell their stocks at this present moment, as they can some
capital gain by selling the stocks in this present period. The investors those are optimistic or
risk lovers will focus on the value derived from FCFE model. They will wait for the stocks to
rise above the expected value in the future and then the investors will sell their stocks for
achieving higher capital gain.
6
Sensitive analysis
ROIM has been used for evaluate the sensitive test on the three valuation models used for
valuing the stocks of API. Valuing models have appropriated the discount rate that has been
taken as the average growth rate of ratios (Hakim and Sugianto, 2018). Investors would like
to cover the cost they have paid to own the equity that is expense of equity, which leads to the
assumption that the cost of equity is the desired rate of return. In residual model it is assumed
that the income is calculated by subtracting the shareholders’ funds from the gross profit of
the firm gives the residual expectation of the shareholders that has either fulfilled or missed.
The underlying assumption in the case for free cash flow model is that, the value of the stock
or the business is equal to the present value of the free cash flow generated by the company.
Free cash flow considers all the liquid assets that is available to any company, thus it can
treated as the indicator of the stock value of a firm. The free cash flow has been discounted in
order to calculate the present value of the cash flow. All these assumptions of different
models has been tested by sensitivity analysis.
Management consulting advice
API is in the health care industry, and healthcare industry is one of the fastest growing
industries in the world, which is something around seventy-six percent (Martin, Josephson,
Vadakkepatt and Johnson, 2018). Thus the company has also very high potential to grow in
the future. The company has pretty firm financial pillars. The ROE of the company after
receiving the jolt in 2015, it has steadily increased and is maintaining its levels in the present
state too. The ATO of the company has kept a constant increase throughout the time period.
The PM of the company is also increasing with time. The company is also increasing their
storage houses and also their distribution process but this is not getting reflected in their
profit margin because the expense for maintaining these extra services is taking a heavy toll
on the company (Gereffi, 2017). Thus the company is efficient in turning their operations into
profits at the end of every year.
So, it is advisable to increase the efficiency in maintaining their inventories and other
distribution systems. Moreover the company should focus on developing their products that is
the company needs to invest in their research and development department. Otherwise the
company can also increase its product base to medical consumables like syringes or surgical
⊘ This is a preview!⊘
Do you want full access?
Subscribe today to unlock all pages.
Trusted by 1+ million students worldwide
7
cotton etc. Developing new products will create a roar in the market which will help the stock
prices to rise, this way the company increase their return on equity to another level.
Moreover, the company only utilizes debt funds or ordinary shares to raise capital. The
company is not venturing into other capital mobilizing techniques that incur low cost. The
company enter into option trading. The company should issue other forms of equities like
convertible share, preference shares (Pilon and Hadjielias, 2017). This type of shares is more
volatile and requires less cost on the parts of the investor. This is another way to increase
their earrings.
In order to increase their efficiency performance tests should be conducted and amendments
should be conducted wherever is possible. The growth in the liquidity ratio is delivering
positive vibes to the investors; this is the reason for the increase in number of shareholders of
the company every year. But the efficiency in the operation management is not increasing,
which is evident from the increase in warehouse maintenance cost due to increase in
inventories. Thus the company should follow just in delivery system. This system is less
wasteful, and lowers the inventory concentration in the warehouses. This will lower the cost
and increase the efficiency of the company. This increase in efficiency will eventually get
reflected in the profit margin of the company and also in the dividend.
Paraphrase This Document
Need a fresh take? Get an instant paraphrase of this document with our AI Paraphraser
8
Reference list
API, 2014. Annual Report. [online] Available at
<http://www.api.net.au/wp-content/uploads/2015/10/2014-Annual-report.pdf> [Accessed 8
October 2018]
API, 2015. Annual Report. [online] Available at
<http://www.api.net.au/wp-content/uploads/2015/12/5-Final-ASX-API-Annual-Report-2015-
4-Dec-2015.pdf> [Accessed 8 October 2018]
API, 2016. Annual Report. [online] Available at
<http://www.api.net.au/wp-content/uploads/2016/12/FINAL-API-Annual-Report-2016-web-
ready.pdf> [Accessed 8 October 2018]
API, 2017. Annual Report. [online] Available at
<http://www.api.net.au/wp-content/uploads/2017/12/3-API-Annual-Report-2017.pdf>
[Accessed 8 October 2018]
API, 2018a. Annual Reports - API. [online] Available at
<http://www.api.net.au/investor/annual-reports/ > [Accessed 8 October 2018]
API, 2018b. [online] Available at <http://www.api.net.au/wp-content/uploads/2015/10/2013-
Annual-report.pdf> [Accessed 8 October 2018]
Bergeron, C., Gueyie, J.P. and Sedzro, K., 2018. Consumption, residual income valuation,
and long-run risk. Journal of theoretical accounting research. 13(2), pp. 45-67.
Bian, Y., Lemoine, D., Yeung, T.G., Bostel, N., Hovelaque, V., Viviani, J.L. and Gayraud,
F., 2018. A dynamic lot-sizing-based profit maximization discounted cash flow model
considering working capital requirement financing cost with infinite production
capacity. International Journal of Production Economics. 196, pp.319-332.
Gereffi, G., 2017. The pharmaceutical industry and dependency in the Third World (Vol.
4964). 7th ed. New Jersey: Princeton University Press.
Hakim, L. and Sugianto, S., 2018. Determinant Profitability and Implications on the Value of
the Company: Empirical Study on Banking Industry in IDX. International Journal of
Economics and Financial Issues. 8(1), pp.205-216.
9
Hand, J.R., Coyne, J.G., Green, J.R. and Zhang, X.F., 2017. The use of residual income
valuation methods by US sell-side equity analysts. Journal of Financial Reporting. 2(1),
pp.1-29.
Ibrahim, R.T., Topowijono, T. and Nurlaily, F., 2018. Penerapan analisis fundamental dengan
dividend discount model (DDM) dan price earning ratio (per) untuk menilai intrinsik saham
(Studi pada Perusahaan Sektor Keuangan yang Terdaftar di Bursa Efek Indonesia Periode
2014-2016). Jurnal Administrasi Bisnis. 57(2), pp. 34-67.
Kadioglu, E., Kilic, S. and Yilmaz, E.A., 2017. Testing the Relationship between Free Cash
Flow and Company Performance in Borsa Istanbul. International Business Research. 10(5),
p.148.
Kaszas, M. and Janda, K., 2018. Indirect Valuation and Earnings Stability: Within-Company
Use of the Earnings Multiple. In The Impact of Globalization on International Finance and
Accounting. 25(5), pp. 161-172.
Martin, K.D., Josephson, B.W., Vadakkepatt, G.G. and Johnson, J.L., 2018. Political
Management, Research and Development, and Advertising Capital in the Pharmaceutical
Industry: A Good Prognosis?. Journal of Marketing. 82(3), pp.87-107.
Mehta, D. and Shah, S., 2018. Intrinsic Valuation by Two Stage Growth Model: Study of Oil
Marketing Companies in India. ANVESHAK-International Journal of Management. 7(1),
pp.152-171.
Olsson, P. and Levin, J., 2015. Discounted Cash Flow Models. Wiley Encyclopedia of
Management. 56(4), pp.1-2.
Penman, S.H. and Sougiannis, T., 1998. A comparison of dividend, cash flow, and earnings
approaches to equity valuation. Contemporary accounting research. 15(3), pp.343-383.
Penman, S.H., 1998. A synthesis of equity valuation techniques and the terminal value
calculation for the dividend discount model. Review of Accounting Studies. 2(4), pp.303-323.
Pilon, F. and Hadjielias, E., 2017. Strategic account management as a value co-creation
selling model in the pharmaceutical industry. Journal of Business & Industrial
Marketing. 32(2), pp.310-325.
⊘ This is a preview!⊘
Do you want full access?
Subscribe today to unlock all pages.
Trusted by 1+ million students worldwide

10
Saleh, W., 2017. Empirical estimation of the Residual Income Valuation Model: Profit-
Making vs. Loss-Making firms. Journal of Finance. 5(2), pp.14-31.
Saleh, W., 2017. Empirical estimation of the Residual Income Valuation Model: Profit-
Making vs. Loss-Making firms. Journal of Finance. 5(2), pp.14-31.
Paraphrase This Document
Need a fresh take? Get an instant paraphrase of this document with our AI Paraphraser
11
Appendices
Table 1:- DDM
period dividend predicted cost of equity 8.55%
8 7 6.44₹
7 6 5.521971 D1 7.00₹
6 4.5 4.73726 price per share -66.98564593
5 3.5 4.064061
4 3.25 3.48653
3 3 2.991069
2 2.5 2.566017
1 2.5 2.201368
19%
Table 2:- RIM
periods 1 2 3 4 5
profit/loss 2,42,92,000 -9,07,71,000 4,31,26,000 5,16,70,000 5,23,71,000
shareholderfnd 5,66,461 56,64,61,000 56,64,61,000 53,66,95,000 56,64,61,000
RI 24243567.58 -139203415.5 -5306415.5 5782577.5 3938584.5
no of shares 49,24,30,000
book value 1.15
eternal growth -32%
terminal value 97,39,624
PV of terminal value 70,14,923
PV of residual income ₹ 2,23,34,009.75 -13,92,03,415.50 41,48,697.50 -57,82,577.50 39,38,584.50
Sum of PV of ri -11,85,03,285.75
total value of excess equity-10,87,63,661.55
total value per share excess-0.220871315
total value per share 0.93
Table 3:- FCFM
12
periods 1 2 3 4 5
ebit 5,59,08,000 -4,58,68,000 7,40,26,000 8,71,31,000 8,92,76,000
1-tax rate 0.6935 0.9326 0.2746 0.7498 0.6854
38772198 -42776496.8 20327539.6 65330823.8 61189770.4
da 0 0 0 0 0
change in wc 17858 17858 2033 -22955 28127
capex 2829 2829 2829 -6383 2287
FCF 38792885 -42755809.8 20332401.6 65301485.8 61220184.4
eternal growth rate -6%
terminal value 413651669.2
pv of fcf 3,57,37,342.24 -4,27,55,809.80 -1,58,96,415.13 -6,53,01,485.80 6,12,20,184.40
sum of pv -8,82,16,368.49
total current asset 1,12,07,40,000
total market value 1,03,25,23,631.51
market value of company asset 2.10
Table 4:- Forecast
Forecast for API actual forecast forecast forecast forecast forecast
2016 2017 2018 2019 2020 2021
1. Forecast sales 3839987 4607984 5437422 6253035 7190990 8269639
Sales growth rate -estimated 20% 18% 15% 15% 15%
Sales 3839987 4607984 5437422 6253035 7190990 8269639
2. Forecast ATO and calculate NOA
Forecast ATO 6.441 6.913 7.419588 7.9633 8.546855 9.173173
Calculate NOA (NOA=sales/ATO) 596178.699 666568 732846.8 785231.6 841361 901502.5
3. Revise sale forecast 3839987 4607984 5437422 6253035 7190990 8269639
4. forecast PM and calculate NOPAT
Forecast PM 16.33% 16.33% 16.33% 16.33% 16.33% 16.33%
NOPAT = sales/PM 23514923.45 28217908 33297132 38291701 44035457 50640775
5. Calculate free cash flow (NOPAT-changes in NOA)
changes in NOA 70389.27 66278.82 52384.82 56129.35 60141.55
fcf 28147519 33230853 38239317 43979327 50580633
6. Forecast net dividend payout
estimate as a percentage of NOPAT 0.000000170105% 0.048 0.05664 0.065136 0.074906 0.086142
7.calculate net payments to debt holders
payments=FCF-dividend 28147519 33230853 38239316 43979327 50580633
⊘ This is a preview!⊘
Do you want full access?
Subscribe today to unlock all pages.
Trusted by 1+ million students worldwide
1 out of 12
Related Documents


Your All-in-One AI-Powered Toolkit for Academic Success.
+13062052269
info@desklib.com
Available 24*7 on WhatsApp / Email
![[object Object]](/_next/static/media/star-bottom.7253800d.svg)
Unlock your academic potential
Copyright © 2020–2026 A2Z Services. All Rights Reserved. Developed and managed by ZUCOL.