MBAA 518 Managerial Finance: Stock Valuation Using Comparative P/E

Verified

Added on  2023/04/25

|4
|706
|466
Homework Assignment
AI Summary
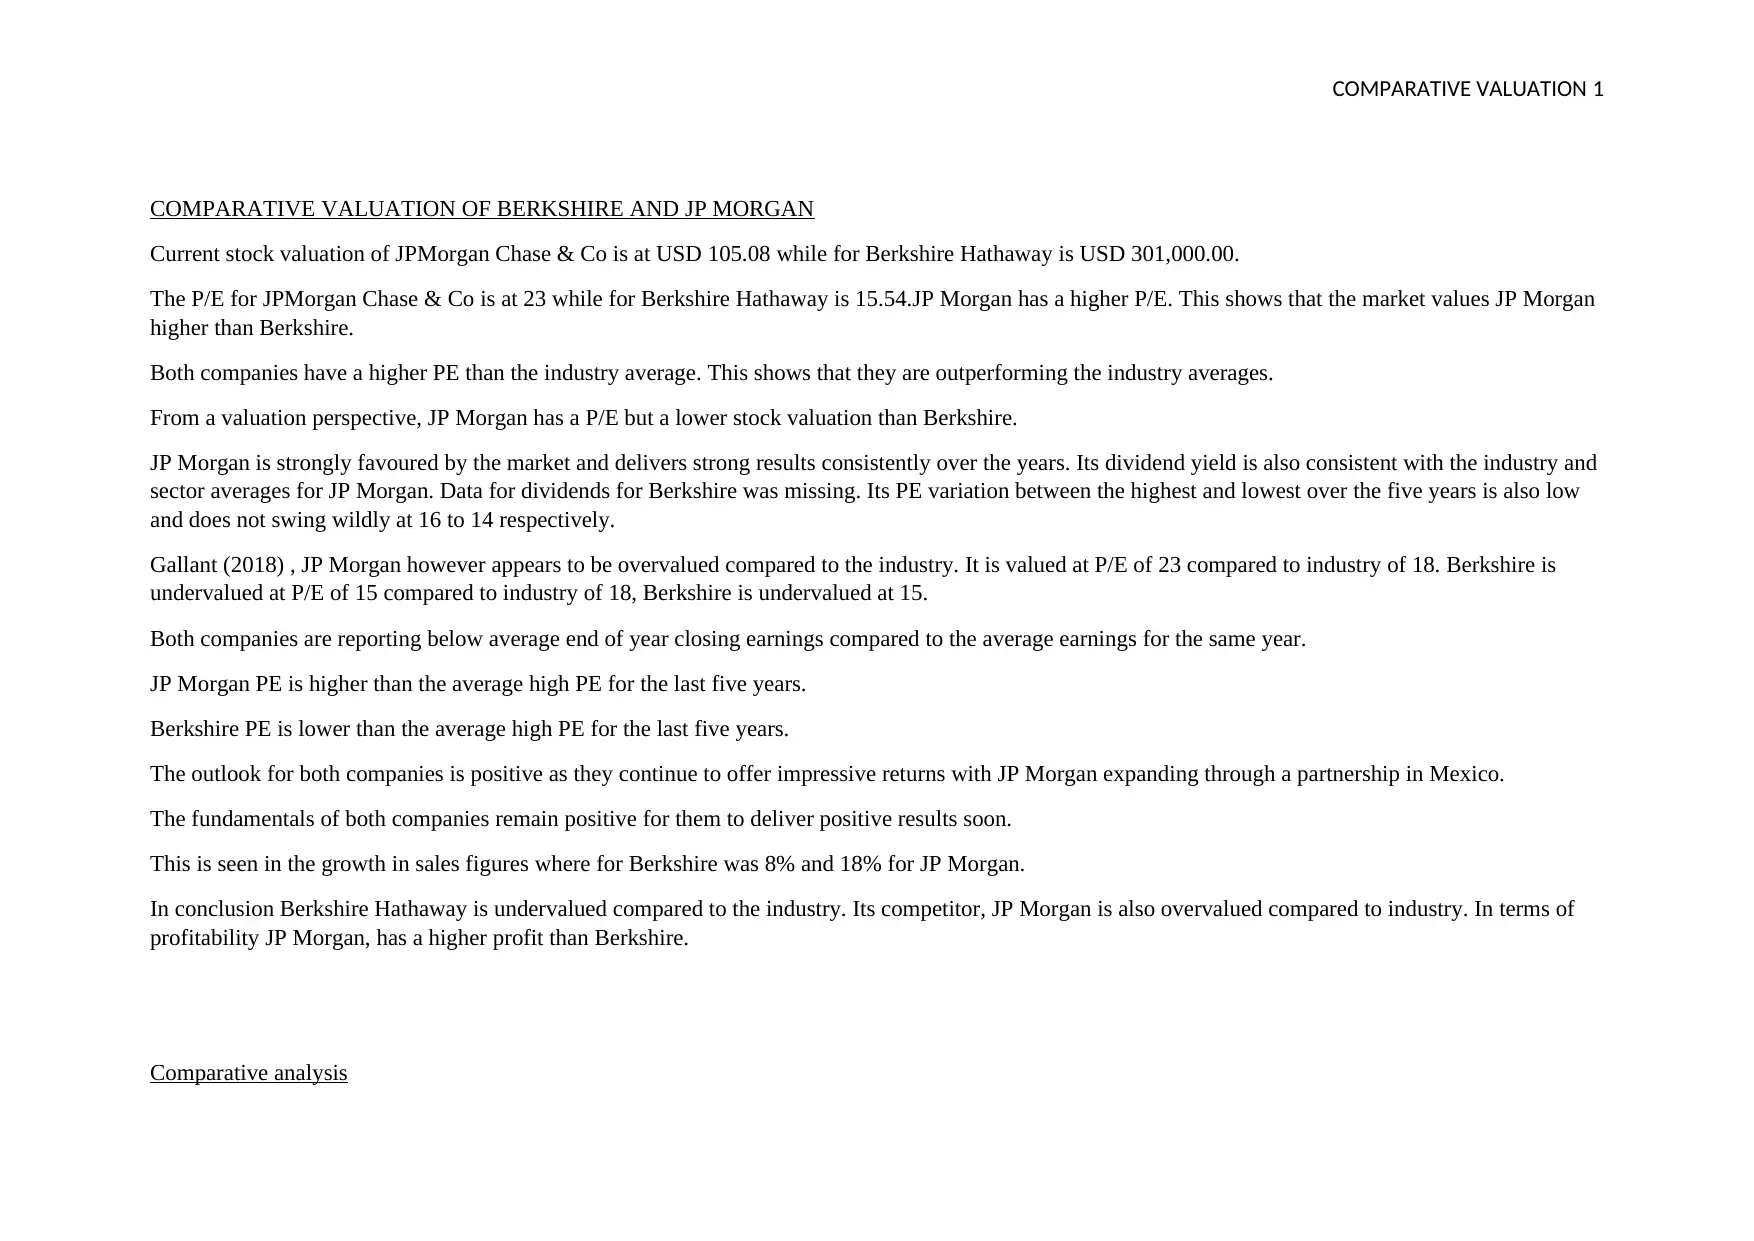
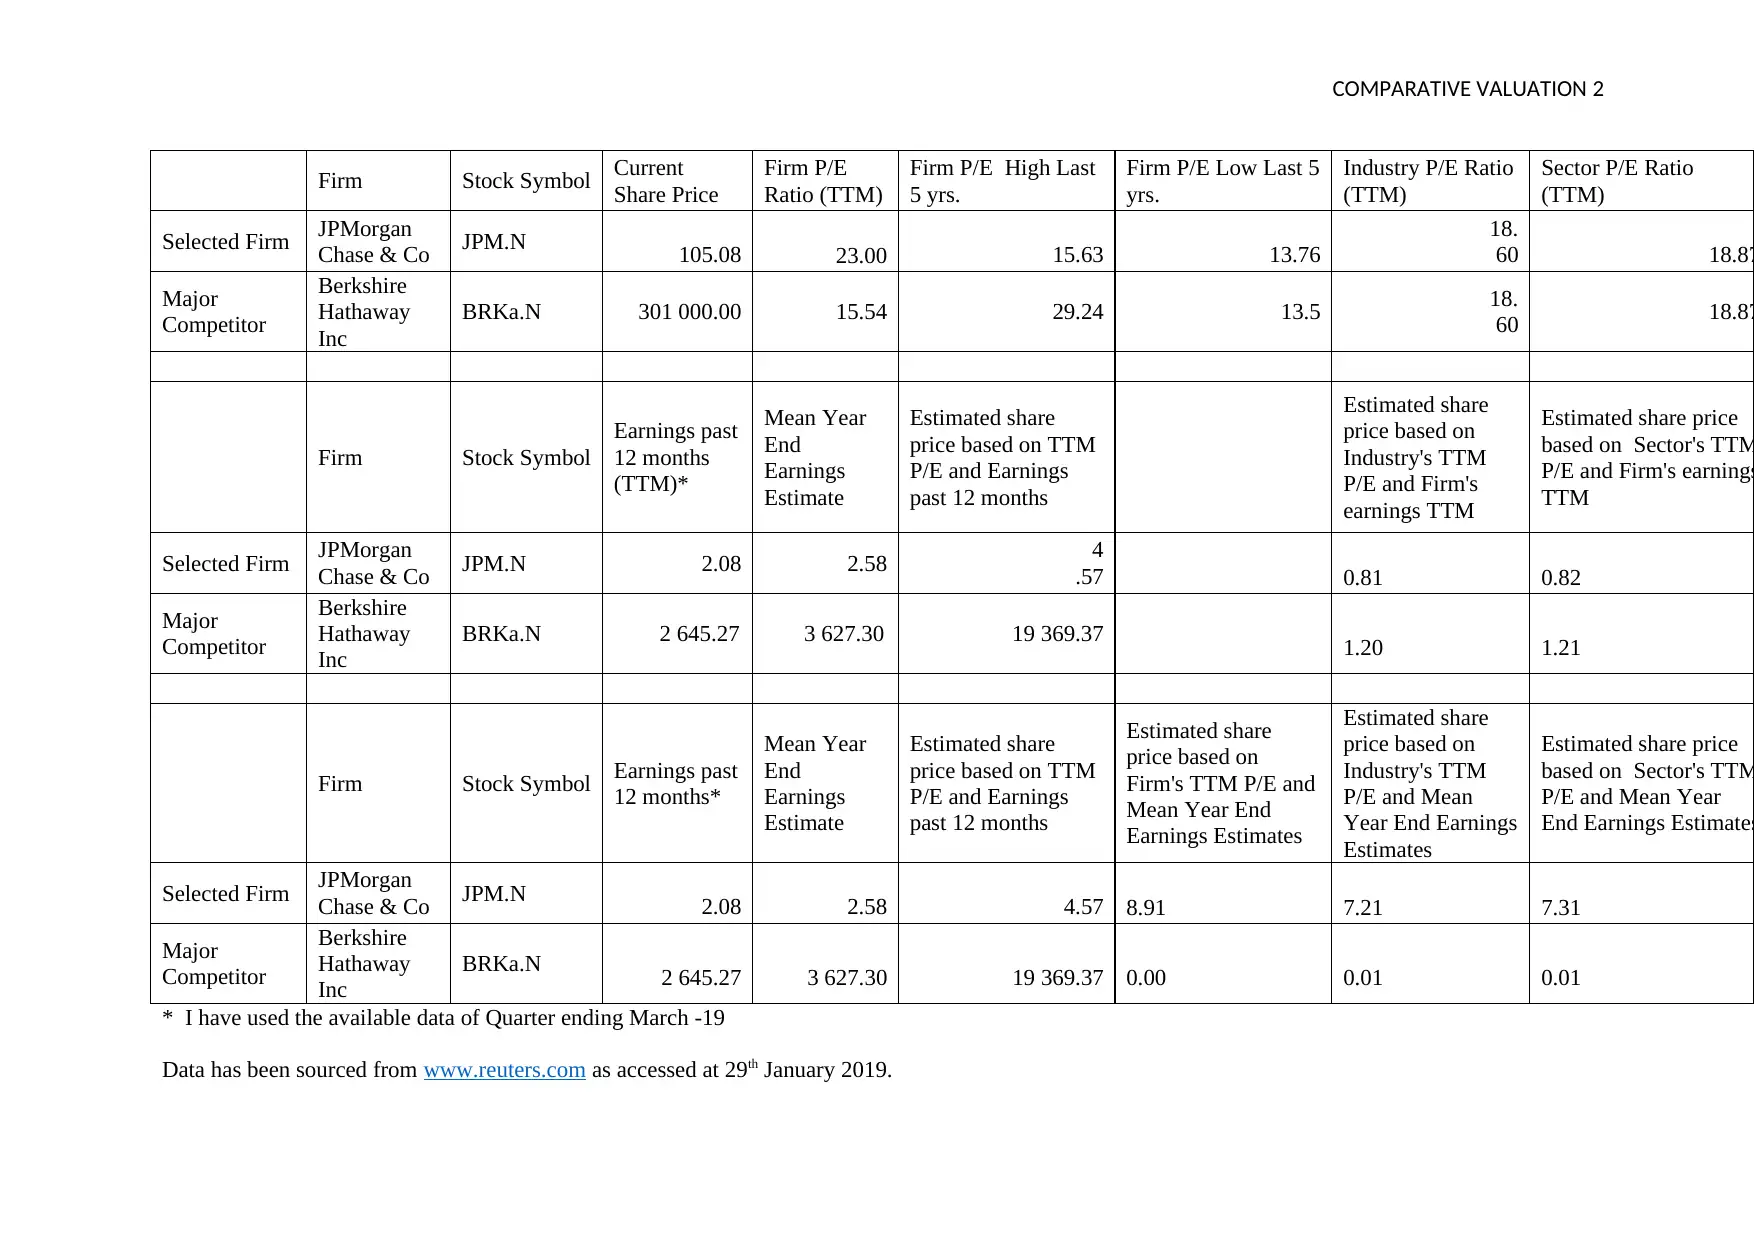
This assignment presents a comparative valuation of Berkshire Hathaway and JP Morgan Chase & Co using P/E ratios. It finds that JP Morgan has a higher P/E ratio, suggesting it is more favored by the market, although it appears overvalued compared to the industry average. Berkshire Hathaway, on the other hand, seems undervalued. The analysis includes a comparison of stock symbols, current share prices, P/E ratios, earnings, and estimated share prices based on various metrics. Data is sourced from Reuters. The assignment concludes that while both companies have positive outlooks, JP Morgan is overvalued and Berkshire Hathaway is undervalued relative to the industry. Profitability wise, JP Morgan shows higher profits than Berkshire.
Document Page
COMPARATIVE VALUATION 1
COMPARATIVE VALUATION OF BERKSHIRE AND JP MORGAN
Current stock valuation of JPMorgan Chase & Co is at USD 105.08 while for Berkshire Hathaway is USD 301,000.00.
The P/E for JPMorgan Chase & Co is at 23 while for Berkshire Hathaway is 15.54.JP Morgan has a higher P/E. This shows that the market values JP Morgan
higher than Berkshire.
Both companies have a higher PE than the industry average. This shows that they are outperforming the industry averages.
From a valuation perspective, JP Morgan has a P/E but a lower stock valuation than Berkshire.
JP Morgan is strongly favoured by the market and delivers strong results consistently over the years. Its dividend yield is also consistent with the industry and
sector averages for JP Morgan. Data for dividends for Berkshire was missing. Its PE variation between the highest and lowest over the five years is also low
and does not swing wildly at 16 to 14 respectively.
Gallant (2018) , JP Morgan however appears to be overvalued compared to the industry. It is valued at P/E of 23 compared to industry of 18. Berkshire is
undervalued at P/E of 15 compared to industry of 18, Berkshire is undervalued at 15.
Both companies are reporting below average end of year closing earnings compared to the average earnings for the same year.
JP Morgan PE is higher than the average high PE for the last five years.
Berkshire PE is lower than the average high PE for the last five years.
The outlook for both companies is positive as they continue to offer impressive returns with JP Morgan expanding through a partnership in Mexico.
The fundamentals of both companies remain positive for them to deliver positive results soon.
This is seen in the growth in sales figures where for Berkshire was 8% and 18% for JP Morgan.
In conclusion Berkshire Hathaway is undervalued compared to the industry. Its competitor, JP Morgan is also overvalued compared to industry. In terms of
profitability JP Morgan, has a higher profit than Berkshire.
Comparative analysis
tabler-icon-diamond-filled.svg

Paraphrase This Document

Need a fresh take? Get an instant paraphrase of this document with our AI Paraphraser
Document Page
COMPARATIVE VALUATION 2
Firm Stock Symbol Current
Share Price
Firm P/E
Ratio (TTM)
Firm P/E High Last
5 yrs.
Firm P/E Low Last 5
yrs.
Industry P/E Ratio
(TTM)
Sector P/E Ratio
(TTM)
Selected Firm JPMorgan
Chase & Co JPM.N 105.08 23.00 15.63 13.76
18.
60 18.87
Major
Competitor
Berkshire
Hathaway
Inc
BRKa.N 301 000.00 15.54 29.24 13.5 18.
60 18.87
Firm Stock Symbol
Earnings past
12 months
(TTM)*
Mean Year
End
Earnings
Estimate
Estimated share
price based on TTM
P/E and Earnings
past 12 months
Estimated share
price based on
Industry's TTM
P/E and Firm's
earnings TTM
Estimated share price
based on Sector's TTM
P/E and Firm's earnings
TTM
Selected Firm JPMorgan
Chase & Co JPM.N 2.08 2.58 4
.57 0.81 0.82
Major
Competitor
Berkshire
Hathaway
Inc
BRKa.N 2 645.27 3 627.30 19 369.37 1.20 1.21
Firm Stock Symbol Earnings past
12 months*
Mean Year
End
Earnings
Estimate
Estimated share
price based on TTM
P/E and Earnings
past 12 months
Estimated share
price based on
Firm's TTM P/E and
Mean Year End
Earnings Estimates
Estimated share
price based on
Industry's TTM
P/E and Mean
Year End Earnings
Estimates
Estimated share price
based on Sector's TTM
P/E and Mean Year
End Earnings Estimates
Selected Firm JPMorgan
Chase & Co JPM.N 2.08 2.58 4.57 8.91 7.21 7.31
Major
Competitor
Berkshire
Hathaway
Inc
BRKa.N 2 645.27 3 627.30 19 369.37 0.00 0.01 0.01
* I have used the available data of Quarter ending March -19
Data has been sourced from www.reuters.com as accessed at 29th January 2019.
Document Page
COMPARATIVE VALUATION 3
Document Page
COMPARATIVE VALUATION 4
References.
Gallant, C.(2018). Are stocks with low P/E ratios always better? Investing.
Retrieved from https://www.investopedia.com/ask/answers/05/lowperatiostocksbetterinvestments.asp/. [Accessed 29 January. 2019].
Markets & Finance news.
Retrieved from https://www.reuters.com/markets/stocks/. [Accessed 29 January. 2019].
chevron_up_icon
1 out of 4
circle_padding
hide_on_mobile
zoom_out_icon
[object Object]