MBAA 518 Managerial Finance: Stock Valuation with P/E Ratios

Verified

Added on  2023/04/26

|5
|833
|145
Homework Assignment
AI Summary
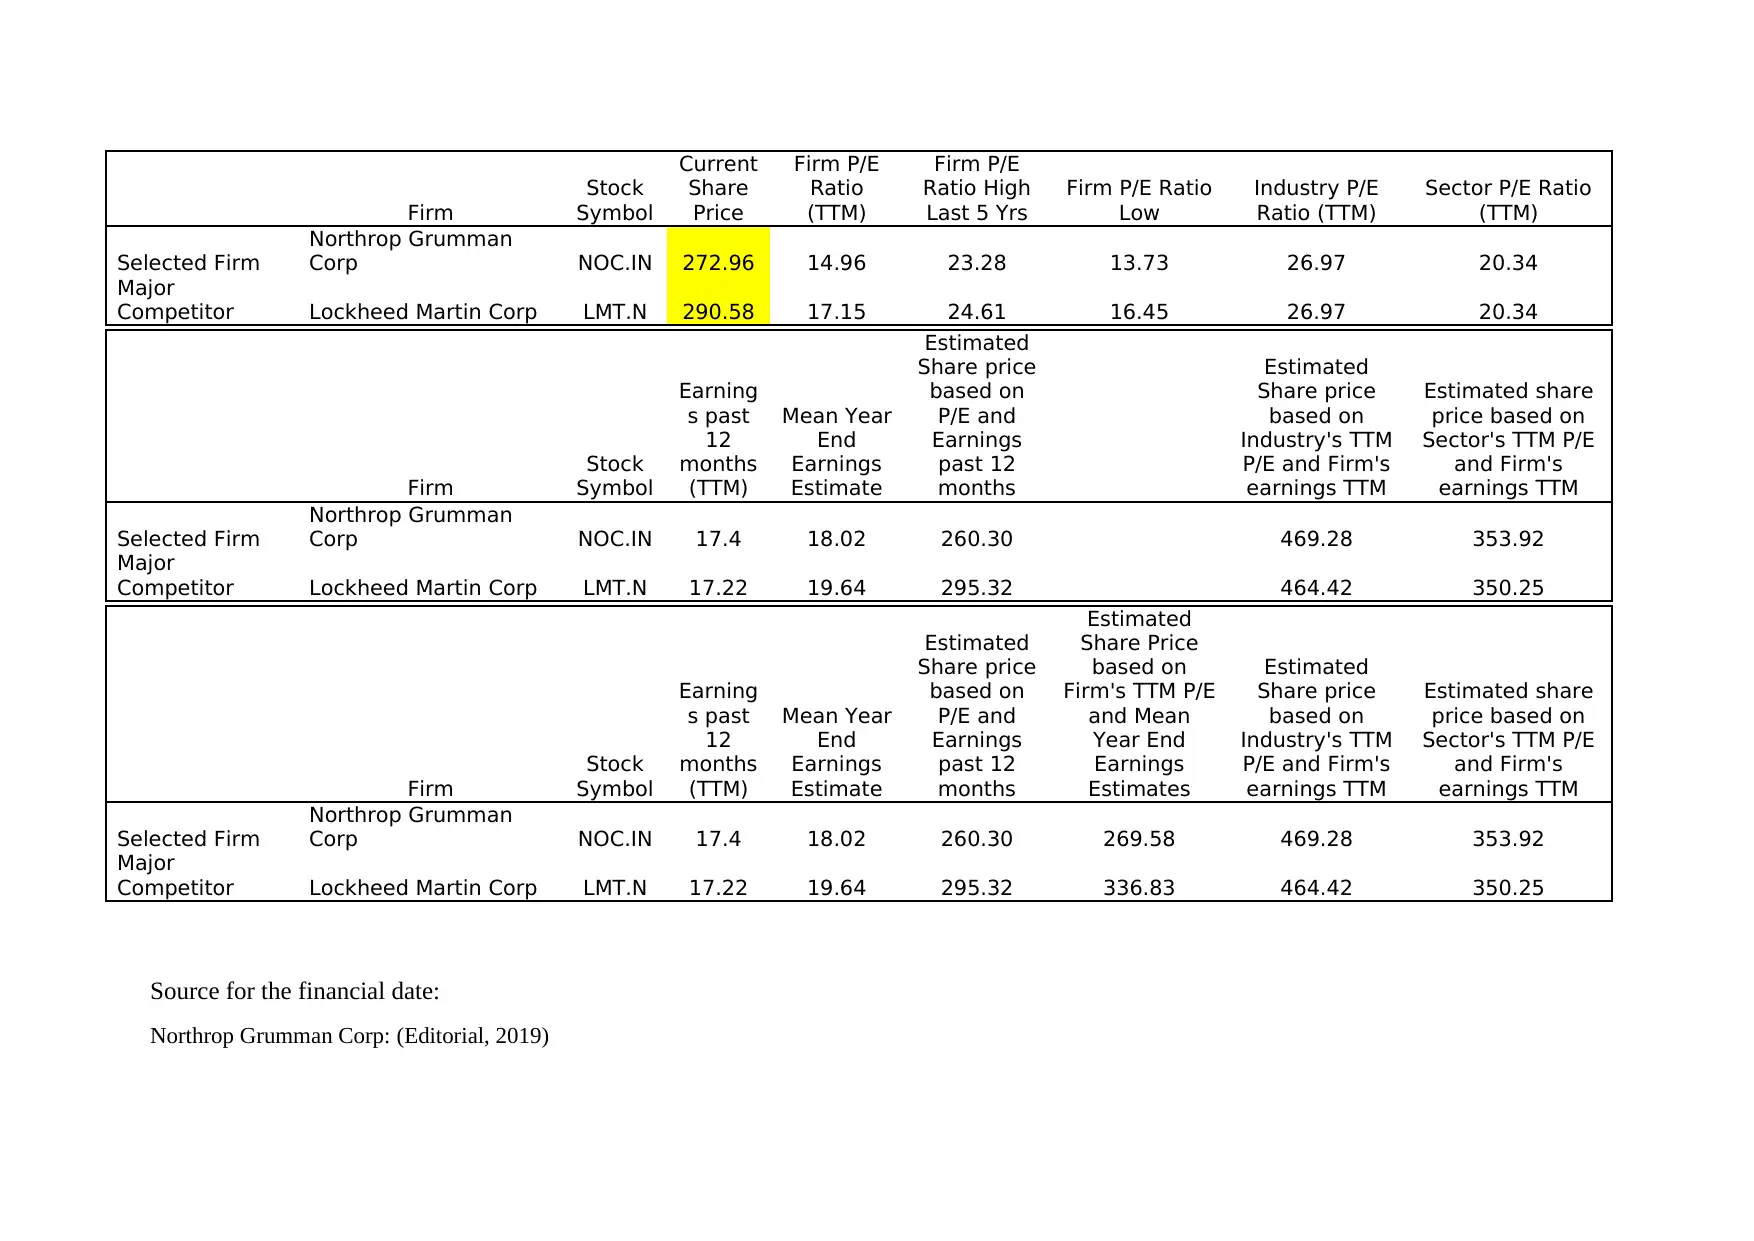
This assignment analyzes the stock valuation of Northrop Grumman Corp and Lockheed Martin Corp using the Price-to-Earnings (P/E) ratio. The analysis calculates estimated share prices based on P/E ratios and Earnings Per Share (EPS), comparing them to current market prices. The solution shows that Lockheed Martin shares appear undervalued while Northrop Grumman shares are overvalued based on the P/E multiple approach. The analysis considers industry and sector P/E ratios to determine potential overvaluation or undervaluation, and the impact of EPS on shareholder return expectations. The document includes financial data, P/E ratios, and earnings from sources like Reuters.com, providing a comprehensive evaluation of the two companies' stock valuations, which is submitted on Desklib.
Document Page
The estimated price of share of Northrop Grumman Corp ($265.30) is less than the estimated
price of Lockheed Martin Corp ($295.32) when the theoretical price of share is computed
based on P/E and EPS. This is because the firm’s P/E Ratio (14.96 times) is less than the P/E
Ratio of Lockheed Martin (17.15 times). Although the EPS of Northrop Grumman Corp
($17.40) is more than the EPS of Lockheed Martin Corp ($17.22), this difference was not
sufficient to cover the gap in prices created by the P/E Ratio.
The company’s current share price ($272.96) is less than the estimated share price based on
Industry’s TTM P/E and earnings of the company ($469.28). Further it is also less when
compared to the share price based on the sector’s TTM P/E and earnings which is $353.92.
The investor is expecting more return from the industry and sector as a whole when
compared to his expectation from the firm. The market portfolio of the industry and sector are
hinting of possible over valuation of the shares owing to their higher P/E Ratio. Therefore the
difference between the theoretical price of the share and the estimated price of share based on
industry’s P/E or Sector P/E may not be a negative factor (Staff, n.d.).
Based on the simple comparison of the expected values of both the firms, it occurs that the
shares of Lockheed Martin Corp are undervalued while the shares of Northrop Grumman
Corp are overvalued. The reason for the deduction is the apparent gap between the estimated
prices and current market price of the shares and their corresponding theoretical values
computed using the P/E multiple approach. While the theoretical value of the share of
Northrop Grumman Corp is less than the actual market price of the share of the company, the
theoretical price of the share of Lockheed Martin Corp is more than the present actual market
price of the share of the company which clearly indicates that the company’s shares are being
purchased at a price which is less than their intrinsic value. The reason behind the situation
may be owing to both the companies’ performance in generation of the earnings per share.
Probably, the increase in the earnings per share of the company may not be able to satisfy the
tabler-icon-diamond-filled.svg

Secure Best Marks with AI Grader

Need help grading? Try our AI Grader for instant feedback on your assignments.
Document Page
required rate of return of the shareholders in the case of Northrop Grumman Corp. The higher
return expectations are reflected in the form of higher market price than the theoretical price
of the share. On the other hand, in the case of Lockheed Martin Corp, the shareholders are
expecting lesser performance from the company than the available potential of the company
and hence the shareholders are willing to pay less than what the share actually deserves.
Document Page
Firm
Stock
Symbol
Current
Share
Price
Firm P/E
Ratio
(TTM)
Firm P/E
Ratio High
Last 5 Yrs
Firm P/E Ratio
Low
Industry P/E
Ratio (TTM)
Sector P/E Ratio
(TTM)
Selected Firm
Northrop Grumman
Corp NOC.IN 272.96 14.96 23.28 13.73 26.97 20.34
Major
Competitor Lockheed Martin Corp LMT.N 290.58 17.15 24.61 16.45 26.97 20.34
Firm
Stock
Symbol
Earning
s past
12
months
(TTM)
Mean Year
End
Earnings
Estimate
Estimated
Share price
based on
P/E and
Earnings
past 12
months
Estimated
Share price
based on
Industry's TTM
P/E and Firm's
earnings TTM
Estimated share
price based on
Sector's TTM P/E
and Firm's
earnings TTM
Selected Firm
Northrop Grumman
Corp NOC.IN 17.4 18.02 260.30 469.28 353.92
Major
Competitor Lockheed Martin Corp LMT.N 17.22 19.64 295.32 464.42 350.25
Firm
Stock
Symbol
Earning
s past
12
months
(TTM)
Mean Year
End
Earnings
Estimate
Estimated
Share price
based on
P/E and
Earnings
past 12
months
Estimated
Share Price
based on
Firm's TTM P/E
and Mean
Year End
Earnings
Estimates
Estimated
Share price
based on
Industry's TTM
P/E and Firm's
earnings TTM
Estimated share
price based on
Sector's TTM P/E
and Firm's
earnings TTM
Selected Firm
Northrop Grumman
Corp NOC.IN 17.4 18.02 260.30 269.58 469.28 353.92
Major
Competitor Lockheed Martin Corp LMT.N 17.22 19.64 295.32 336.83 464.42 350.25
Source for the financial date:
Northrop Grumman Corp: (Editorial, 2019)
Document Page
Lockheed Martin Corp: (Editorial, 2019)
tabler-icon-diamond-filled.svg

Secure Best Marks with AI Grader

Need help grading? Try our AI Grader for instant feedback on your assignments.
Document Page
Bibliography:
Staff, M. What Is the Relationship Between P/E Ratio and Stock Price? -- The Motley Fool. Retrieved
from https://www.fool.com/knowledge-center/the-relationship-between-pe-ratio-and-stock-price.aspx
Editorial, R. (2019). Northrop Grumman Corp (NOC.IN) Quote.| Reuters.com. Retrieved from
https://www.reuters.com/finance/stocks/overview/NOC.N
Editorial, R. (2019). Lockheed Martin Corp (LMT.N) Quote. Retrieved from
https://www.reuters.com/finance/stocks/overview/LMT.N
chevron_up_icon
1 out of 5
circle_padding
hide_on_mobile
zoom_out_icon
logo.png

Your All-in-One AI-Powered Toolkit for Academic Success.

Available 24*7 on WhatsApp / Email

[object Object]