Financial Analysis: Comparative Ratio Report on Stockland & Mirvac
VerifiedAdded on 2023/06/05
|29
|5378
|350
Report
AI Summary
This report presents a comparative financial analysis of Stockland Group and Mirvac Group using ratio analysis, prepared for Hotel Properties Limited (HPL) to assess potential partnership opportunities in residential and resort development. The analysis covers capital structure, leverage, liquidity, and efficiency measures for both companies from 2013 to 2017. Key findings include Stockland Group's increasing net worth and capital employed, but also a high fixed assets to net worth ratio and weak solvency position. Mirvac Group shows increases in net worth and capital employed, with improved net working capital in 2017, but a high fixed asset to net worth ratio and fluctuating debt equity ratio. Times interest earned results vary, with Stockland showing improvement and Mirvac facing challenges in covering interest costs. The report concludes with recommendations based on the comparative performance of the two companies.

BUSINESS ENTREPRENEUR
Paraphrase This Document
Need a fresh take? Get an instant paraphrase of this document with our AI Paraphraser
EXECUTIVE SUMMARY
The preparation and presentation of financial statements form a crucial task of the management,
analyzing such financial statements with the best possible tools is a crucial task for the investors
and all such users intending to use these statements. Ratio analysis is one such comparative tool
used to understand the financial position of the company, its performance over the last years, it's
trend analysis, comparison with other companies in the same industry, etc. Ratio analysis
however considers only financial information and neglects every non-financial information
which might be important to understand the actions of the company better than the numbers
itself.
Contents
INTRODUCTION...........................................................................................................................4
RATIO ANALYSIS........................................................................................................................5
COMPARISON OF OVERALL PERFORMANCE.....................................................................25
RECOMMENDATION.................................................................................................................26
CONCLUSION..............................................................................................................................27
Bibliography..................................................................................................................................28
⊘ This is a preview!⊘
Do you want full access?
Subscribe today to unlock all pages.
Trusted by 1+ million students worldwide
INTRODUCTION
As a business management consultant, being appointed by Mr. Benson Evans who is the Chief
Operations Officer of Hotel Properties Limited (HPL), the companies to be compared are
Stockland Group and Mirvac Group. Both of these companies are involved in real estate business
and have approached HPL for potential partnership in residential and resort development
(Atkinson, 2012). As part of the consultancy agreement, the overall performance of both the
companies have been analyzed individually using ratio analysis as stated below (Alvarez, 2013):
Paraphrase This Document
Need a fresh take? Get an instant paraphrase of this document with our AI Paraphraser
RATIO ANALYSIS
[all figures are in $]
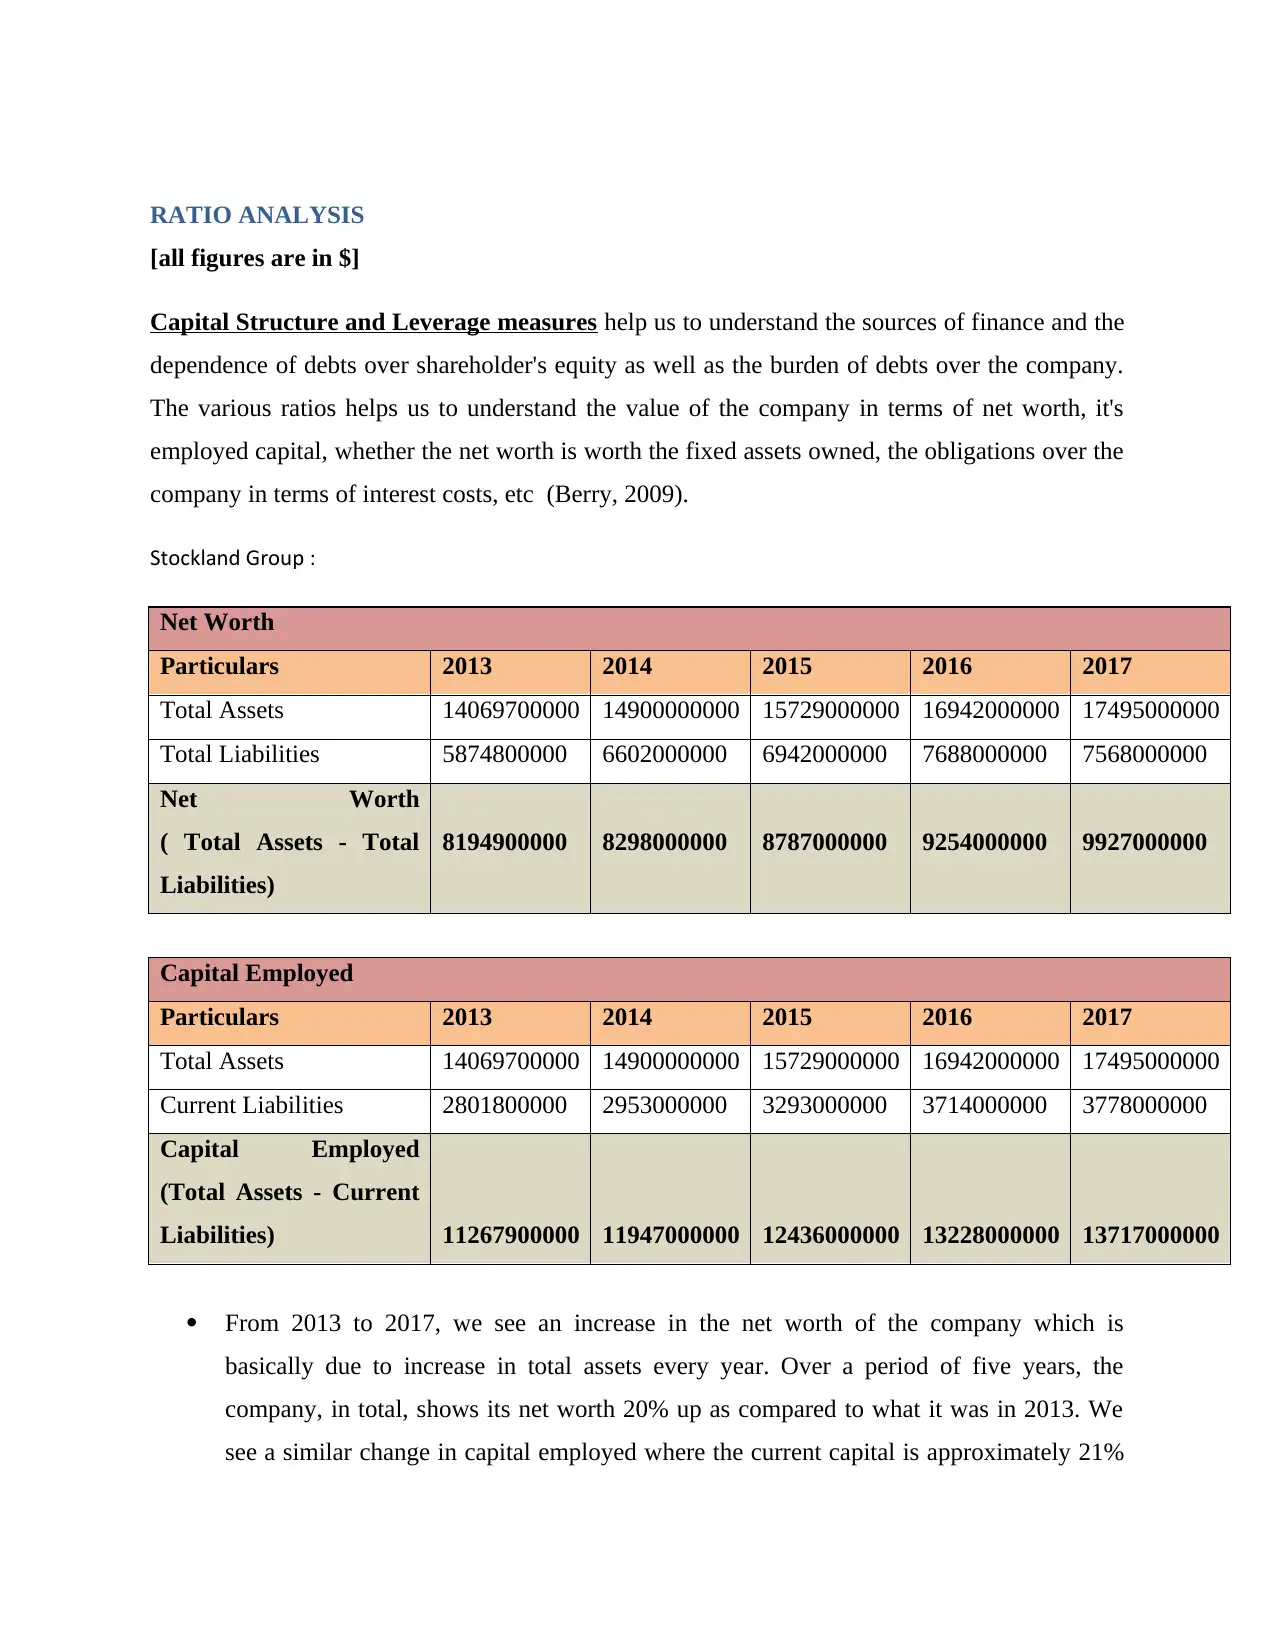
Capital Structure and Leverage measures help us to understand the sources of finance and the
dependence of debts over shareholder's equity as well as the burden of debts over the company.
The various ratios helps us to understand the value of the company in terms of net worth, it's
employed capital, whether the net worth is worth the fixed assets owned, the obligations over the
company in terms of interest costs, etc (Berry, 2009).
Stockland Group :
Net Worth
Particulars 2013 2014 2015 2016 2017
Total Assets 14069700000 14900000000 15729000000 16942000000 17495000000
Total Liabilities 5874800000 6602000000 6942000000 7688000000 7568000000
Net Worth
( Total Assets - Total
Liabilities)
8194900000 8298000000 8787000000 9254000000 9927000000
Capital Employed
Particulars 2013 2014 2015 2016 2017
Total Assets 14069700000 14900000000 15729000000 16942000000 17495000000
Current Liabilities 2801800000 2953000000 3293000000 3714000000 3778000000
Capital Employed
(Total Assets - Current
Liabilities) 11267900000 11947000000 12436000000 13228000000 13717000000
From 2013 to 2017, we see an increase in the net worth of the company which is
basically due to increase in total assets every year. Over a period of five years, the
company, in total, shows its net worth 20% up as compared to what it was in 2013. We
see a similar change in capital employed where the current capital is approximately 21%
[all figures are in $]
Capital Structure and Leverage measures help us to understand the sources of finance and the
dependence of debts over shareholder's equity as well as the burden of debts over the company.
The various ratios helps us to understand the value of the company in terms of net worth, it's
employed capital, whether the net worth is worth the fixed assets owned, the obligations over the
company in terms of interest costs, etc (Berry, 2009).
Stockland Group :
Net Worth
Particulars 2013 2014 2015 2016 2017
Total Assets 14069700000 14900000000 15729000000 16942000000 17495000000
Total Liabilities 5874800000 6602000000 6942000000 7688000000 7568000000
Net Worth
( Total Assets - Total
Liabilities)
8194900000 8298000000 8787000000 9254000000 9927000000
Capital Employed
Particulars 2013 2014 2015 2016 2017
Total Assets 14069700000 14900000000 15729000000 16942000000 17495000000
Current Liabilities 2801800000 2953000000 3293000000 3714000000 3778000000
Capital Employed
(Total Assets - Current
Liabilities) 11267900000 11947000000 12436000000 13228000000 13717000000
From 2013 to 2017, we see an increase in the net worth of the company which is
basically due to increase in total assets every year. Over a period of five years, the
company, in total, shows its net worth 20% up as compared to what it was in 2013. We
see a similar change in capital employed where the current capital is approximately 21%
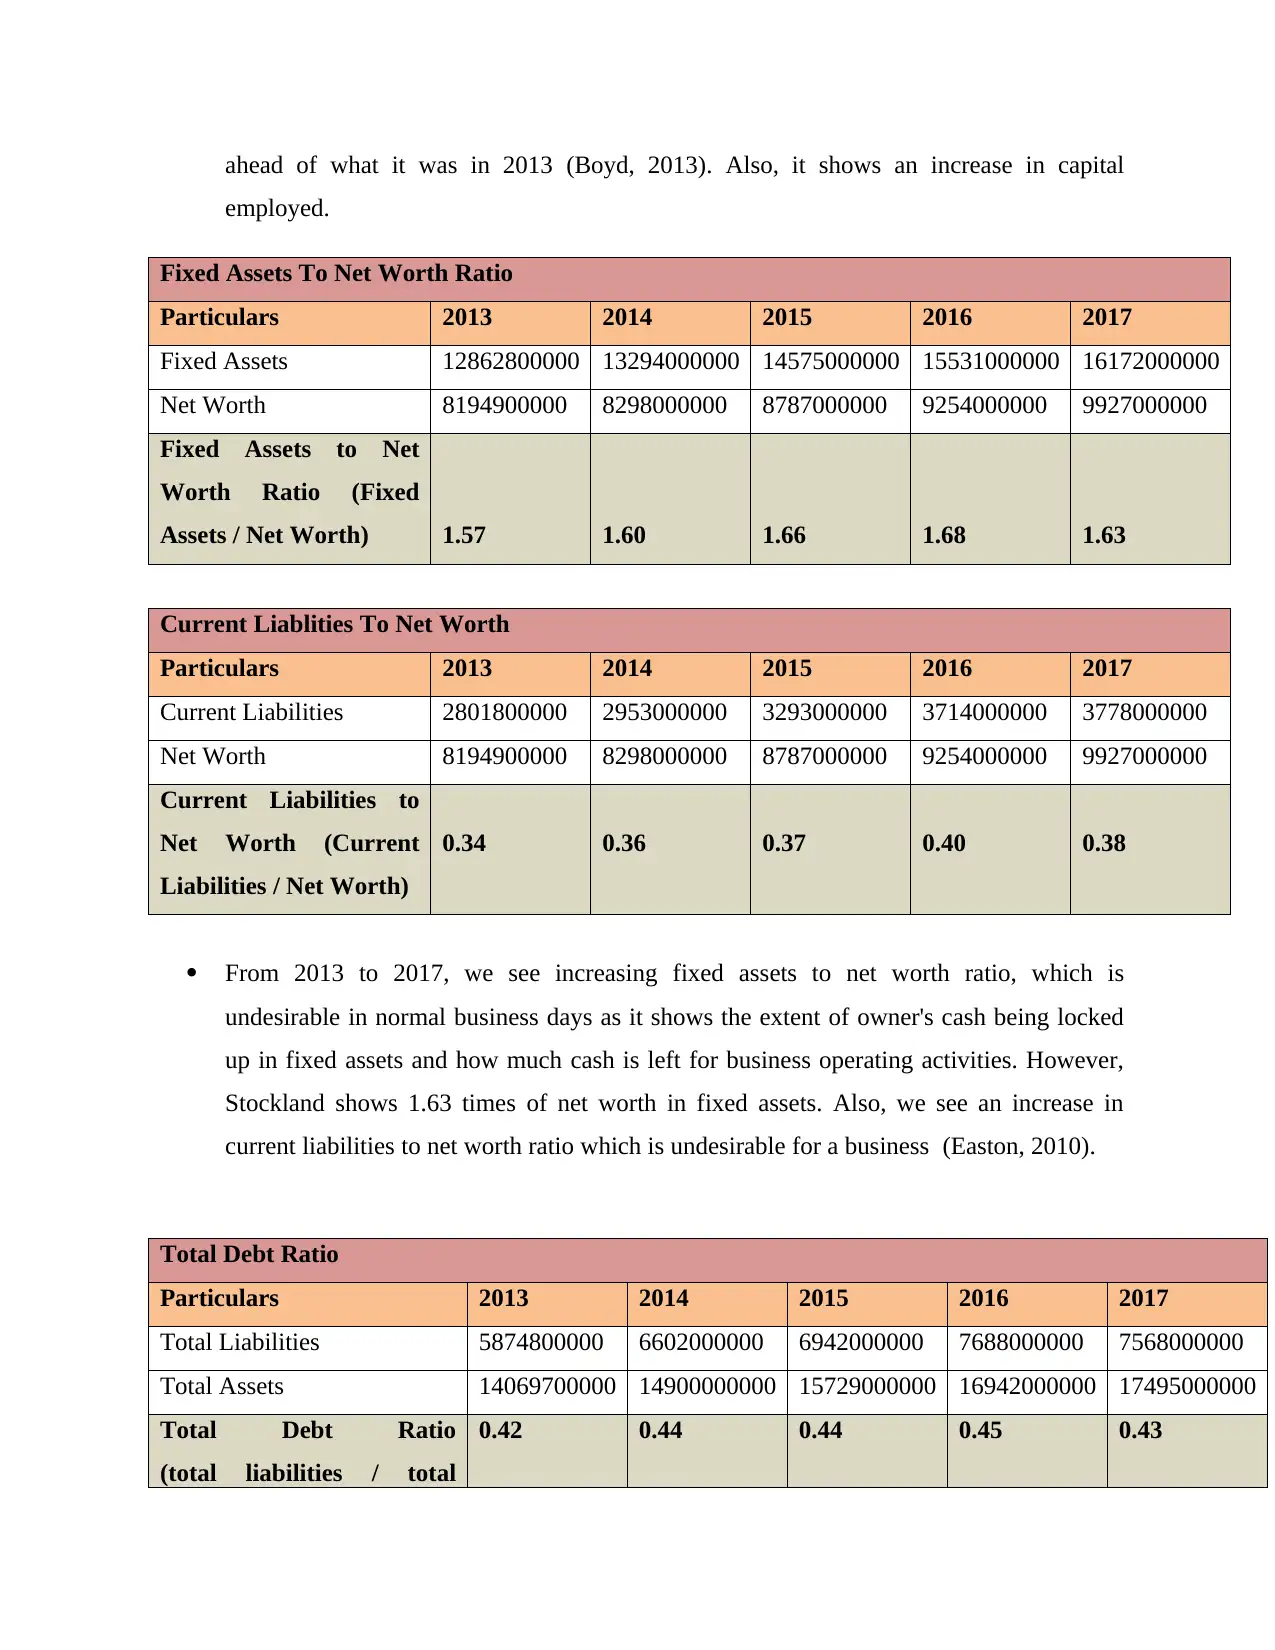
ahead of what it was in 2013 (Boyd, 2013). Also, it shows an increase in capital
employed.
Fixed Assets To Net Worth Ratio
Particulars 2013 2014 2015 2016 2017
Fixed Assets 12862800000 13294000000 14575000000 15531000000 16172000000
Net Worth 8194900000 8298000000 8787000000 9254000000 9927000000
Fixed Assets to Net
Worth Ratio (Fixed
Assets / Net Worth) 1.57 1.60 1.66 1.68 1.63
Current Liablities To Net Worth
Particulars 2013 2014 2015 2016 2017
Current Liabilities 2801800000 2953000000 3293000000 3714000000 3778000000
Net Worth 8194900000 8298000000 8787000000 9254000000 9927000000
Current Liabilities to
Net Worth (Current
Liabilities / Net Worth)
0.34 0.36 0.37 0.40 0.38
From 2013 to 2017, we see increasing fixed assets to net worth ratio, which is
undesirable in normal business days as it shows the extent of owner's cash being locked
up in fixed assets and how much cash is left for business operating activities. However,
Stockland shows 1.63 times of net worth in fixed assets. Also, we see an increase in
current liabilities to net worth ratio which is undesirable for a business (Easton, 2010).
Total Debt Ratio
Particulars 2013 2014 2015 2016 2017
Total Liabilities 5874800000 6602000000 6942000000 7688000000 7568000000
Total Assets 14069700000 14900000000 15729000000 16942000000 17495000000
Total Debt Ratio
(total liabilities / total
0.42 0.44 0.44 0.45 0.43
⊘ This is a preview!⊘
Do you want full access?
Subscribe today to unlock all pages.
Trusted by 1+ million students worldwide
assets)
Debt Equity Ratio
Particulars 2013 2014 2015 2016 2017
Total Debts 2352400000 2815000000 3030000000 3319000000 3272000000
Equity/Shareholder's funds 8194900000 8298000000 8787000000 9254000000 9927000000
Debt-Equity Ratio
(debt / equity) 0.29 0.34 0.34 0.36 0.33
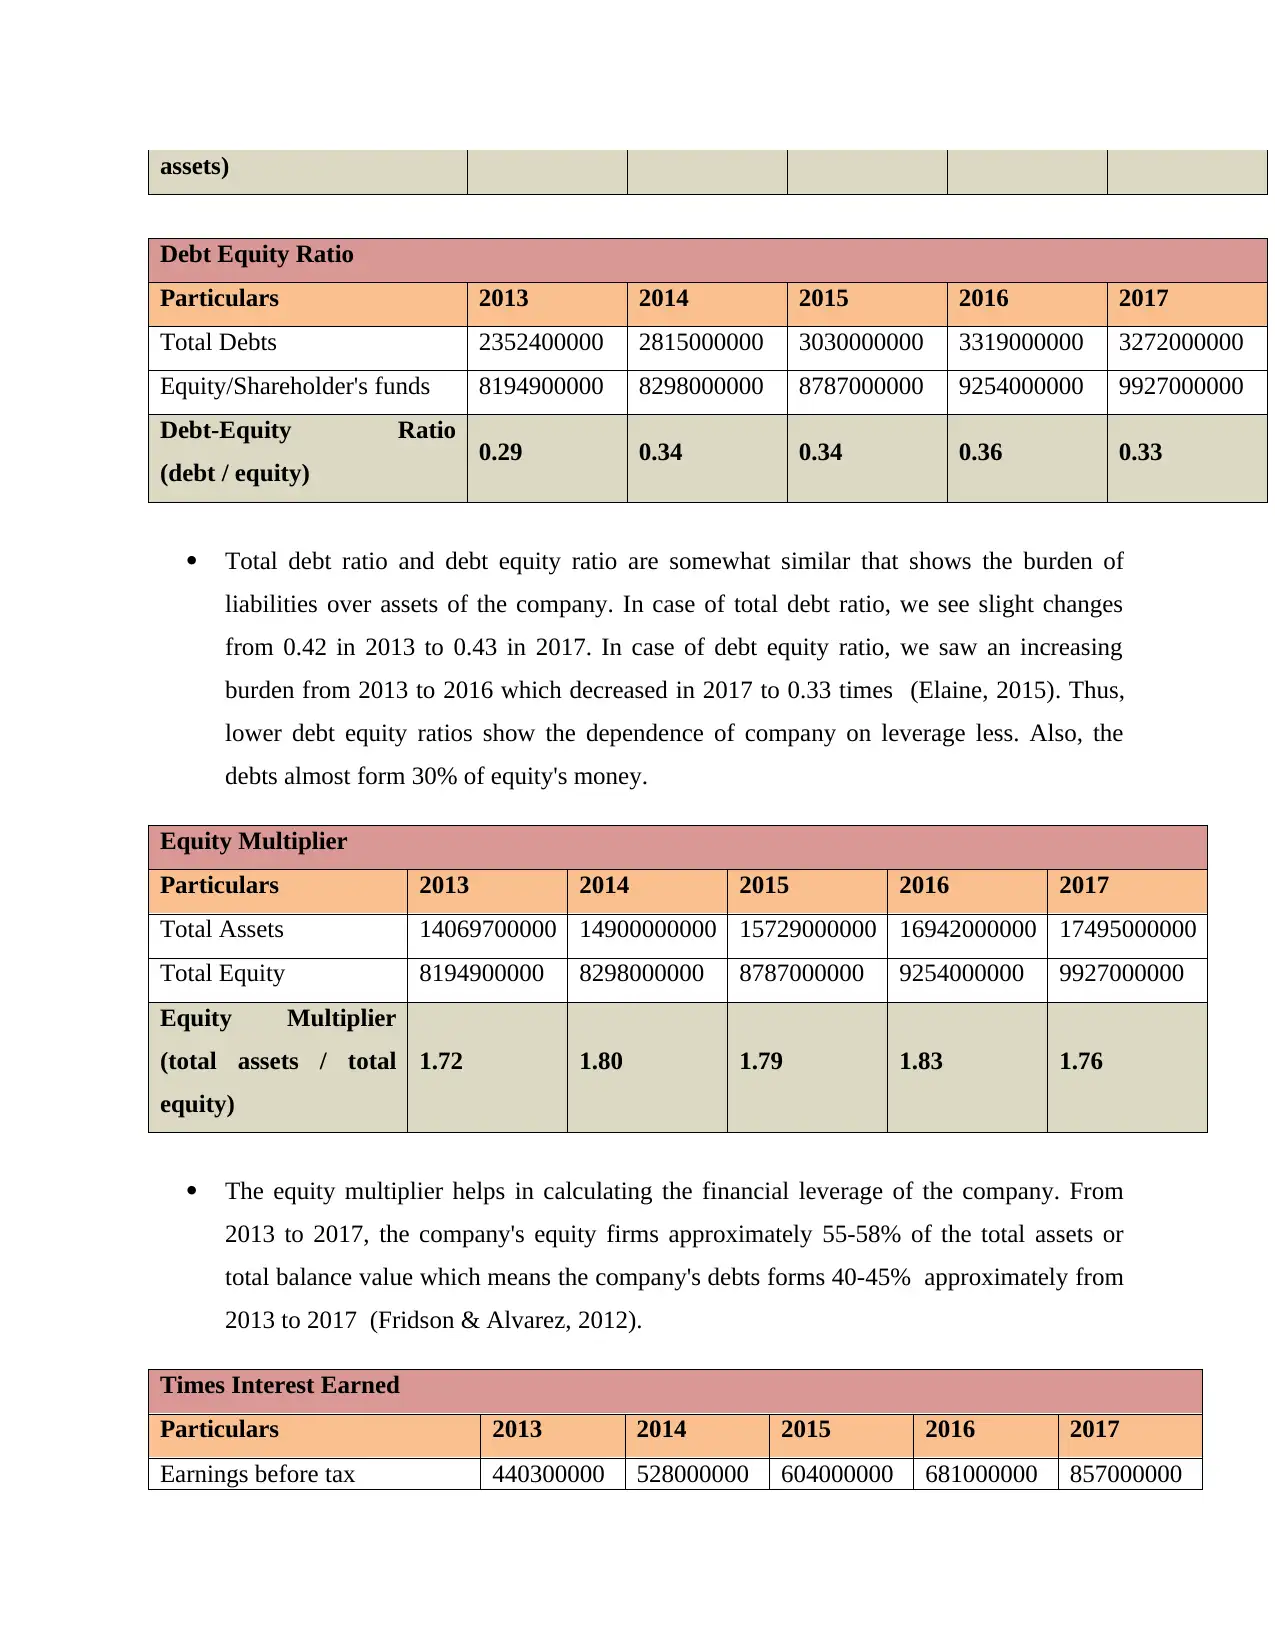
Total debt ratio and debt equity ratio are somewhat similar that shows the burden of
liabilities over assets of the company. In case of total debt ratio, we see slight changes
from 0.42 in 2013 to 0.43 in 2017. In case of debt equity ratio, we saw an increasing
burden from 2013 to 2016 which decreased in 2017 to 0.33 times (Elaine, 2015). Thus,
lower debt equity ratios show the dependence of company on leverage less. Also, the
debts almost form 30% of equity's money.
Equity Multiplier
Particulars 2013 2014 2015 2016 2017
Total Assets 14069700000 14900000000 15729000000 16942000000 17495000000
Total Equity 8194900000 8298000000 8787000000 9254000000 9927000000
Equity Multiplier
(total assets / total
equity)
1.72 1.80 1.79 1.83 1.76
The equity multiplier helps in calculating the financial leverage of the company. From
2013 to 2017, the company's equity firms approximately 55-58% of the total assets or
total balance value which means the company's debts forms 40-45% approximately from
2013 to 2017 (Fridson & Alvarez, 2012).
Times Interest Earned
Particulars 2013 2014 2015 2016 2017
Earnings before tax 440300000 528000000 604000000 681000000 857000000
Debt Equity Ratio
Particulars 2013 2014 2015 2016 2017
Total Debts 2352400000 2815000000 3030000000 3319000000 3272000000
Equity/Shareholder's funds 8194900000 8298000000 8787000000 9254000000 9927000000
Debt-Equity Ratio
(debt / equity) 0.29 0.34 0.34 0.36 0.33
Total debt ratio and debt equity ratio are somewhat similar that shows the burden of
liabilities over assets of the company. In case of total debt ratio, we see slight changes
from 0.42 in 2013 to 0.43 in 2017. In case of debt equity ratio, we saw an increasing
burden from 2013 to 2016 which decreased in 2017 to 0.33 times (Elaine, 2015). Thus,
lower debt equity ratios show the dependence of company on leverage less. Also, the
debts almost form 30% of equity's money.
Equity Multiplier
Particulars 2013 2014 2015 2016 2017
Total Assets 14069700000 14900000000 15729000000 16942000000 17495000000
Total Equity 8194900000 8298000000 8787000000 9254000000 9927000000
Equity Multiplier
(total assets / total
equity)
1.72 1.80 1.79 1.83 1.76
The equity multiplier helps in calculating the financial leverage of the company. From
2013 to 2017, the company's equity firms approximately 55-58% of the total assets or
total balance value which means the company's debts forms 40-45% approximately from
2013 to 2017 (Fridson & Alvarez, 2012).
Times Interest Earned
Particulars 2013 2014 2015 2016 2017
Earnings before tax 440300000 528000000 604000000 681000000 857000000
Paraphrase This Document
Need a fresh take? Get an instant paraphrase of this document with our AI Paraphraser
Interest 79000000 79000000 69000000 74000000 79000000
Times Interest Earned
(earnings before taxes and
interest / interest payment)
5.57 6.68 8.75 9.20 10.85
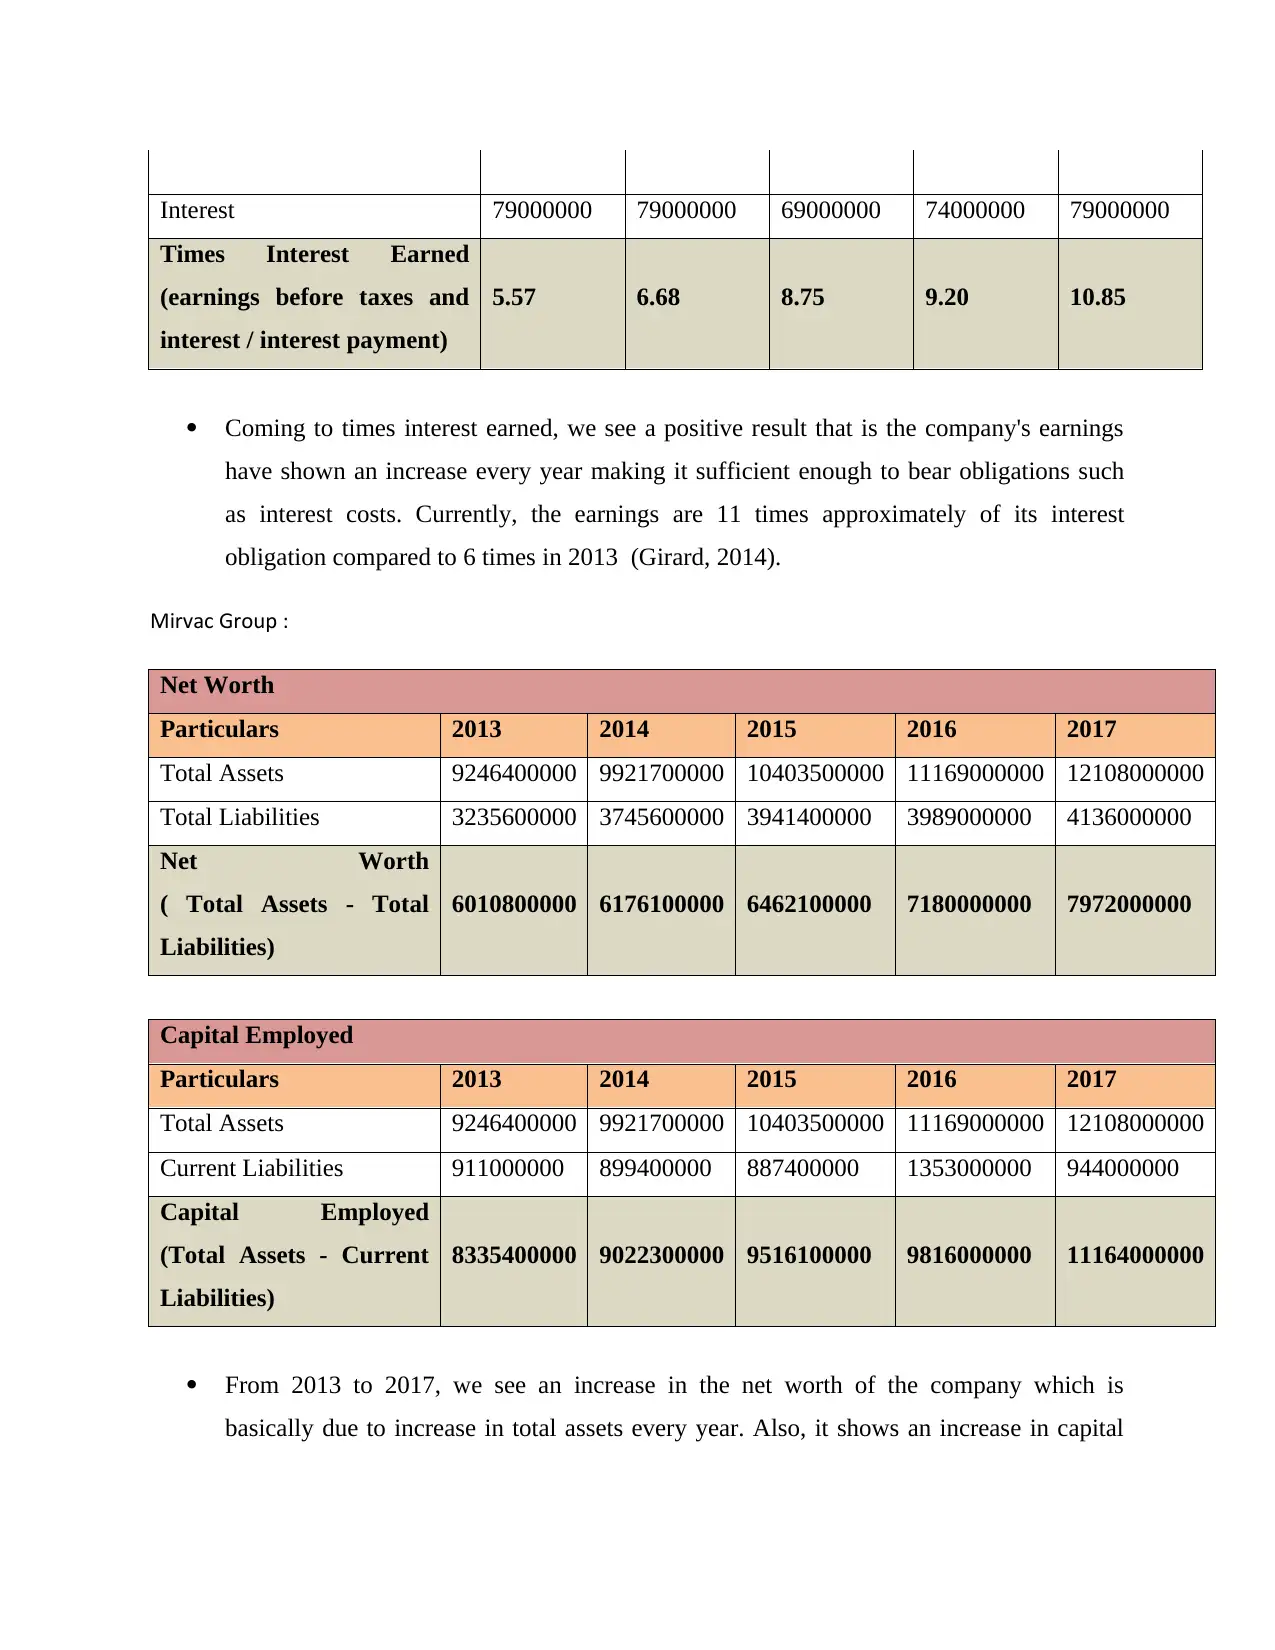
Coming to times interest earned, we see a positive result that is the company's earnings
have shown an increase every year making it sufficient enough to bear obligations such
as interest costs. Currently, the earnings are 11 times approximately of its interest
obligation compared to 6 times in 2013 (Girard, 2014).
Mirvac Group :
Net Worth
Particulars 2013 2014 2015 2016 2017
Total Assets 9246400000 9921700000 10403500000 11169000000 12108000000
Total Liabilities 3235600000 3745600000 3941400000 3989000000 4136000000
Net Worth
( Total Assets - Total
Liabilities)
6010800000 6176100000 6462100000 7180000000 7972000000
Capital Employed
Particulars 2013 2014 2015 2016 2017
Total Assets 9246400000 9921700000 10403500000 11169000000 12108000000
Current Liabilities 911000000 899400000 887400000 1353000000 944000000
Capital Employed
(Total Assets - Current
Liabilities)
8335400000 9022300000 9516100000 9816000000 11164000000
From 2013 to 2017, we see an increase in the net worth of the company which is
basically due to increase in total assets every year. Also, it shows an increase in capital
Times Interest Earned
(earnings before taxes and
interest / interest payment)
5.57 6.68 8.75 9.20 10.85
Coming to times interest earned, we see a positive result that is the company's earnings
have shown an increase every year making it sufficient enough to bear obligations such
as interest costs. Currently, the earnings are 11 times approximately of its interest
obligation compared to 6 times in 2013 (Girard, 2014).
Mirvac Group :
Net Worth
Particulars 2013 2014 2015 2016 2017
Total Assets 9246400000 9921700000 10403500000 11169000000 12108000000
Total Liabilities 3235600000 3745600000 3941400000 3989000000 4136000000
Net Worth
( Total Assets - Total
Liabilities)
6010800000 6176100000 6462100000 7180000000 7972000000
Capital Employed
Particulars 2013 2014 2015 2016 2017
Total Assets 9246400000 9921700000 10403500000 11169000000 12108000000
Current Liabilities 911000000 899400000 887400000 1353000000 944000000
Capital Employed
(Total Assets - Current
Liabilities)
8335400000 9022300000 9516100000 9816000000 11164000000
From 2013 to 2017, we see an increase in the net worth of the company which is
basically due to increase in total assets every year. Also, it shows an increase in capital
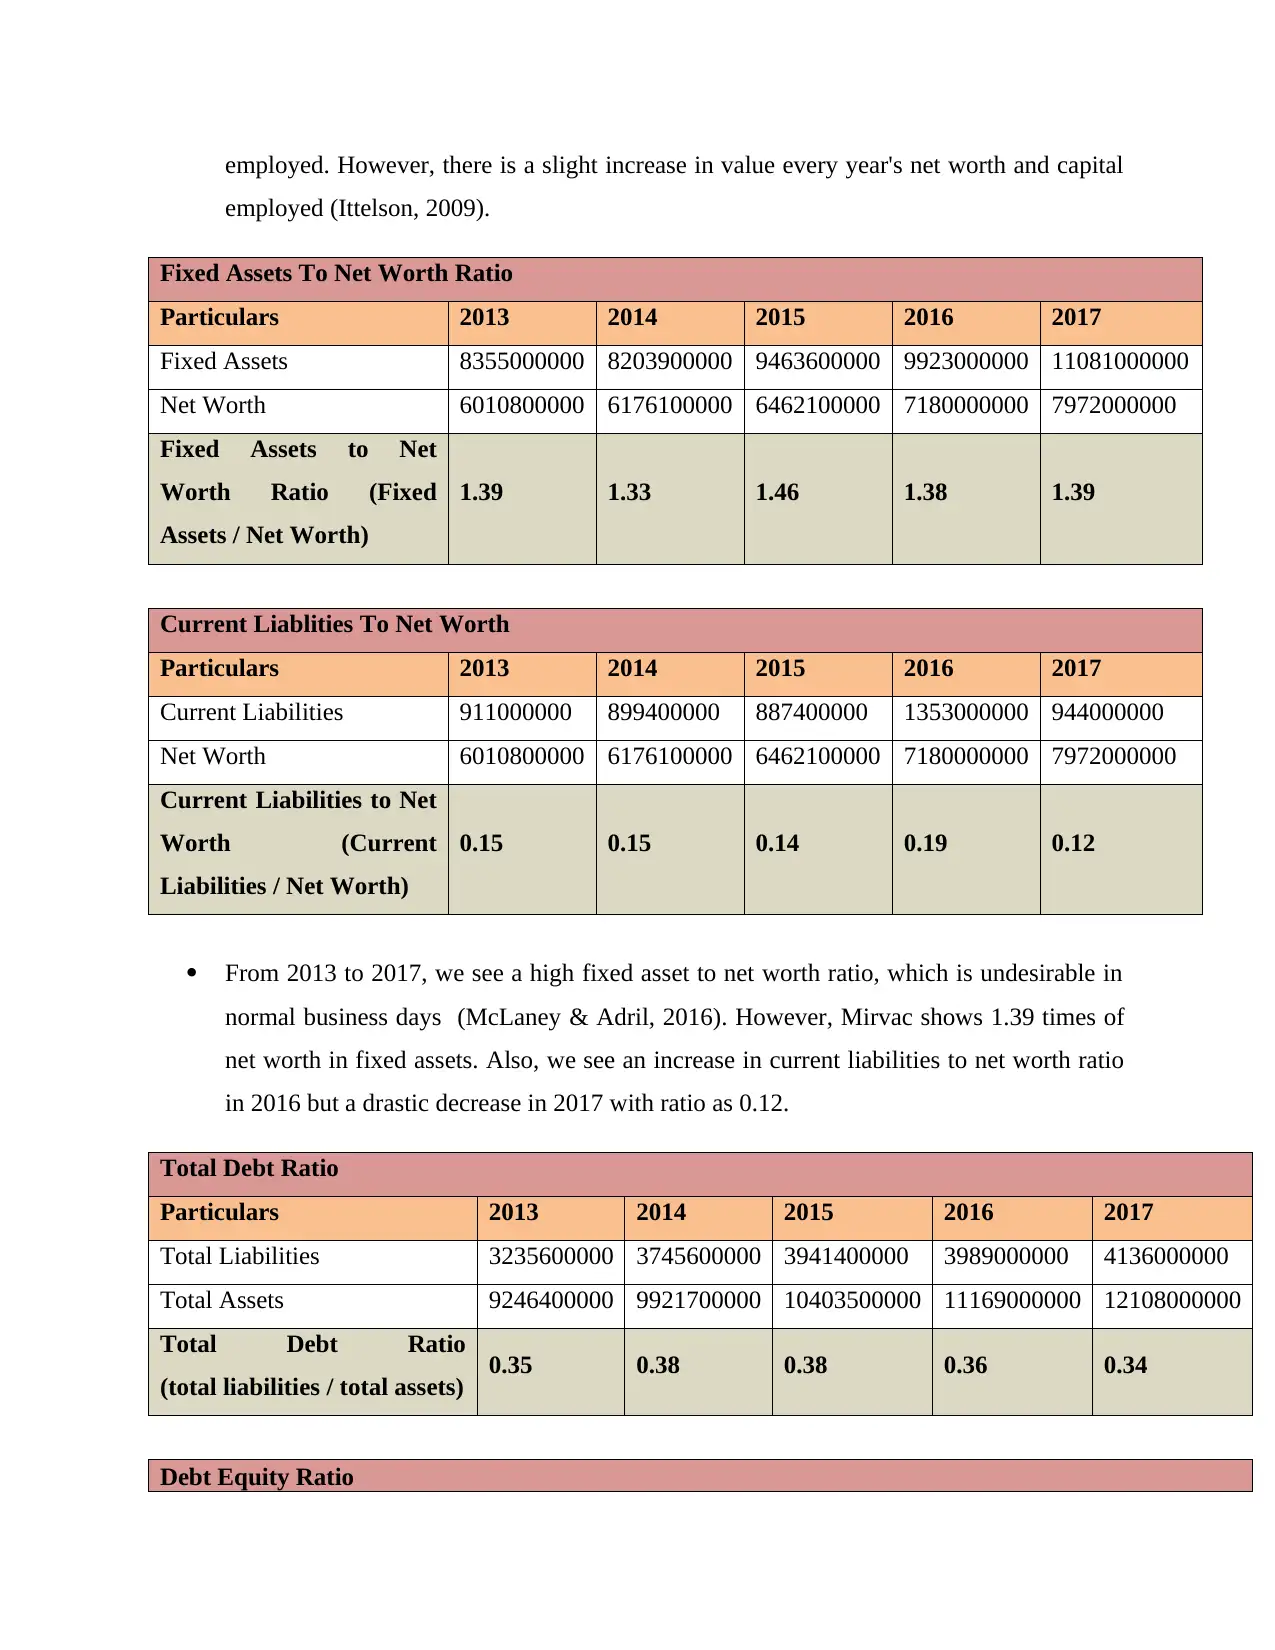
employed. However, there is a slight increase in value every year's net worth and capital
employed (Ittelson, 2009).
Fixed Assets To Net Worth Ratio
Particulars 2013 2014 2015 2016 2017
Fixed Assets 8355000000 8203900000 9463600000 9923000000 11081000000
Net Worth 6010800000 6176100000 6462100000 7180000000 7972000000
Fixed Assets to Net
Worth Ratio (Fixed
Assets / Net Worth)
1.39 1.33 1.46 1.38 1.39
Current Liablities To Net Worth
Particulars 2013 2014 2015 2016 2017
Current Liabilities 911000000 899400000 887400000 1353000000 944000000
Net Worth 6010800000 6176100000 6462100000 7180000000 7972000000
Current Liabilities to Net
Worth (Current
Liabilities / Net Worth)
0.15 0.15 0.14 0.19 0.12
From 2013 to 2017, we see a high fixed asset to net worth ratio, which is undesirable in
normal business days (McLaney & Adril, 2016). However, Mirvac shows 1.39 times of
net worth in fixed assets. Also, we see an increase in current liabilities to net worth ratio
in 2016 but a drastic decrease in 2017 with ratio as 0.12.
Total Debt Ratio
Particulars 2013 2014 2015 2016 2017
Total Liabilities 3235600000 3745600000 3941400000 3989000000 4136000000
Total Assets 9246400000 9921700000 10403500000 11169000000 12108000000
Total Debt Ratio
(total liabilities / total assets) 0.35 0.38 0.38 0.36 0.34
Debt Equity Ratio
⊘ This is a preview!⊘
Do you want full access?
Subscribe today to unlock all pages.
Trusted by 1+ million students worldwide
Particulars 2013 2014 2015 2016 2017
Total Debts 2088600000 2599700000 2747200000 2293000000 2872000000
Equity/Shareholder's funds 6010800000 6176100000 6462100000 7180000000 7972000000
Debt-Equity Ratio
(debt / equity) 0.35 0.42 0.43 0.32 0.36
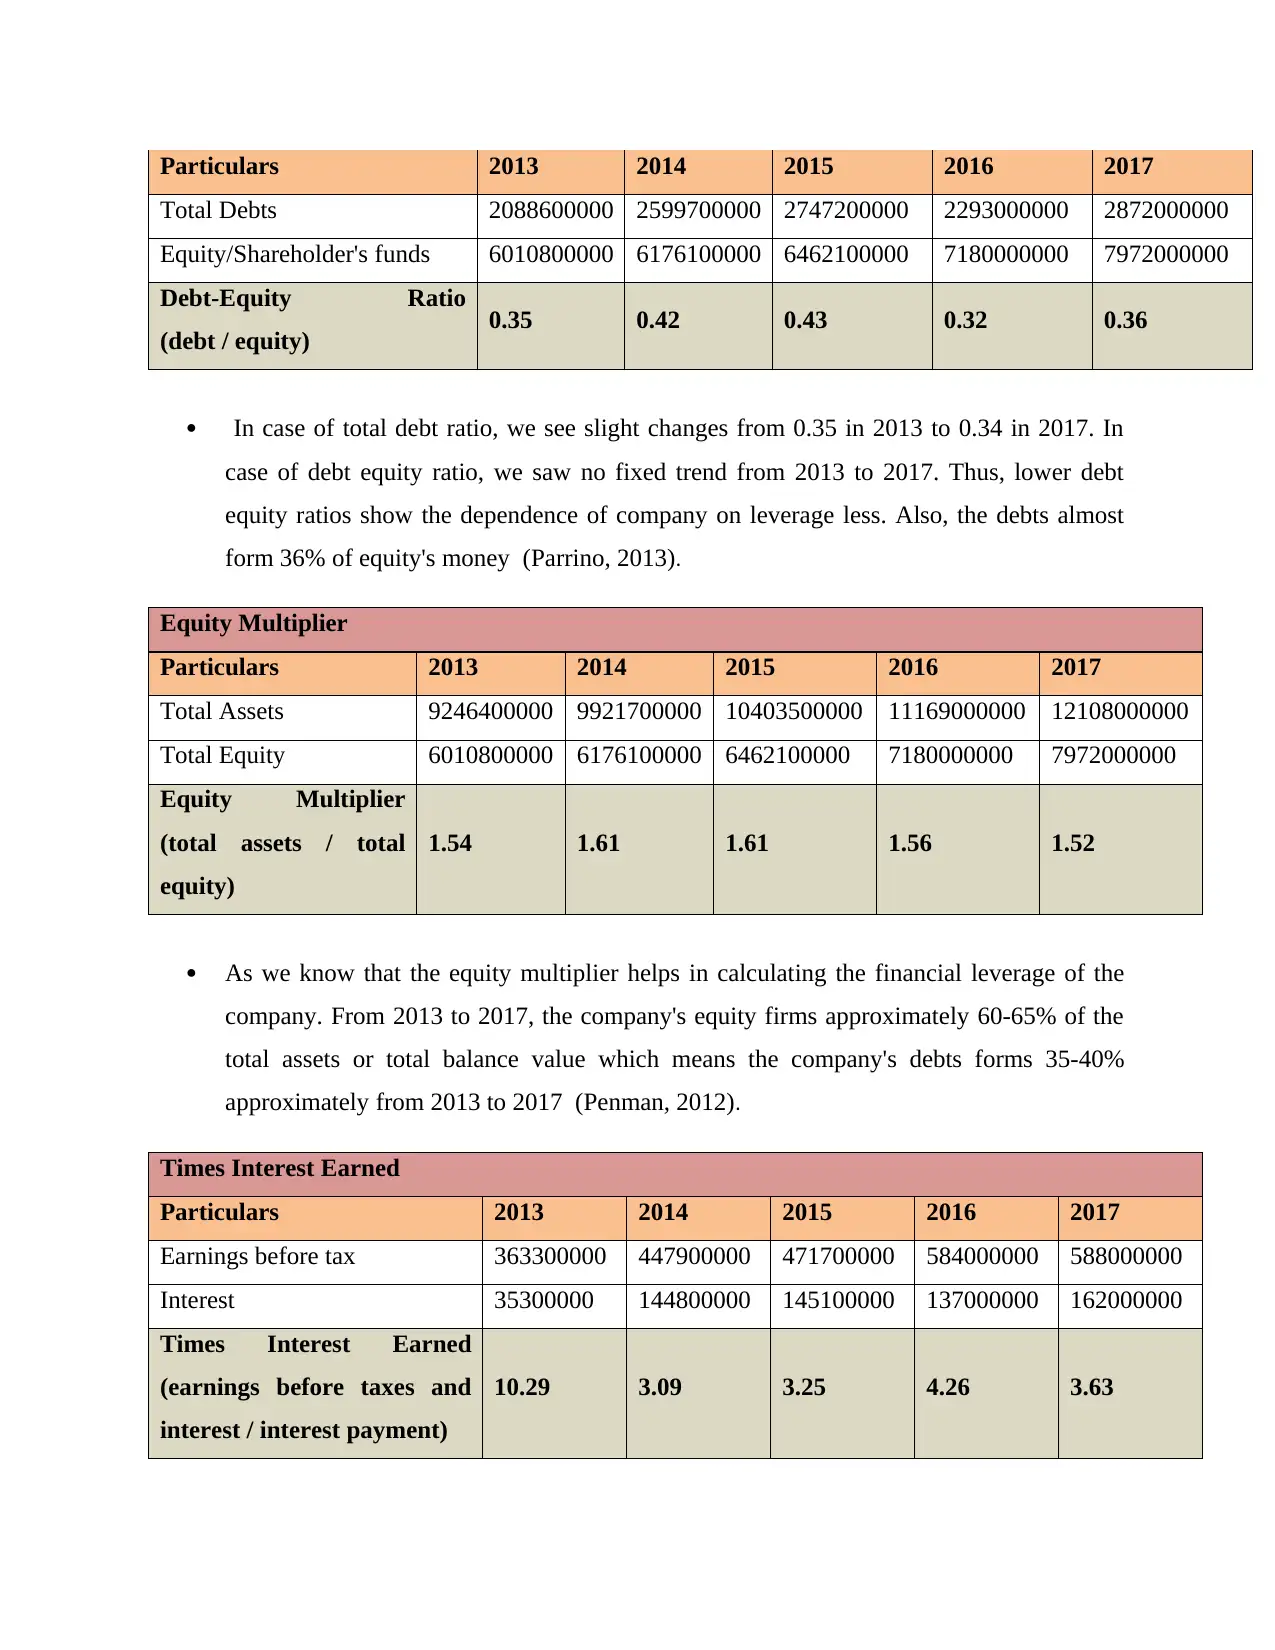
In case of total debt ratio, we see slight changes from 0.35 in 2013 to 0.34 in 2017. In
case of debt equity ratio, we saw no fixed trend from 2013 to 2017. Thus, lower debt
equity ratios show the dependence of company on leverage less. Also, the debts almost
form 36% of equity's money (Parrino, 2013).
Equity Multiplier
Particulars 2013 2014 2015 2016 2017
Total Assets 9246400000 9921700000 10403500000 11169000000 12108000000
Total Equity 6010800000 6176100000 6462100000 7180000000 7972000000
Equity Multiplier
(total assets / total
equity)
1.54 1.61 1.61 1.56 1.52
As we know that the equity multiplier helps in calculating the financial leverage of the
company. From 2013 to 2017, the company's equity firms approximately 60-65% of the
total assets or total balance value which means the company's debts forms 35-40%
approximately from 2013 to 2017 (Penman, 2012).
Times Interest Earned
Particulars 2013 2014 2015 2016 2017
Earnings before tax 363300000 447900000 471700000 584000000 588000000
Interest 35300000 144800000 145100000 137000000 162000000
Times Interest Earned
(earnings before taxes and
interest / interest payment)
10.29 3.09 3.25 4.26 3.63
Total Debts 2088600000 2599700000 2747200000 2293000000 2872000000
Equity/Shareholder's funds 6010800000 6176100000 6462100000 7180000000 7972000000
Debt-Equity Ratio
(debt / equity) 0.35 0.42 0.43 0.32 0.36
In case of total debt ratio, we see slight changes from 0.35 in 2013 to 0.34 in 2017. In
case of debt equity ratio, we saw no fixed trend from 2013 to 2017. Thus, lower debt
equity ratios show the dependence of company on leverage less. Also, the debts almost
form 36% of equity's money (Parrino, 2013).
Equity Multiplier
Particulars 2013 2014 2015 2016 2017
Total Assets 9246400000 9921700000 10403500000 11169000000 12108000000
Total Equity 6010800000 6176100000 6462100000 7180000000 7972000000
Equity Multiplier
(total assets / total
equity)
1.54 1.61 1.61 1.56 1.52
As we know that the equity multiplier helps in calculating the financial leverage of the
company. From 2013 to 2017, the company's equity firms approximately 60-65% of the
total assets or total balance value which means the company's debts forms 35-40%
approximately from 2013 to 2017 (Penman, 2012).
Times Interest Earned
Particulars 2013 2014 2015 2016 2017
Earnings before tax 363300000 447900000 471700000 584000000 588000000
Interest 35300000 144800000 145100000 137000000 162000000
Times Interest Earned
(earnings before taxes and
interest / interest payment)
10.29 3.09 3.25 4.26 3.63
Paraphrase This Document
Need a fresh take? Get an instant paraphrase of this document with our AI Paraphraser
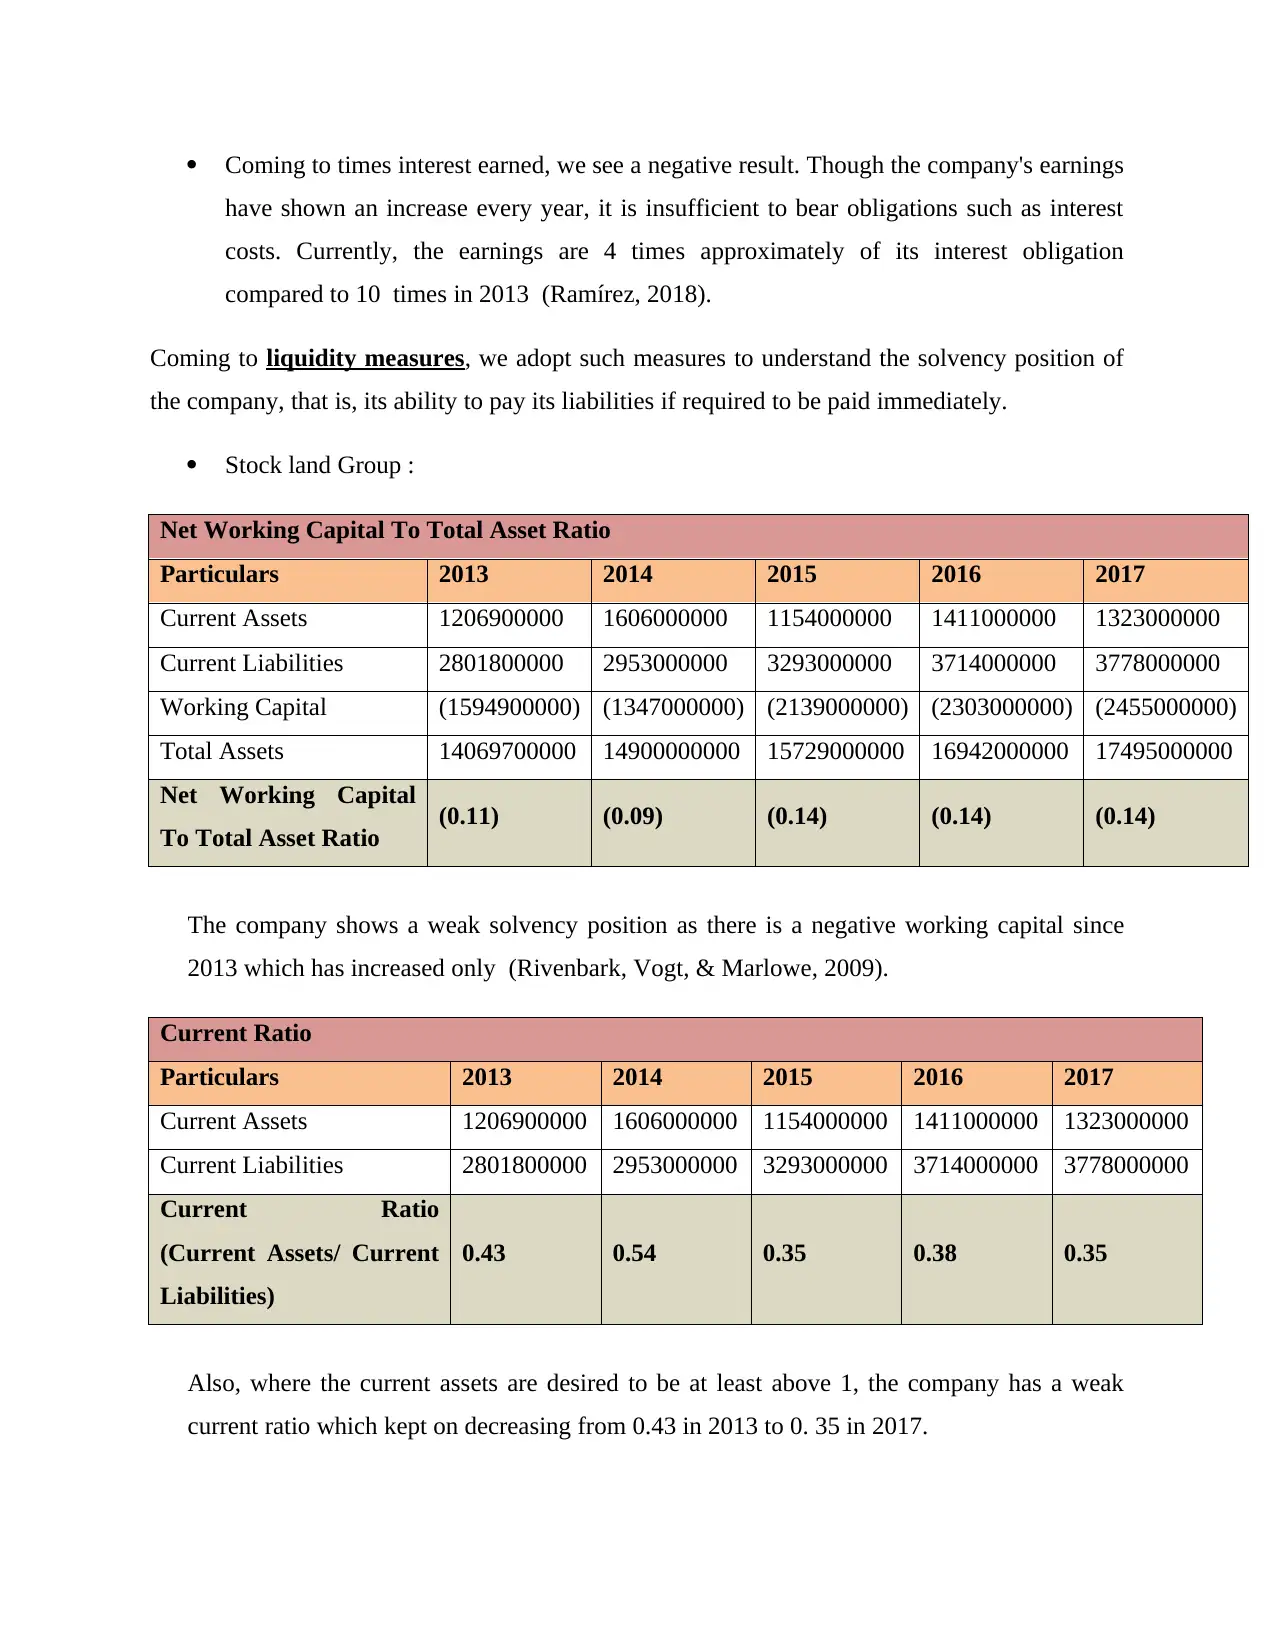
Coming to times interest earned, we see a negative result. Though the company's earnings
have shown an increase every year, it is insufficient to bear obligations such as interest
costs. Currently, the earnings are 4 times approximately of its interest obligation
compared to 10 times in 2013 (Ramírez, 2018).
Coming to liquidity measures, we adopt such measures to understand the solvency position of
the company, that is, its ability to pay its liabilities if required to be paid immediately.
Stock land Group :
Net Working Capital To Total Asset Ratio
Particulars 2013 2014 2015 2016 2017
Current Assets 1206900000 1606000000 1154000000 1411000000 1323000000
Current Liabilities 2801800000 2953000000 3293000000 3714000000 3778000000
Working Capital (1594900000) (1347000000) (2139000000) (2303000000) (2455000000)
Total Assets 14069700000 14900000000 15729000000 16942000000 17495000000
Net Working Capital
To Total Asset Ratio (0.11) (0.09) (0.14) (0.14) (0.14)
The company shows a weak solvency position as there is a negative working capital since
2013 which has increased only (Rivenbark, Vogt, & Marlowe, 2009).
Current Ratio
Particulars 2013 2014 2015 2016 2017
Current Assets 1206900000 1606000000 1154000000 1411000000 1323000000
Current Liabilities 2801800000 2953000000 3293000000 3714000000 3778000000
Current Ratio
(Current Assets/ Current
Liabilities)
0.43 0.54 0.35 0.38 0.35
Also, where the current assets are desired to be at least above 1, the company has a weak
current ratio which kept on decreasing from 0.43 in 2013 to 0. 35 in 2017.
Quick Ratio
Particulars 2013 2014 2015 2016 2017
Current Assets 1206900000 1606000000 1154000000 1411000000 1323000000
less : CA Other 810700000 753000000 881000000 1069000000 923000000
Quick Assets 396200000 853000000 273000000 342000000 400000000
Quick Liabilities 2801800000 2953000000 3293000000 3714000000 3778000000
Quick Ratio
( Quick Assets/Quick
Liabilities)
0.14 0.29 0.08 0.09 0.11
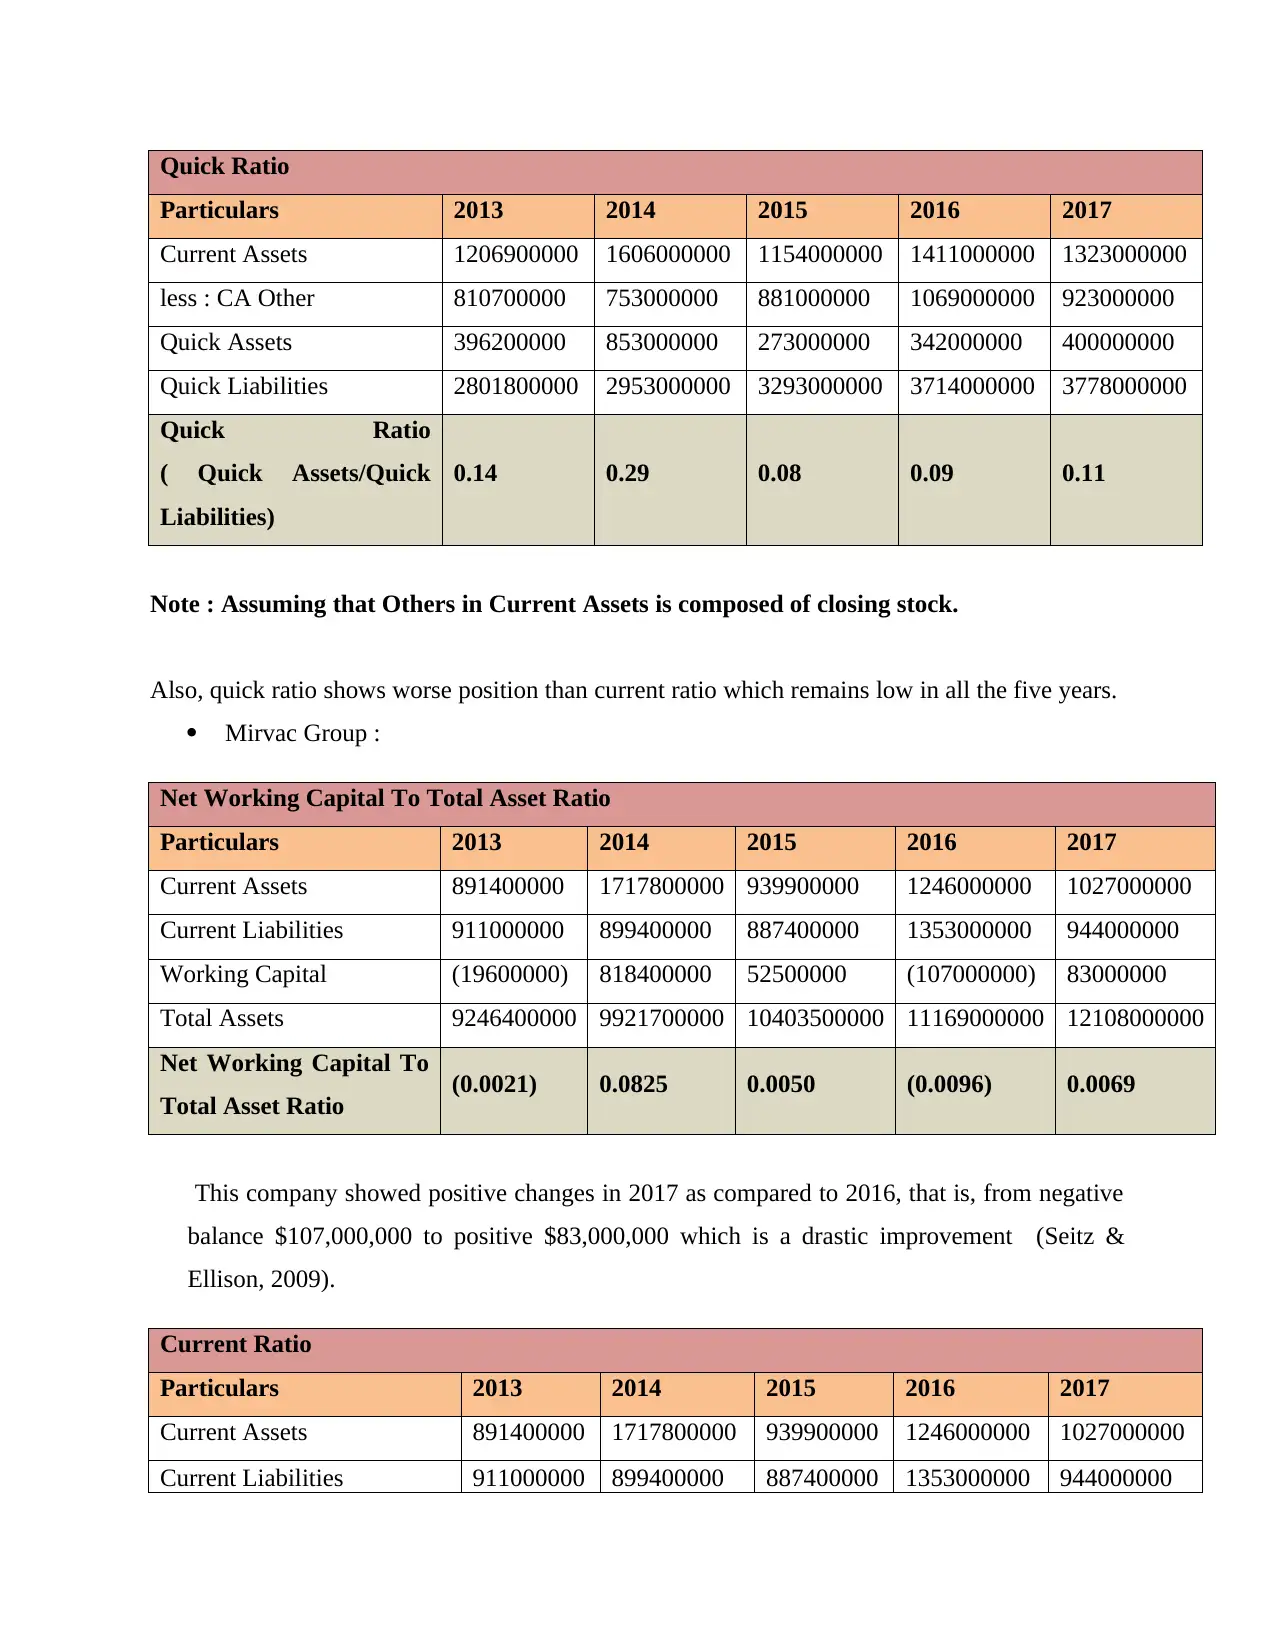
Note : Assuming that Others in Current Assets is composed of closing stock.
Also, quick ratio shows worse position than current ratio which remains low in all the five years.
Mirvac Group :
Net Working Capital To Total Asset Ratio
Particulars 2013 2014 2015 2016 2017
Current Assets 891400000 1717800000 939900000 1246000000 1027000000
Current Liabilities 911000000 899400000 887400000 1353000000 944000000
Working Capital (19600000) 818400000 52500000 (107000000) 83000000
Total Assets 9246400000 9921700000 10403500000 11169000000 12108000000
Net Working Capital To
Total Asset Ratio (0.0021) 0.0825 0.0050 (0.0096) 0.0069
This company showed positive changes in 2017 as compared to 2016, that is, from negative
balance $107,000,000 to positive $83,000,000 which is a drastic improvement (Seitz &
Ellison, 2009).
Current Ratio
Particulars 2013 2014 2015 2016 2017
Current Assets 891400000 1717800000 939900000 1246000000 1027000000
Current Liabilities 911000000 899400000 887400000 1353000000 944000000
Particulars 2013 2014 2015 2016 2017
Current Assets 1206900000 1606000000 1154000000 1411000000 1323000000
less : CA Other 810700000 753000000 881000000 1069000000 923000000
Quick Assets 396200000 853000000 273000000 342000000 400000000
Quick Liabilities 2801800000 2953000000 3293000000 3714000000 3778000000
Quick Ratio
( Quick Assets/Quick
Liabilities)
0.14 0.29 0.08 0.09 0.11
Note : Assuming that Others in Current Assets is composed of closing stock.
Also, quick ratio shows worse position than current ratio which remains low in all the five years.
Mirvac Group :
Net Working Capital To Total Asset Ratio
Particulars 2013 2014 2015 2016 2017
Current Assets 891400000 1717800000 939900000 1246000000 1027000000
Current Liabilities 911000000 899400000 887400000 1353000000 944000000
Working Capital (19600000) 818400000 52500000 (107000000) 83000000
Total Assets 9246400000 9921700000 10403500000 11169000000 12108000000
Net Working Capital To
Total Asset Ratio (0.0021) 0.0825 0.0050 (0.0096) 0.0069
This company showed positive changes in 2017 as compared to 2016, that is, from negative
balance $107,000,000 to positive $83,000,000 which is a drastic improvement (Seitz &
Ellison, 2009).
Current Ratio
Particulars 2013 2014 2015 2016 2017
Current Assets 891400000 1717800000 939900000 1246000000 1027000000
Current Liabilities 911000000 899400000 887400000 1353000000 944000000
⊘ This is a preview!⊘
Do you want full access?
Subscribe today to unlock all pages.
Trusted by 1+ million students worldwide
1 out of 29
Related Documents


Your All-in-One AI-Powered Toolkit for Academic Success.
+13062052269
info@desklib.com
Available 24*7 on WhatsApp / Email
![[object Object]](/_next/static/media/star-bottom.7253800d.svg)
Unlock your academic potential
Copyright © 2020–2026 A2Z Services. All Rights Reserved. Developed and managed by ZUCOL.