Data Analysis Homework: Store24 Case Study, Fall Semester Analysis

Verified

Added on  2022/08/09

|18
|1845
|438
Homework Assignment
AI Summary
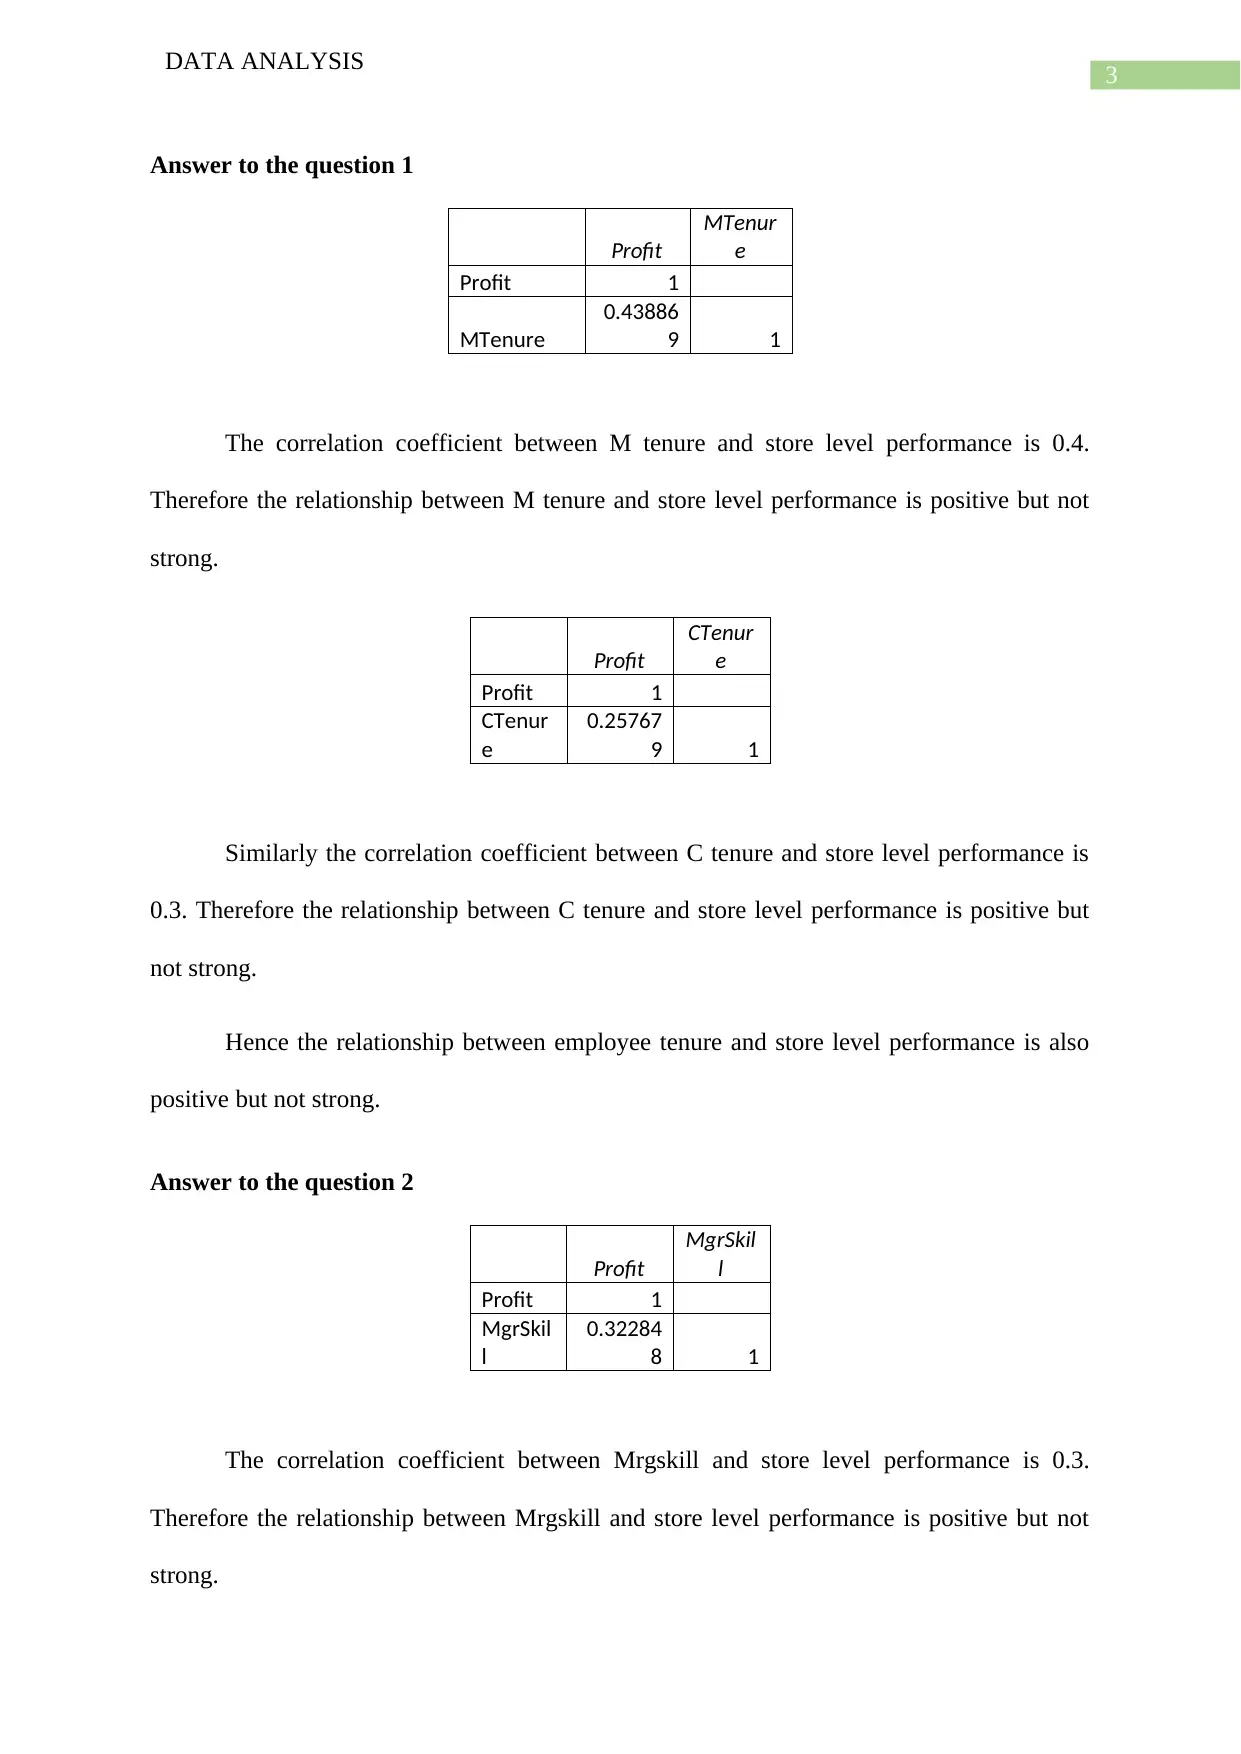
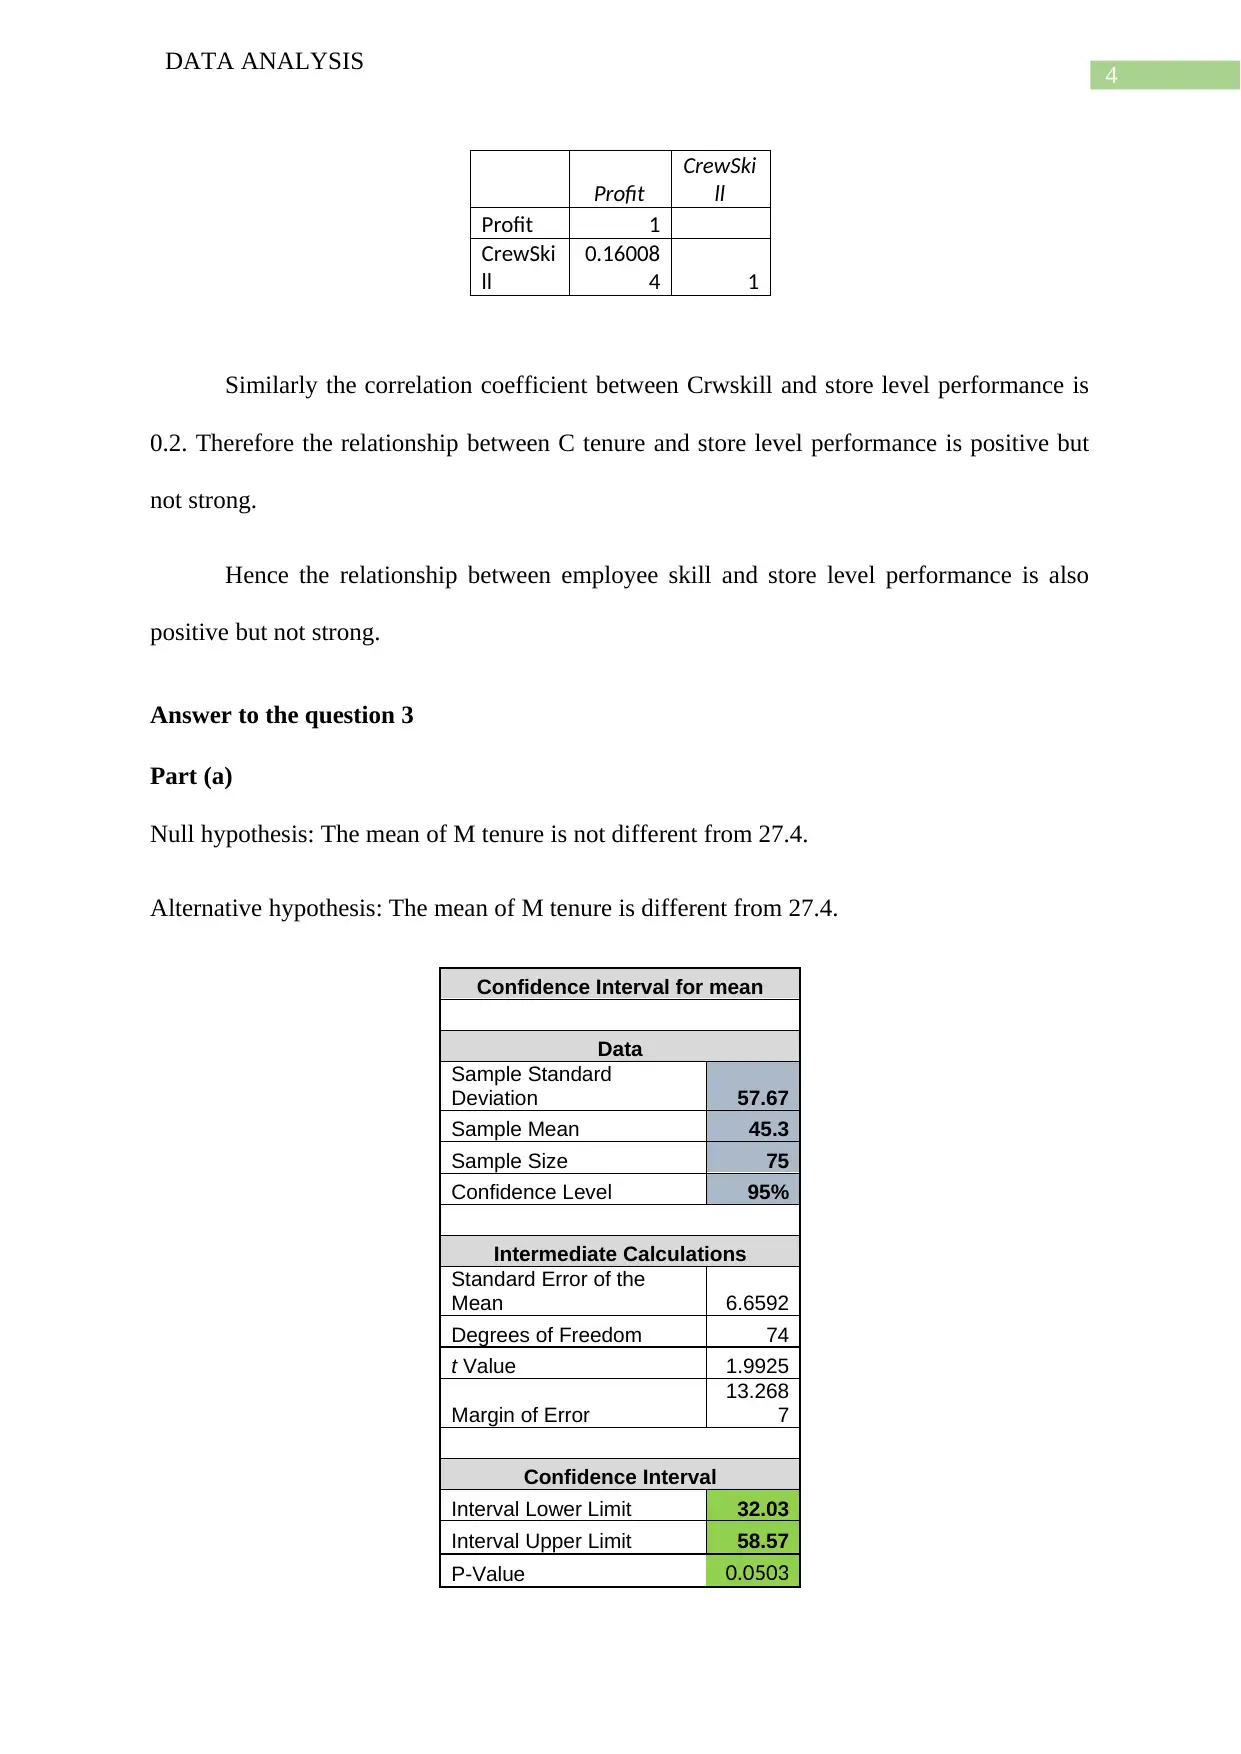
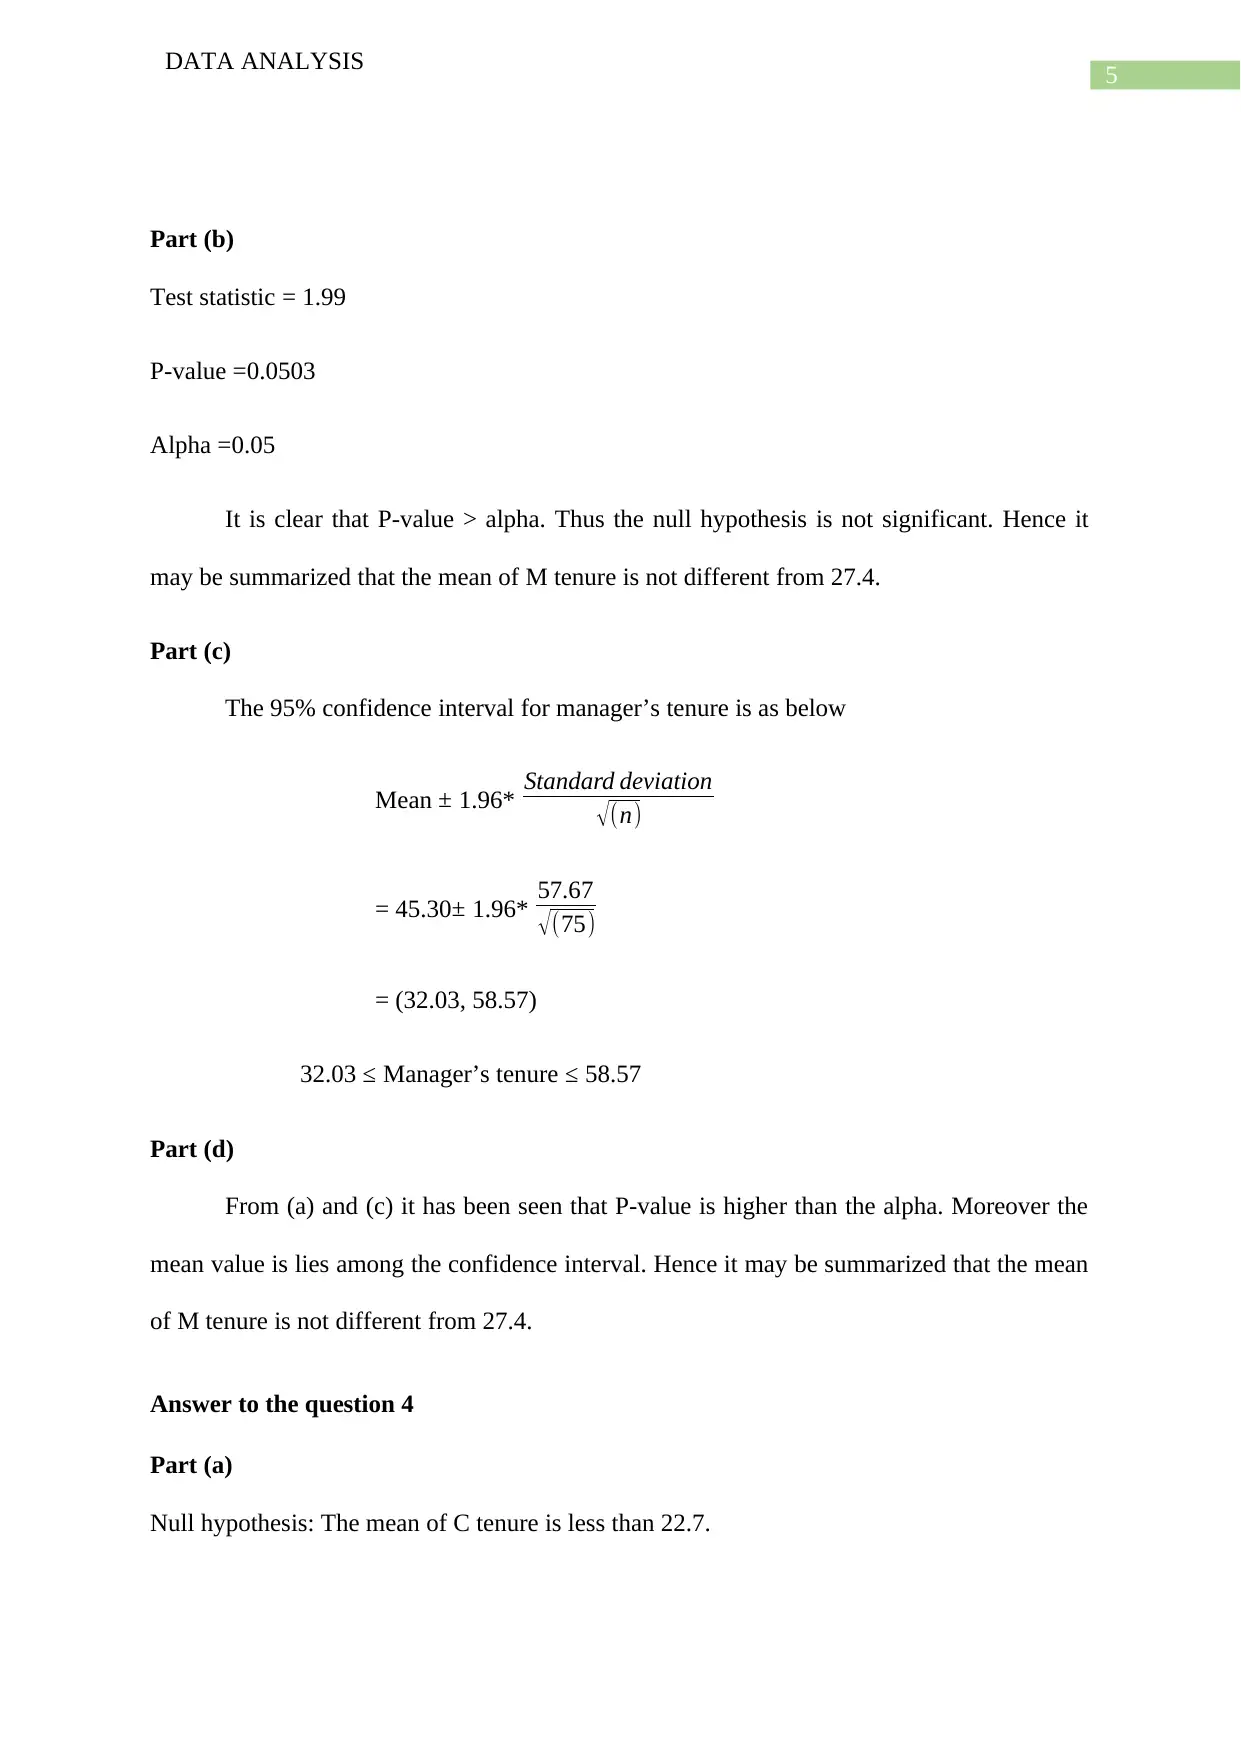
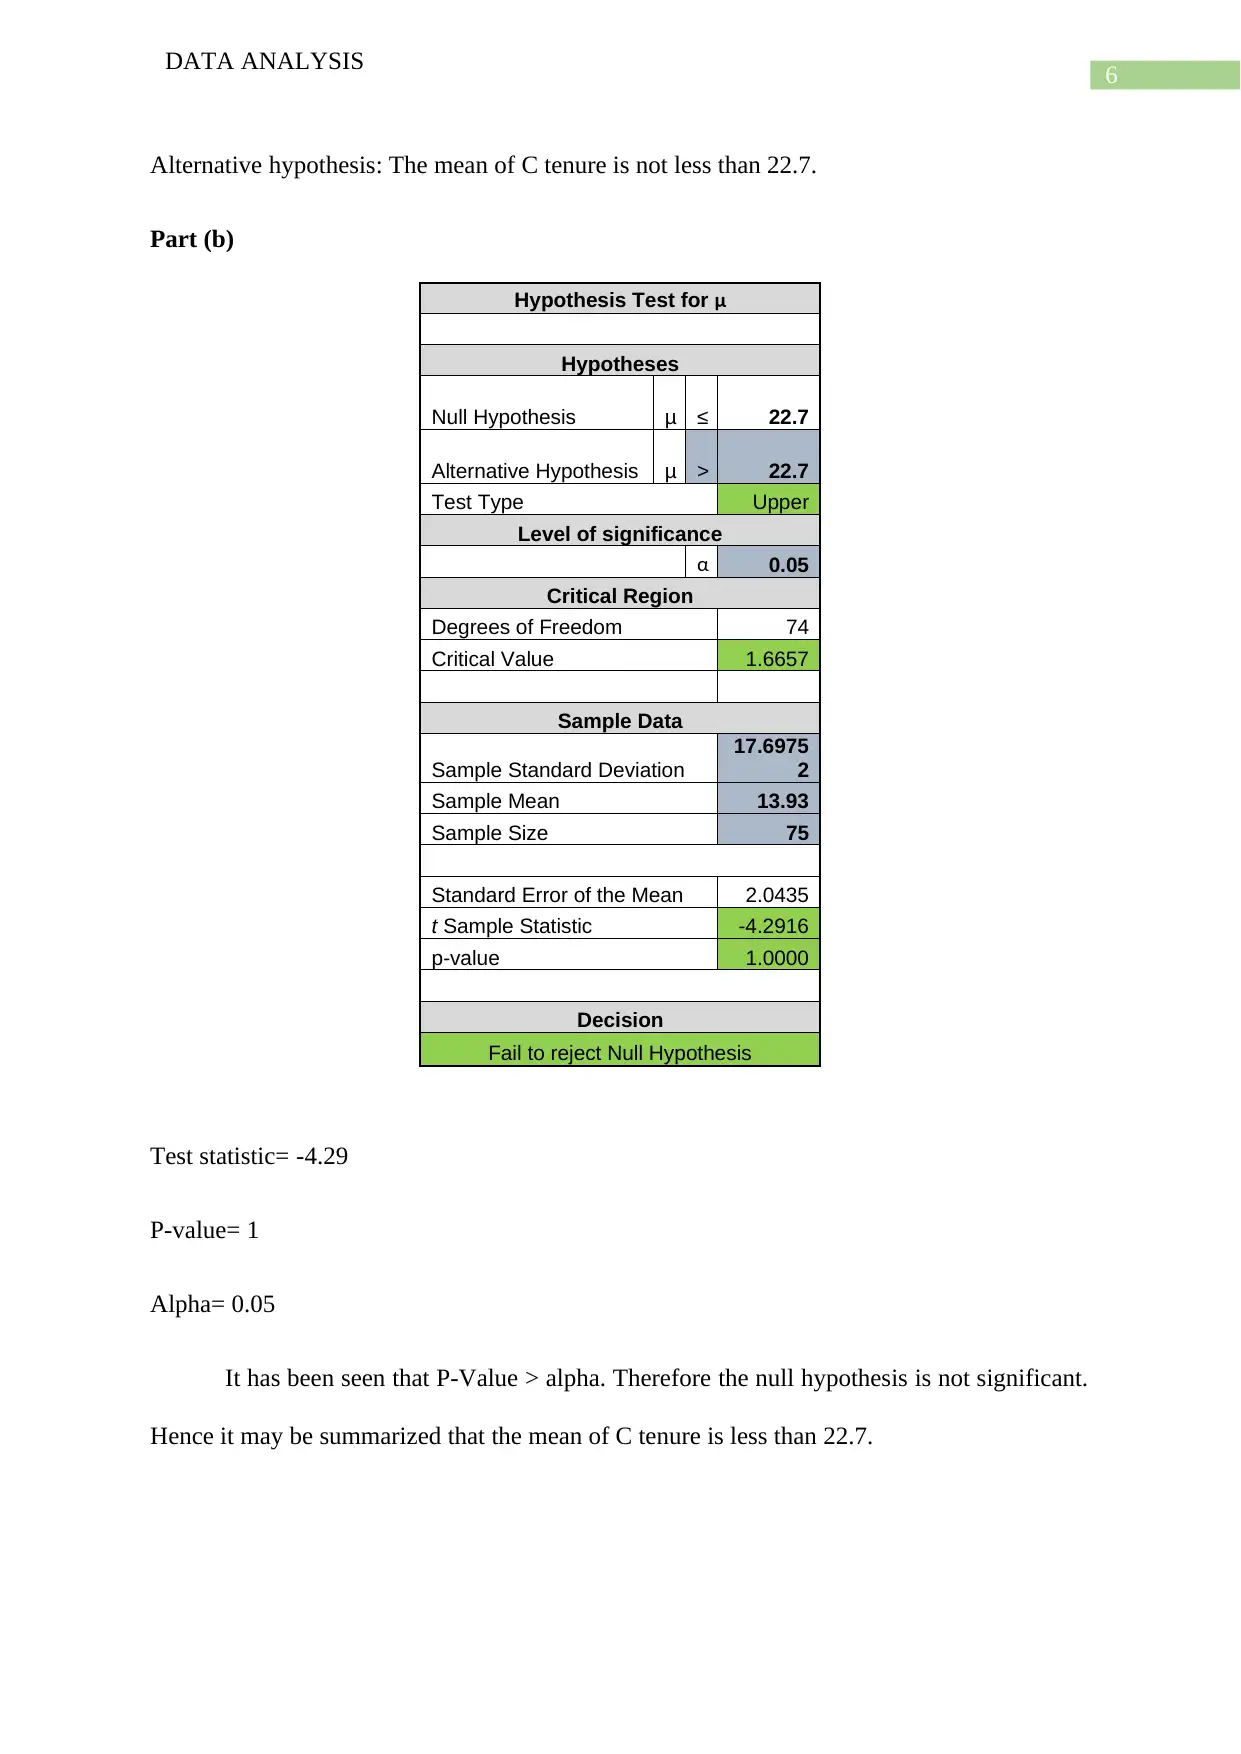
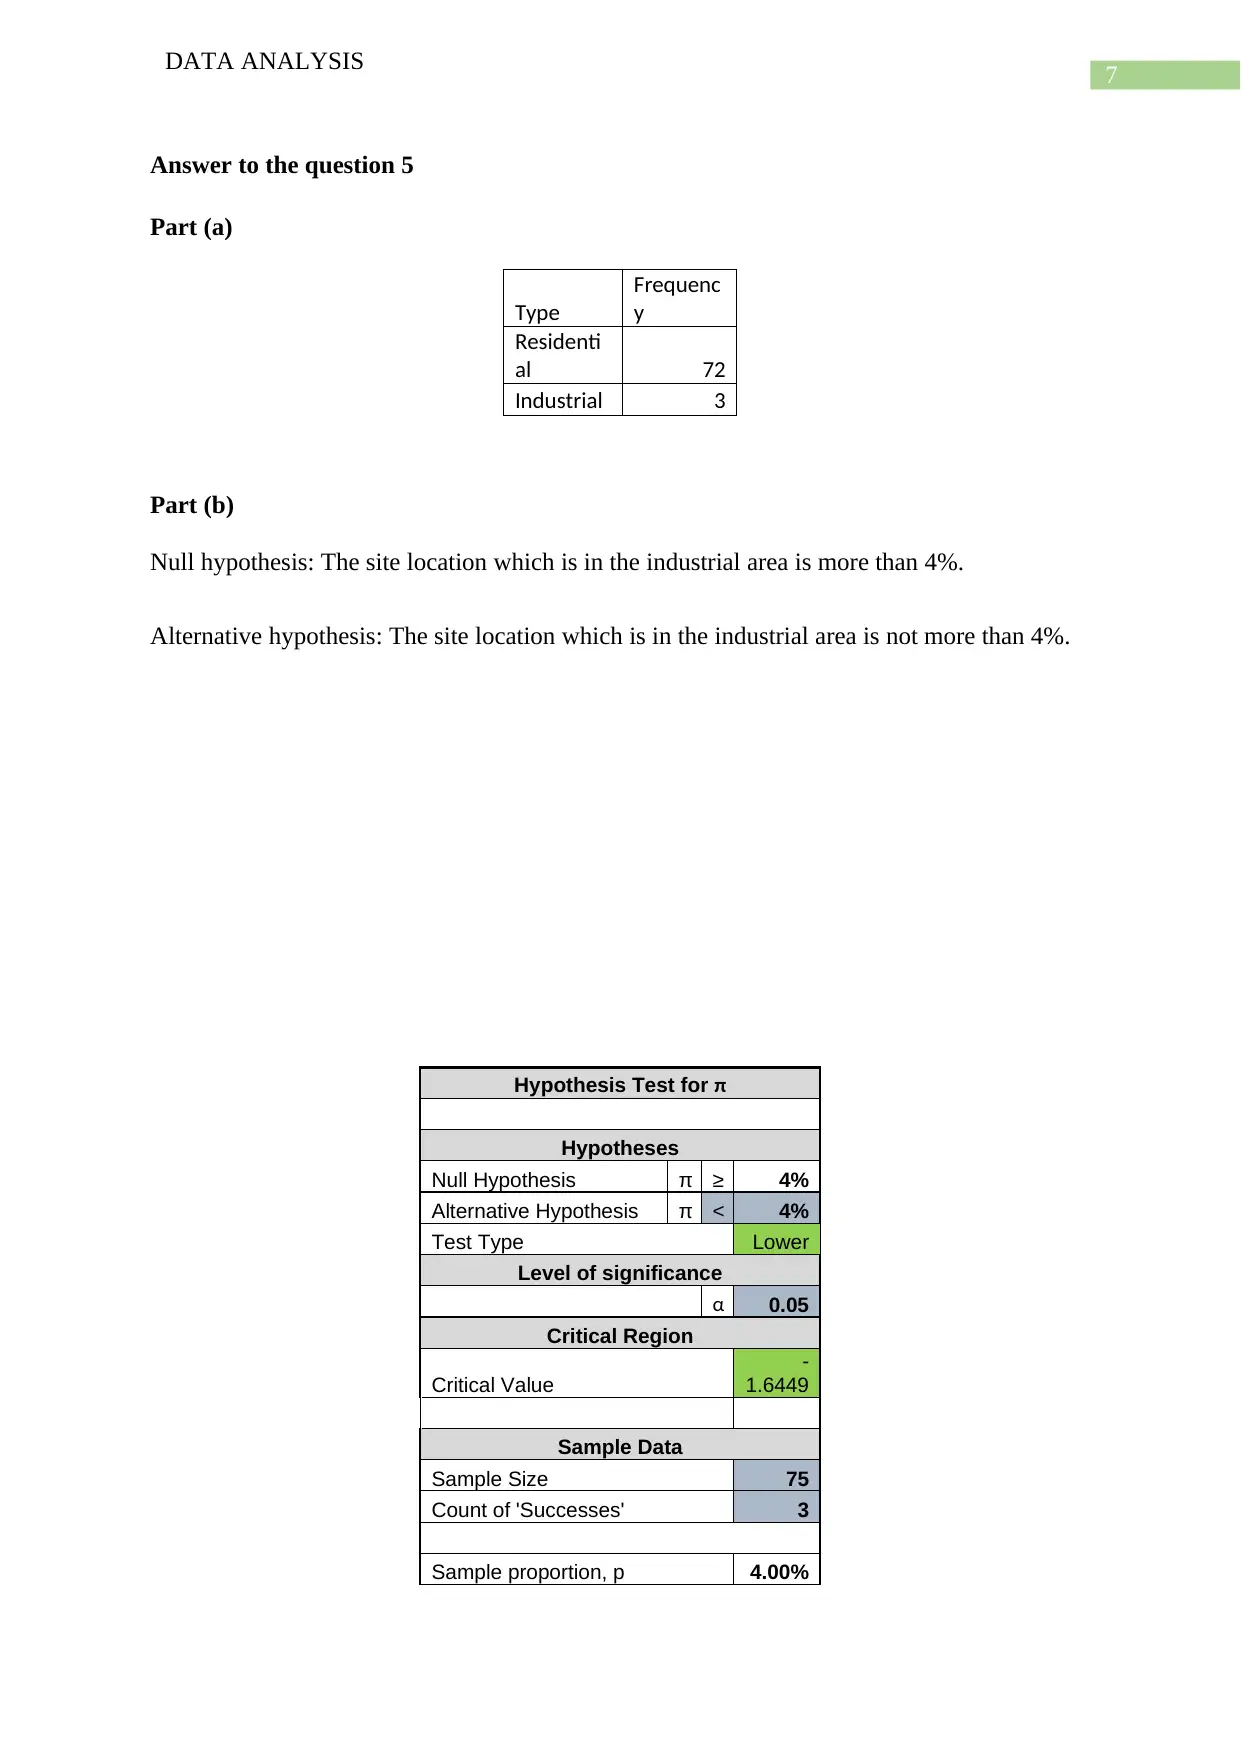
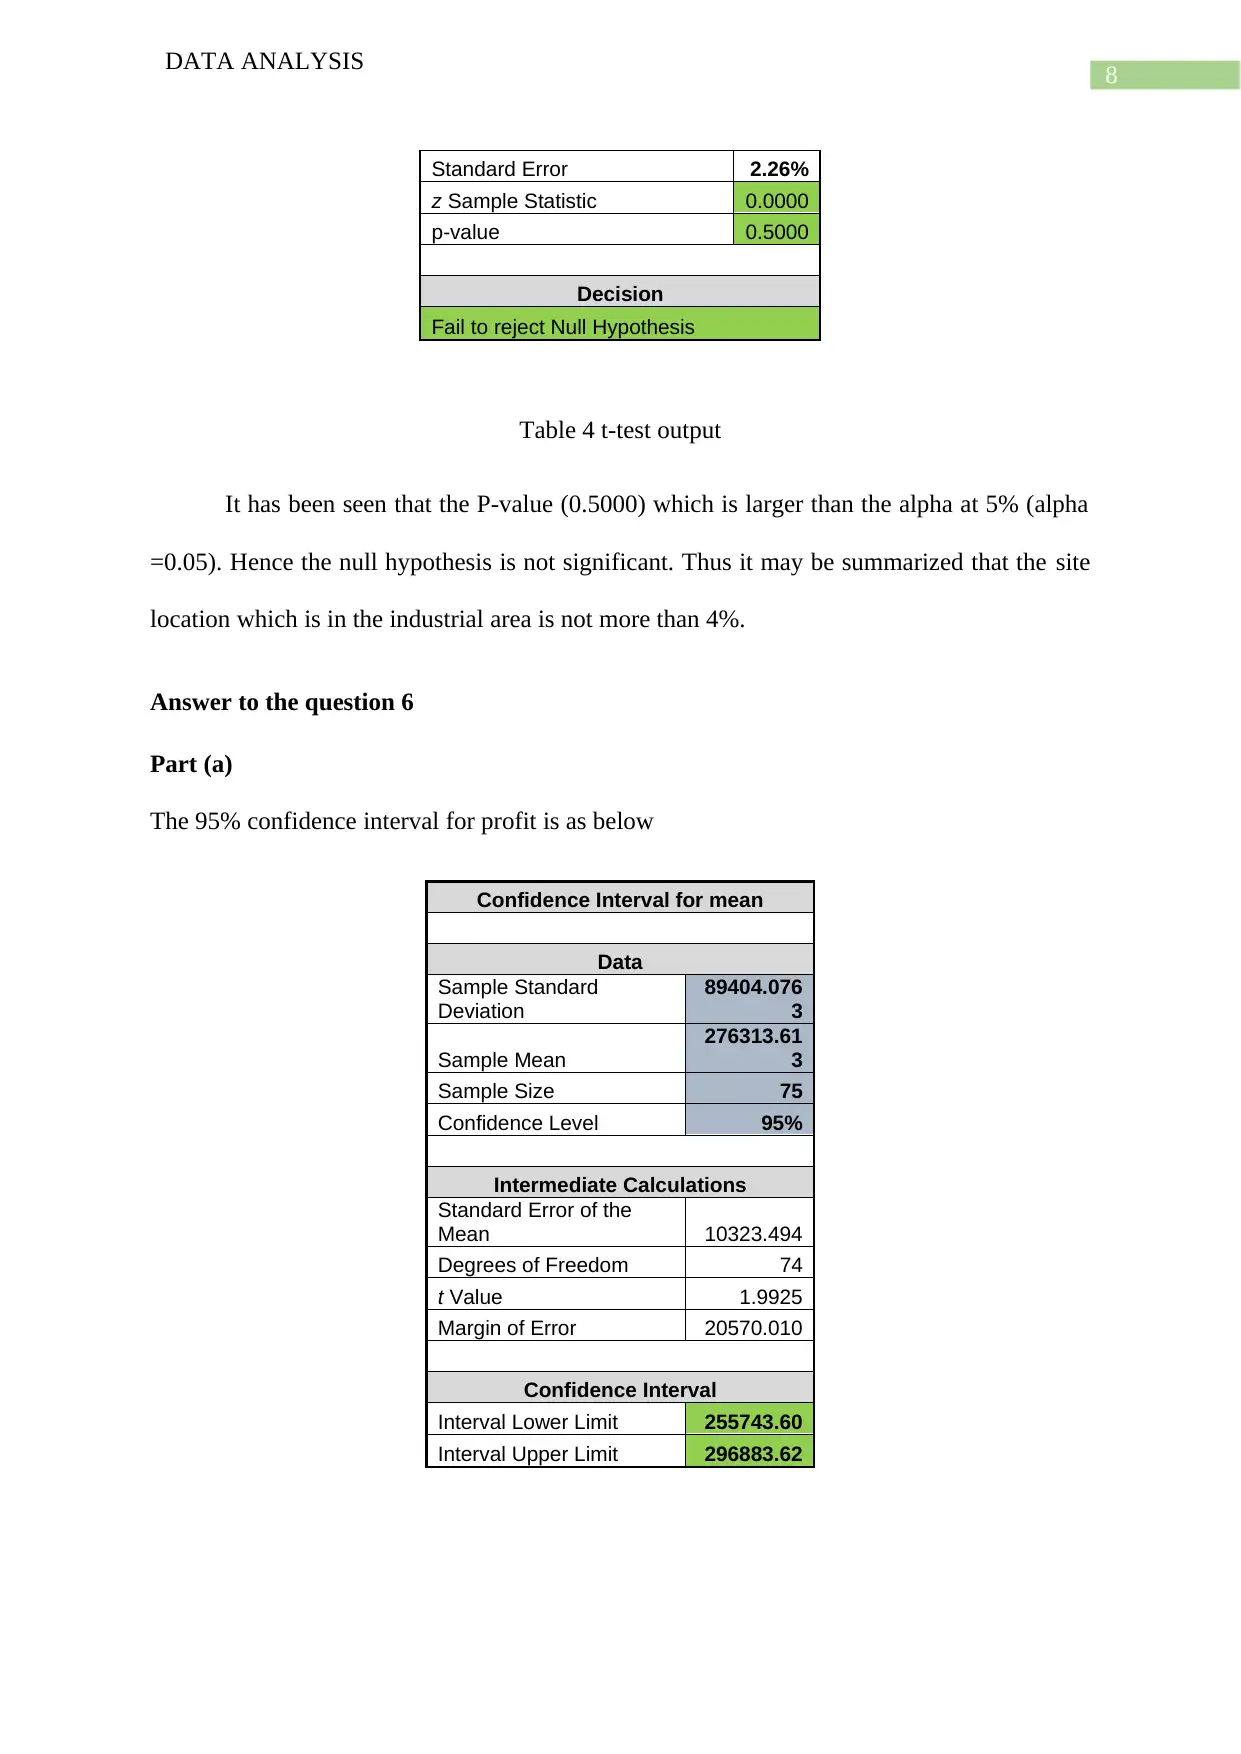
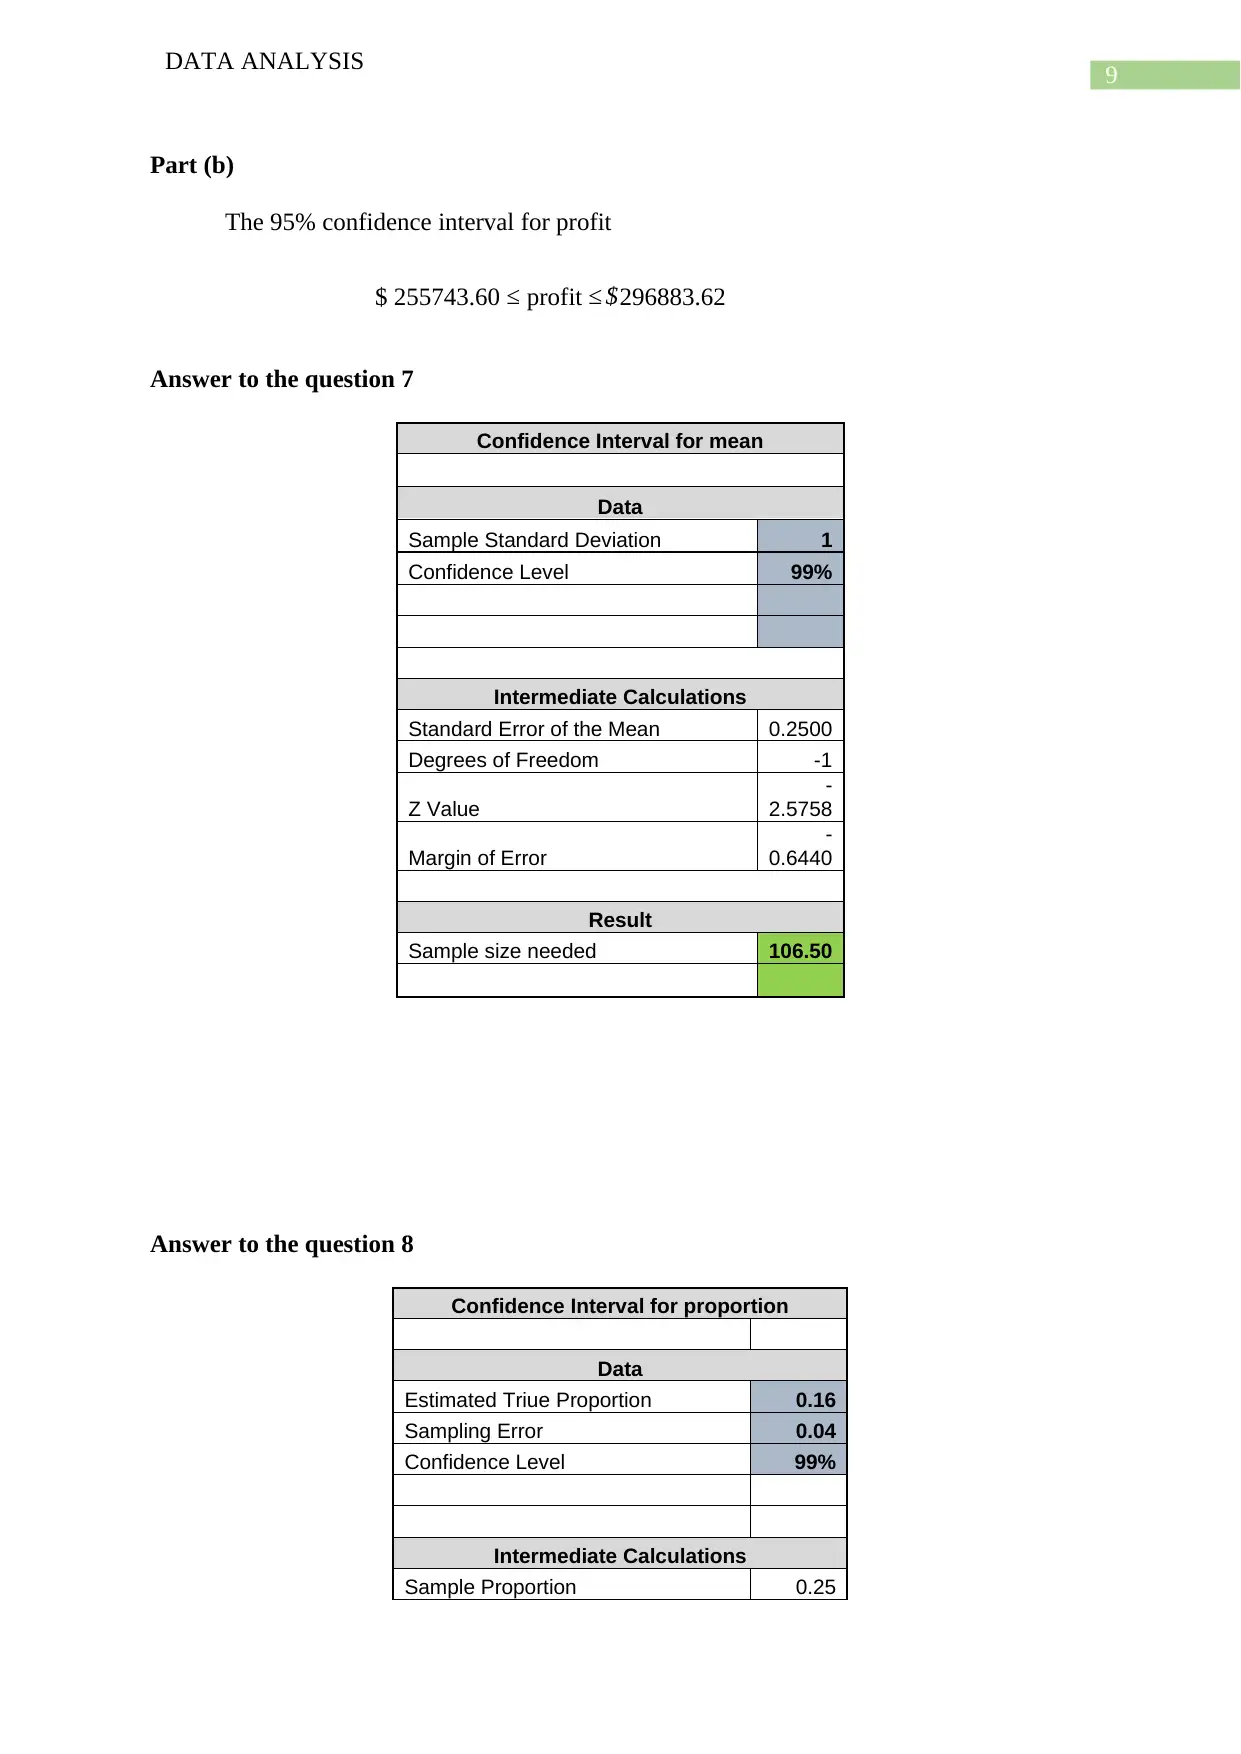
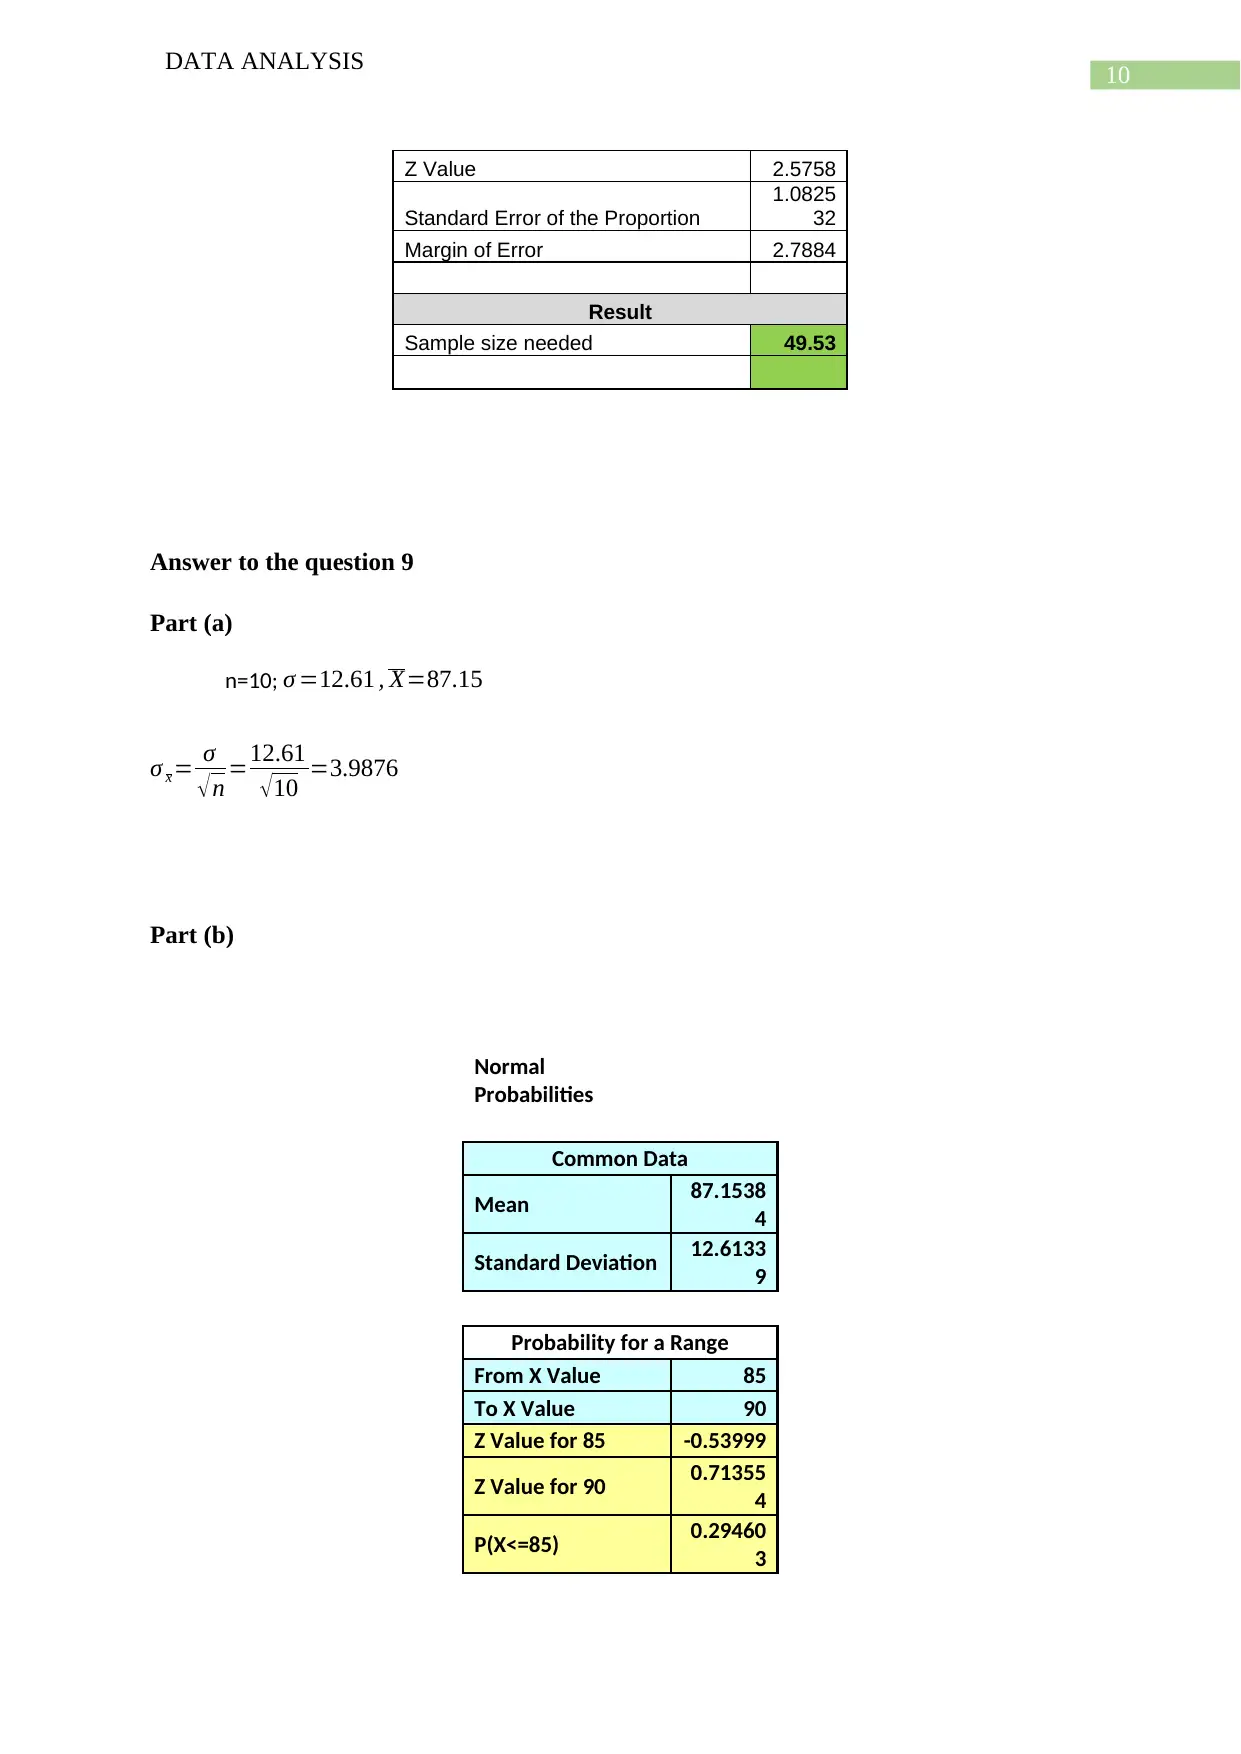
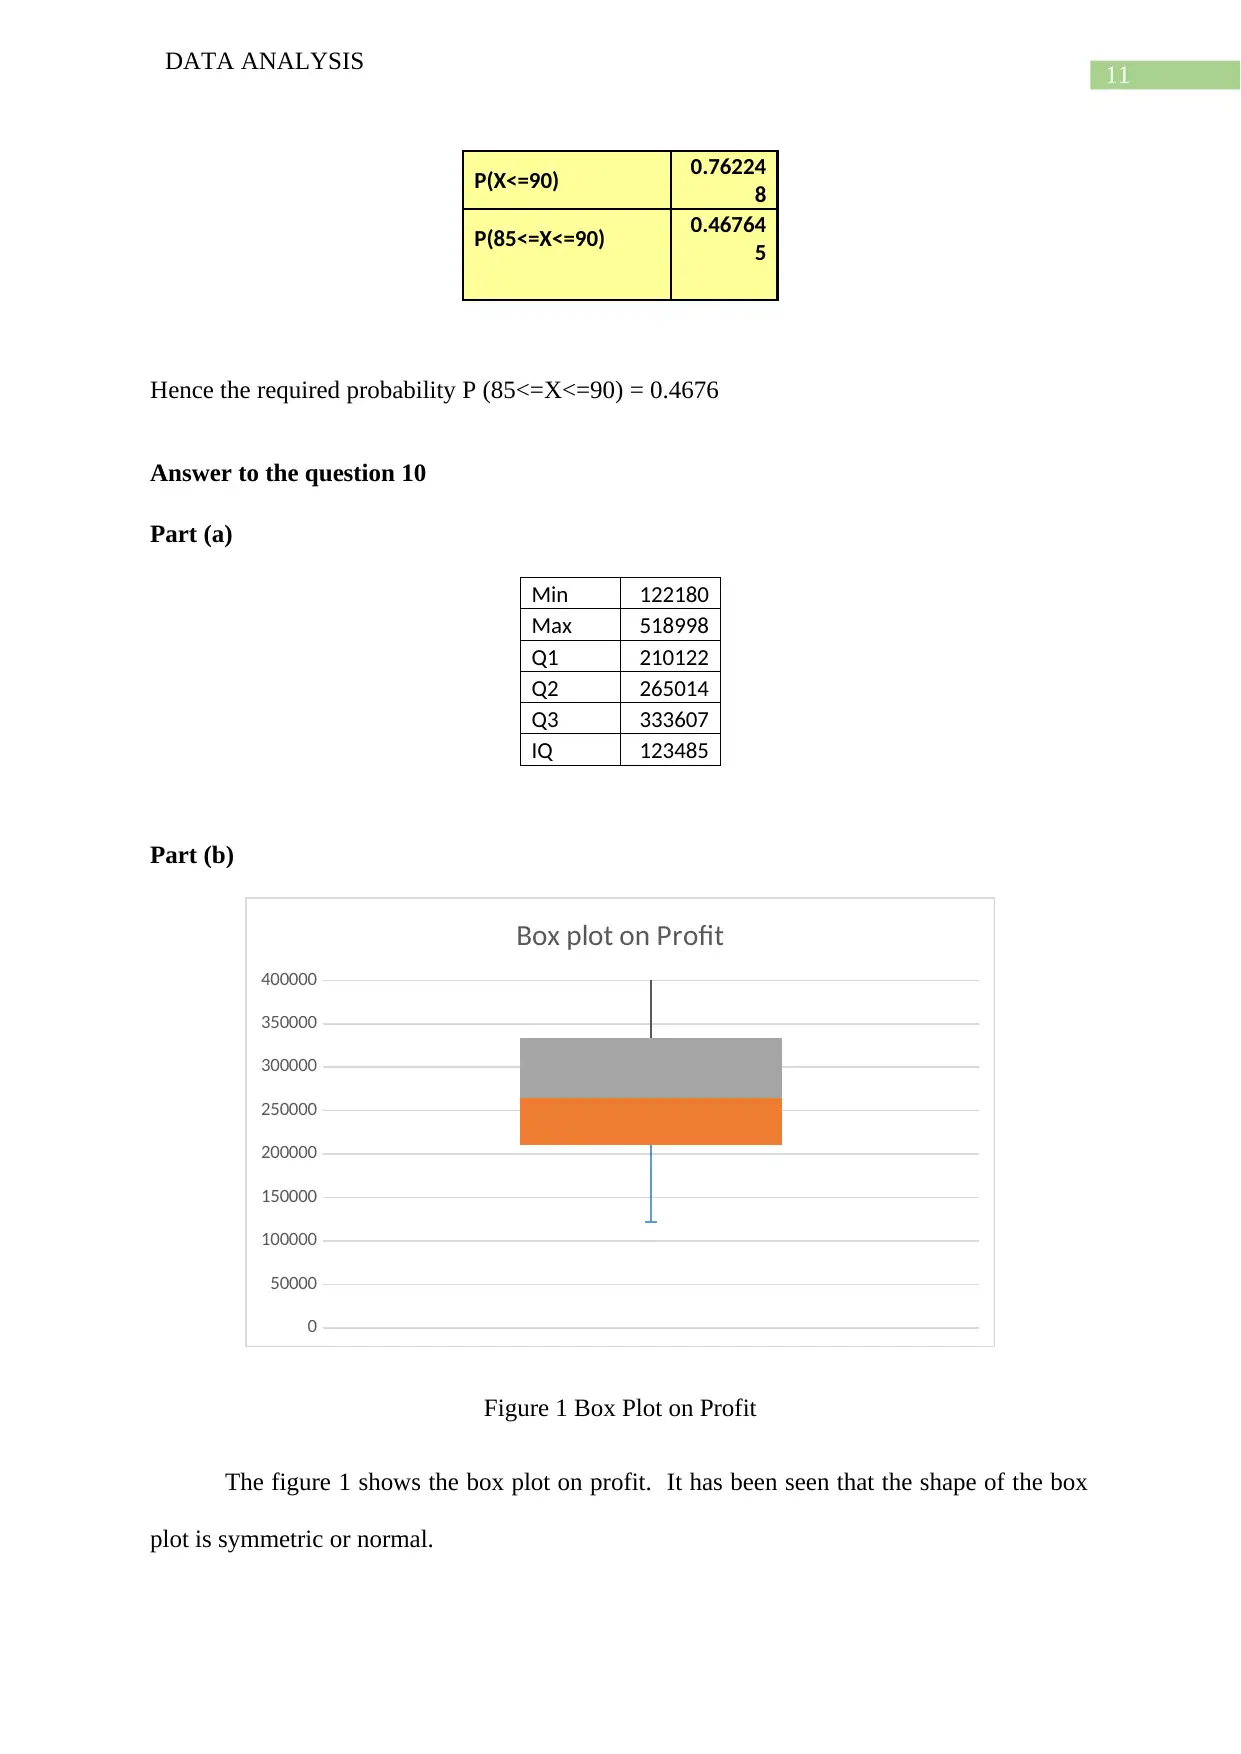
This document presents a comprehensive data analysis of the Store24 case study, focusing on employee retention. The analysis begins with correlation coefficient calculations to examine the relationship between employee tenure (both manager and crew) and store-level performance (profit). Further, the assignment delves into hypothesis testing, constructing confidence intervals, and calculating p-values to assess the significance of various factors, such as manager tenure and site location. Statistical methods include t-tests, z-tests, and the application of the empirical rule. The solution also incorporates box plots and scatter plots to visualize the data and identify patterns. The final analysis offers insights into the central issue of profit differences among different stores, concluding with a statistical determination of significant profit variations. The document also includes the construction of confidence intervals for profit and the determination of sample sizes.
Document Page
Running head: DATA ANALYSIS
Data Analysis
Name of the student:
Name of the University:
Author note:
tabler-icon-diamond-filled.svg

Paraphrase This Document

Need a fresh take? Get an instant paraphrase of this document with our AI Paraphraser
Document Page
1
DATA ANALYSIS
Table of Contents
Answer to the question 1............................................................................................................2
Answer to the question 2............................................................................................................3
Answer to the question 3............................................................................................................3
Part (a)....................................................................................................................................3
Part (b)....................................................................................................................................4
Part (c)....................................................................................................................................4
Part (d)....................................................................................................................................4
Answer to the question 4............................................................................................................4
Part (a)....................................................................................................................................4
Part (b)....................................................................................................................................5
Answer to the question 5............................................................................................................6
Part (a)....................................................................................................................................6
Part (b)....................................................................................................................................6
Answer to the question 6............................................................................................................7
Part (a)....................................................................................................................................7
Part (b)....................................................................................................................................7
Answer to the question 7............................................................................................................7
Answer to the question 8............................................................................................................7
Answer to the question 9............................................................................................................8
Part (a)....................................................................................................................................8
Part (b)....................................................................................................................................8
Document Page
2
DATA ANALYSIS
Answer to the question 10..........................................................................................................9
Part (a)....................................................................................................................................9
Part (b)....................................................................................................................................9
Answer to the question 11........................................................................................................10
Part (a)..................................................................................................................................10
Part (b)..................................................................................................................................10
Answer to the question 12........................................................................................................10
Answer to the question 13........................................................................................................11
Answer to the question 14........................................................................................................11
Answer to the question 15........................................................................................................11
Bibliography.............................................................................................................................13
Document Page
3
DATA ANALYSIS
Answer to the question 1
Profit
MTenur
e
Profit 1
MTenure
0.43886
9 1
The correlation coefficient between M tenure and store level performance is 0.4.
Therefore the relationship between M tenure and store level performance is positive but not
strong.
Profit
CTenur
e
Profit 1
CTenur
e
0.25767
9 1
Similarly the correlation coefficient between C tenure and store level performance is
0.3. Therefore the relationship between C tenure and store level performance is positive but
not strong.
Hence the relationship between employee tenure and store level performance is also
positive but not strong.
Answer to the question 2
Profit
MgrSkil
l
Profit 1
MgrSkil
l
0.32284
8 1
The correlation coefficient between Mrgskill and store level performance is 0.3.
Therefore the relationship between Mrgskill and store level performance is positive but not
strong.
tabler-icon-diamond-filled.svg

Paraphrase This Document

Need a fresh take? Get an instant paraphrase of this document with our AI Paraphraser
Document Page
4
DATA ANALYSIS
Profit
CrewSki
ll
Profit 1
CrewSki
ll
0.16008
4 1
Similarly the correlation coefficient between Crwskill and store level performance is
0.2. Therefore the relationship between C tenure and store level performance is positive but
not strong.
Hence the relationship between employee skill and store level performance is also
positive but not strong.
Answer to the question 3
Part (a)
Null hypothesis: The mean of M tenure is not different from 27.4.
Alternative hypothesis: The mean of M tenure is different from 27.4.
Confidence Interval for mean
Data
Sample Standard
Deviation 57.67
Sample Mean 45.3
Sample Size 75
Confidence Level 95%
Intermediate Calculations
Standard Error of the
Mean 6.6592
Degrees of Freedom 74
t Value 1.9925
Margin of Error
13.268
7
Confidence Interval
Interval Lower Limit 32.03
Interval Upper Limit 58.57
P-Value 0.0503
Document Page
5
DATA ANALYSIS
Part (b)
Test statistic = 1.99
P-value =0.0503
Alpha =0.05
It is clear that P-value > alpha. Thus the null hypothesis is not significant. Hence it
may be summarized that the mean of M tenure is not different from 27.4.
Part (c)
The 95% confidence interval for manager’s tenure is as below
Mean ± 1.96* Standard deviation
(n)
= 45.30± 1.96* 57.67
(75)
= (32.03, 58.57)
32.03 Manager’s tenure 58.57
Part (d)
From (a) and (c) it has been seen that P-value is higher than the alpha. Moreover the
mean value is lies among the confidence interval. Hence it may be summarized that the mean
of M tenure is not different from 27.4.
Answer to the question 4
Part (a)
Null hypothesis: The mean of C tenure is less than 22.7.
Document Page
6
DATA ANALYSIS
Alternative hypothesis: The mean of C tenure is not less than 22.7.
Part (b)
Hypothesis Test for μ
Hypotheses
Null Hypothesis μ 22.7
Alternative Hypothesis μ > 22.7
Test Type Upper
Level of significance
α 0.05
Critical Region
Degrees of Freedom 74
Critical Value 1.6657
Sample Data
Sample Standard Deviation
17.6975
2
Sample Mean 13.93
Sample Size 75
Standard Error of the Mean 2.0435
t Sample Statistic -4.2916
p-value 1.0000
Decision
Fail to reject Null Hypothesis
Test statistic= -4.29
P-value= 1
Alpha= 0.05
It has been seen that P-Value > alpha. Therefore the null hypothesis is not significant.
Hence it may be summarized that the mean of C tenure is less than 22.7.
tabler-icon-diamond-filled.svg

Paraphrase This Document

Need a fresh take? Get an instant paraphrase of this document with our AI Paraphraser
Document Page
7
DATA ANALYSIS
Answer to the question 5
Part (a)
Type
Frequenc
y
Residenti
al 72
Industrial 3
Part (b)
Null hypothesis: The site location which is in the industrial area is more than 4%.
Alternative hypothesis: The site location which is in the industrial area is not more than 4%.
Hypothesis Test for π
Hypotheses
Null Hypothesis π 4%
Alternative Hypothesis π < 4%
Test Type Lower
Level of significance
α 0.05
Critical Region
Critical Value
-
1.6449
Sample Data
Sample Size 75
Count of 'Successes' 3
Sample proportion, p 4.00%
Document Page
8
DATA ANALYSIS
Standard Error 2.26%
z Sample Statistic 0.0000
p-value 0.5000
Decision
Fail to reject Null Hypothesis
Table 4 t-test output
It has been seen that the P-value (0.5000) which is larger than the alpha at 5% (alpha
=0.05). Hence the null hypothesis is not significant. Thus it may be summarized that the site
location which is in the industrial area is not more than 4%.
Answer to the question 6
Part (a)
The 95% confidence interval for profit is as below
Confidence Interval for mean
Data
Sample Standard
Deviation
89404.076
3
Sample Mean
276313.61
3
Sample Size 75
Confidence Level 95%
Intermediate Calculations
Standard Error of the
Mean 10323.494
Degrees of Freedom 74
t Value 1.9925
Margin of Error 20570.010
Confidence Interval
Interval Lower Limit 255743.60
Interval Upper Limit 296883.62
Document Page
9
DATA ANALYSIS
Part (b)
The 95% confidence interval for profit
$ 255743.60 profit $296883.62
Answer to the question 7
Confidence Interval for mean
Data
Sample Standard Deviation 1
Confidence Level 99%
Intermediate Calculations
Standard Error of the Mean 0.2500
Degrees of Freedom -1
Z Value
-
2.5758
Margin of Error
-
0.6440
Result
Sample size needed 106.50
Answer to the question 8
Confidence Interval for proportion
Data
Estimated Triue Proportion 0.16
Sampling Error 0.04
Confidence Level 99%
Intermediate Calculations
Sample Proportion 0.25
tabler-icon-diamond-filled.svg

Paraphrase This Document

Need a fresh take? Get an instant paraphrase of this document with our AI Paraphraser
Document Page
10
DATA ANALYSIS
Z Value 2.5758
Standard Error of the Proportion
1.0825
32
Margin of Error 2.7884
Result
Sample size needed 49.53
Answer to the question 9
Part (a)
n=10; σ =12.61 , X=87.15
σ x= σ
n =12.61
10 =3.9876
Part (b)
Normal
Probabilities
Common Data
Mean 87.1538
4
Standard Deviation 12.6133
9
Probability for a Range
From X Value 85
To X Value 90
Z Value for 85 -0.53999
Z Value for 90 0.71355
4
P(X<=85) 0.29460
3
Document Page
11
DATA ANALYSIS
P(X<=90) 0.76224
8
P(85<=X<=90) 0.46764
5
Hence the required probability P (85<=X<=90) = 0.4676
Answer to the question 10
Part (a)
Min 122180
Max 518998
Q1 210122
Q2 265014
Q3 333607
IQ 123485
Part (b)
0
50000
100000
150000
200000
250000
300000
350000
400000
Box plot on Profit
Figure 1 Box Plot on Profit
The figure 1 shows the box plot on profit. It has been seen that the shape of the box
plot is symmetric or normal.
chevron_up_icon
1 out of 18
circle_padding
hide_on_mobile
zoom_out_icon
[object Object]