MIS771: Analysis of Customer Satisfaction and Strategic Alliance
VerifiedAdded on 2021/06/14
|16
|3376
|80
Report
AI Summary
This report presents a descriptive analytics and visualization analysis conducted for AusPaper, an Australian paper products manufacturer. The study, commissioned by ANALYTICS7, explores customer satisfaction, strategic alliance potential, and financial turnover forecasts. The data analysis includes customer satisfaction ratings, correlation analysis to identify key variables, and regression analysis to build a prediction model for customer satisfaction. The report identifies product quality, product line, delivery speed, and salesforce image as significant factors influencing customer satisfaction. Additionally, it investigates the potential for strategic alliances and provides an annual quarterly turnover forecast. The report also includes an interaction effect analysis examining the influence of product line breadth and depth on customer satisfaction across different market regions. Findings indicate that the regression model is significant and can explain 78 percent variability in customer satisfaction. The report concludes with key insights and recommendations to strengthen customer relationships and inform business strategies.
Running Head: MIS771: DESCRIPTIVE ANALYTICS AND VISUALIZATION
MIS771
Descriptive Analytics And Visualization
Name of the Student
Name of the University
Author Note
MIS771
Descriptive Analytics And Visualization
Name of the Student
Name of the University
Author Note
Paraphrase This Document
Need a fresh take? Get an instant paraphrase of this document with our AI Paraphraser
1MIS771: DESCRIPTIVE ANALYTICS AND VISUALIZATION
Table of Contents
1.0 Introduction................................................................................................................................2
2.0 Data Collection Procedure.........................................................................................................3
3.0 Data Description........................................................................................................................3
4.0 Data Analysis.............................................................................................................................4
4.1 Analysis of the Dependent Variable......................................................................................4
4.2 Factors Influencing Customer Satisfaction............................................................................6
4.2.1 Identifying Relevant Variables.......................................................................................6
4.2.2 Building the final Prediction Model...............................................................................7
4.3 Interaction Effect...................................................................................................................9
4.4 Strategic Alliance Partnership.............................................................................................10
4.5 Annual Quarterly Turnover Forecast...................................................................................12
5.0 Conclusion...............................................................................................................................13
References......................................................................................................................................14
Appendix........................................................................................................................................15
2MIS771: DESCRIPTIVE ANALYTICS AND VISUALIZATION
1.0 Introduction
AusPaper is an Australian company who have been manufacturing paper products from a
very long time. The company is a subsidiary company to Pinon Paper Industries. The company
has been running extremely successfully from its establishment. In the year of 2013, the
company has produced paper products of 619,000 tonnes and had a sell of paper products of
more than 690,000 tonnes. They sold this amount of products in the local market as well as in the
overseas market. They have export relations with more than 75 countries all over the globe
spread across Asia, Europe, USA, Middle East, Africa, Latin America as well as in the Indian
Subcontinent.
The company has their selling partners in two different market segments. They are in the
newspaper market where they provide paper products to the leading newspapers such as Herald
Sun, Australian Financial Review, etc. and also the magazine industry where the paper products
are sold to the leading magazines such as Mens’ Style Magazine, Homes and Gardens etc. AusPaper
has two different ways of selling these paper products to the market. Either they sell the products to the
consumers directly or they take the help of a broker to sell the products.
AusPaper have been facing tremendous success with their business in the past two decades.
However, they have forecasted that there will be a massive shift in the climate of the business in the
upcoming seven years. The preferences of the consumers are changing each day as with the advancement
of technology, the preference of the readers in reading magazines and newspapers have been shifting
towards reading online magazines, e-readers and social media. This will result in this change in the
business climate in the near future. Thus, the management of AusPaper has now developed a feeling that
their customer base has to be strengthened and a strategic alliance has to be framed with the existing
clients in their industries of newspaper and magazines. They have further planned to predict the future
financial turnover of the company using the historical data with the help of a formal procedure.
⊘ This is a preview!⊘
Do you want full access?
Subscribe today to unlock all pages.
Trusted by 1+ million students worldwide
3MIS771: DESCRIPTIVE ANALYTICS AND VISUALIZATION
Thus, in order to run the analysis required, AusPaper approached a market research company
ANALYTICS7. The company was asked to conduct a survey on a large scale of the existing clients in the
magazine and the newspaper industry so that they can understand the characteristics possessed by their
clients, what perceptions they hold for AusPaper and what is their thought on developing a strategic
alliance for a long term with the company.
2.0 Data Collection Procedure
Thus, keeping in mind the concerns raised by AusPaper, ANALYTICS7 have made
contacts with the purchasing managers of the companies buying products from AusPaper and
encouraged them to share their participation in a survey conducted online by ANALYTICS7.
The data collected from the survey have been compiled with some other historical data obtained
from the data warehouse of AusPaper and that can be accessed through the decision support
system of the company.
3.0 Data Description
The database collected has observations on 200 clients collected over 18 different
aspects. The database consists of two different types of information. The first type of data is
based on the perceptions of the clients on the performance of the company AusPaper on 13
different aspects. The purchasing managers of the companies were asked to rate the 13 different
aspects of the company on a scale of 1 – 10, with 0 being the rating “Poor” and 10 being the
rating “10”. The second part of the dataset contains information on the business relationships of
the company with other companies and the outcomes of their purchases. Another type of
information is also available from the collected dataset which has been collected from the data
warehouse of AusPaper. This includes information on the size of the customer, length of the
Paraphrase This Document
Need a fresh take? Get an instant paraphrase of this document with our AI Paraphraser
4MIS771: DESCRIPTIVE ANALYTICS AND VISUALIZATION
relationship of purchase and also the sales turnover of the operations conducted by the company
over the years collected quarterly.
The main aim of this research as asked by the manager of the analytics company
ANALYTICS7 is to identify the identify the major factors that are useful in predicting the
satisfaction of the customers from the previous purchases they made from AusPaper. The
manager is also interested to predict whether the customers are interested in forming a strategic
alliance with AusPaper. From the past data, the future sales of the financial year 2017 is also an
interest of the manager Mr. Barra, so that depending on the results, AusPaper can develop their
plans and business strategies for the next financial year.
4.0 Data Analysis
4.1 Analysis of the Dependent Variable
Two variables have been asked by AusPaper to summarize in this section. These
variables are “customer satisfaction score” rated on a scale of 1 – 10 and whether a client is
intended to form a strategic alliance with the company AusPaper, where the responses are “Yes”
or “No”.
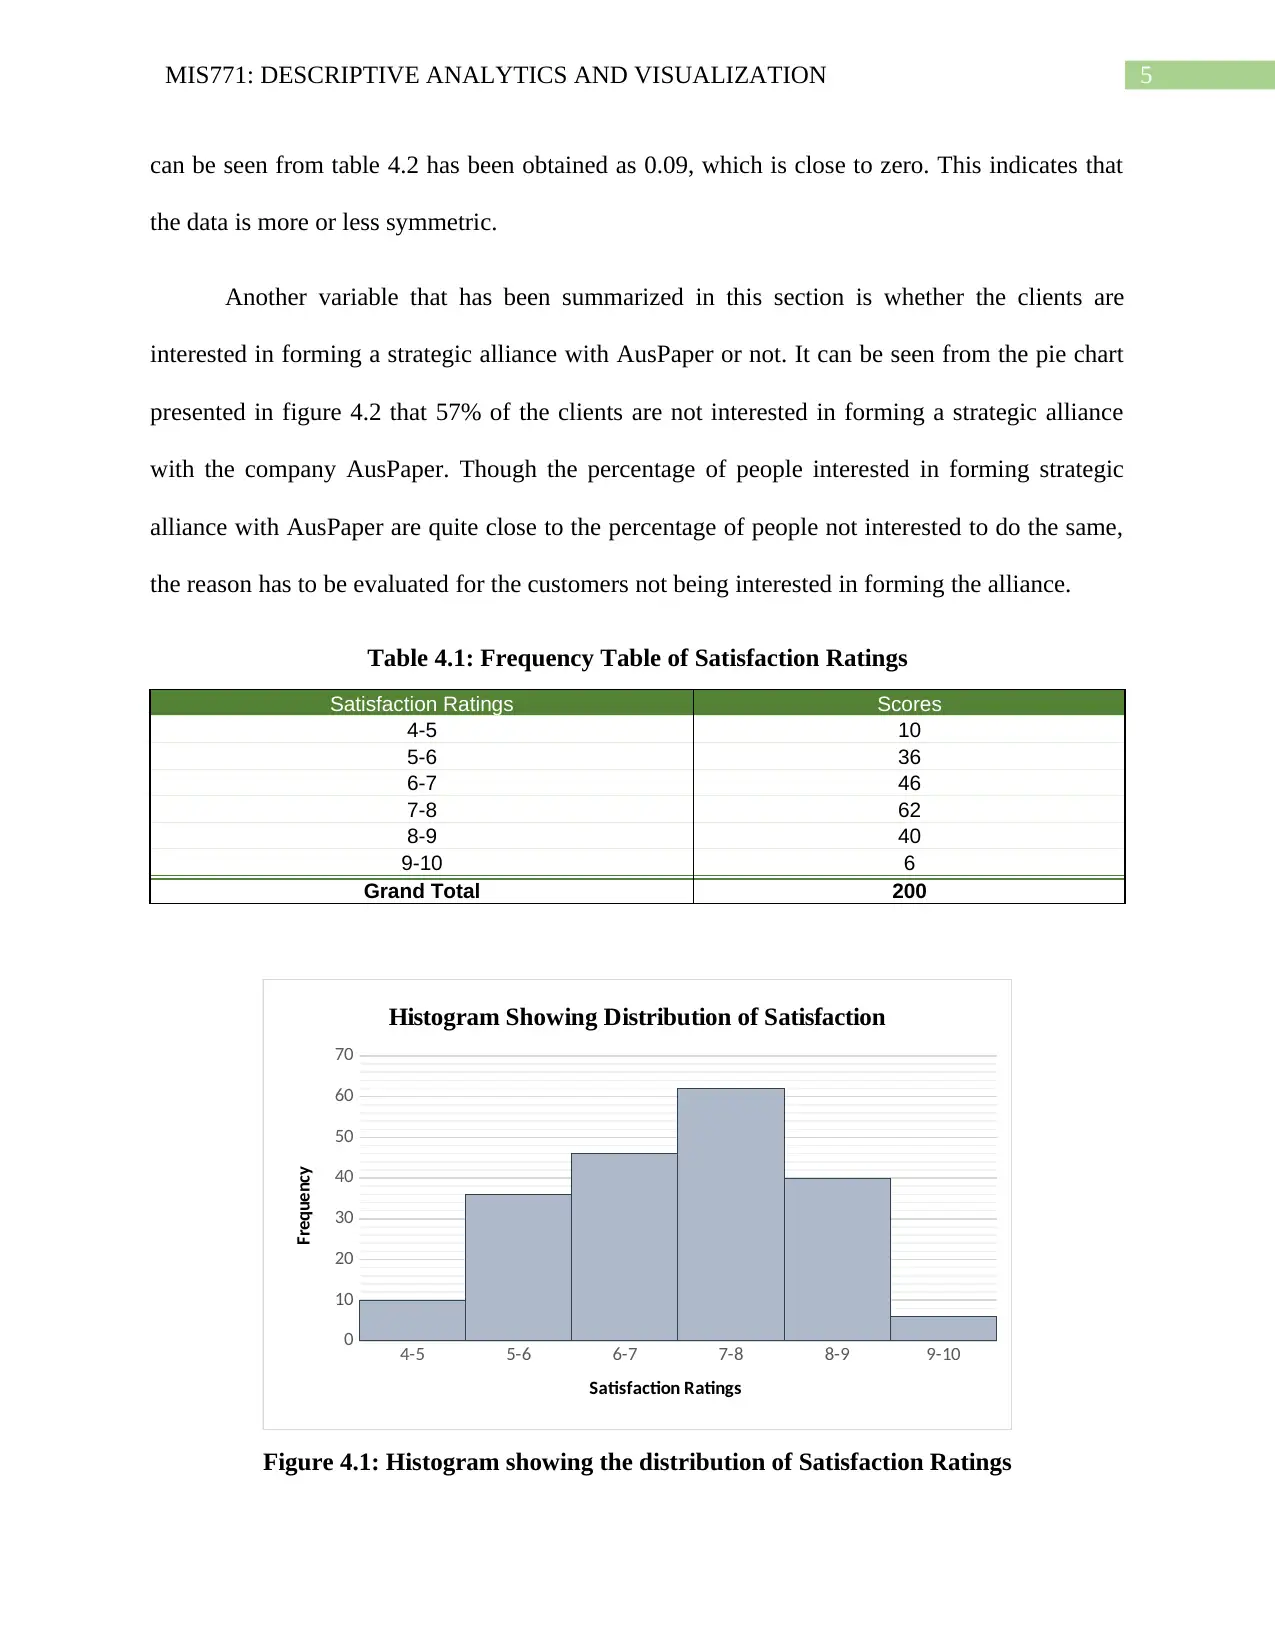
The summaries of the results are given in tables 4.1 and 4.2. It can be seen from table 4.1
that most of the customers have given a satisfaction rating between 7 – 8. This indicates that the
customers of the company are highly satisfied with the products and services of AusPaper and
thus have given a considerable high rating. From table 4.2, it is clear that the average ratings
given by the customers is 6.95, which is not a bad rating. The standard deviation of the rating
scores have been obtained as 1.24, which is considerably less and thus it can be said that most of
the ratings given by the customers are close to the average rating. Further, the skewness value as
relationship of purchase and also the sales turnover of the operations conducted by the company
over the years collected quarterly.
The main aim of this research as asked by the manager of the analytics company
ANALYTICS7 is to identify the identify the major factors that are useful in predicting the
satisfaction of the customers from the previous purchases they made from AusPaper. The
manager is also interested to predict whether the customers are interested in forming a strategic
alliance with AusPaper. From the past data, the future sales of the financial year 2017 is also an
interest of the manager Mr. Barra, so that depending on the results, AusPaper can develop their
plans and business strategies for the next financial year.
4.0 Data Analysis
4.1 Analysis of the Dependent Variable
Two variables have been asked by AusPaper to summarize in this section. These
variables are “customer satisfaction score” rated on a scale of 1 – 10 and whether a client is
intended to form a strategic alliance with the company AusPaper, where the responses are “Yes”
or “No”.
The summaries of the results are given in tables 4.1 and 4.2. It can be seen from table 4.1
that most of the customers have given a satisfaction rating between 7 – 8. This indicates that the
customers of the company are highly satisfied with the products and services of AusPaper and
thus have given a considerable high rating. From table 4.2, it is clear that the average ratings
given by the customers is 6.95, which is not a bad rating. The standard deviation of the rating
scores have been obtained as 1.24, which is considerably less and thus it can be said that most of
the ratings given by the customers are close to the average rating. Further, the skewness value as
5MIS771: DESCRIPTIVE ANALYTICS AND VISUALIZATION
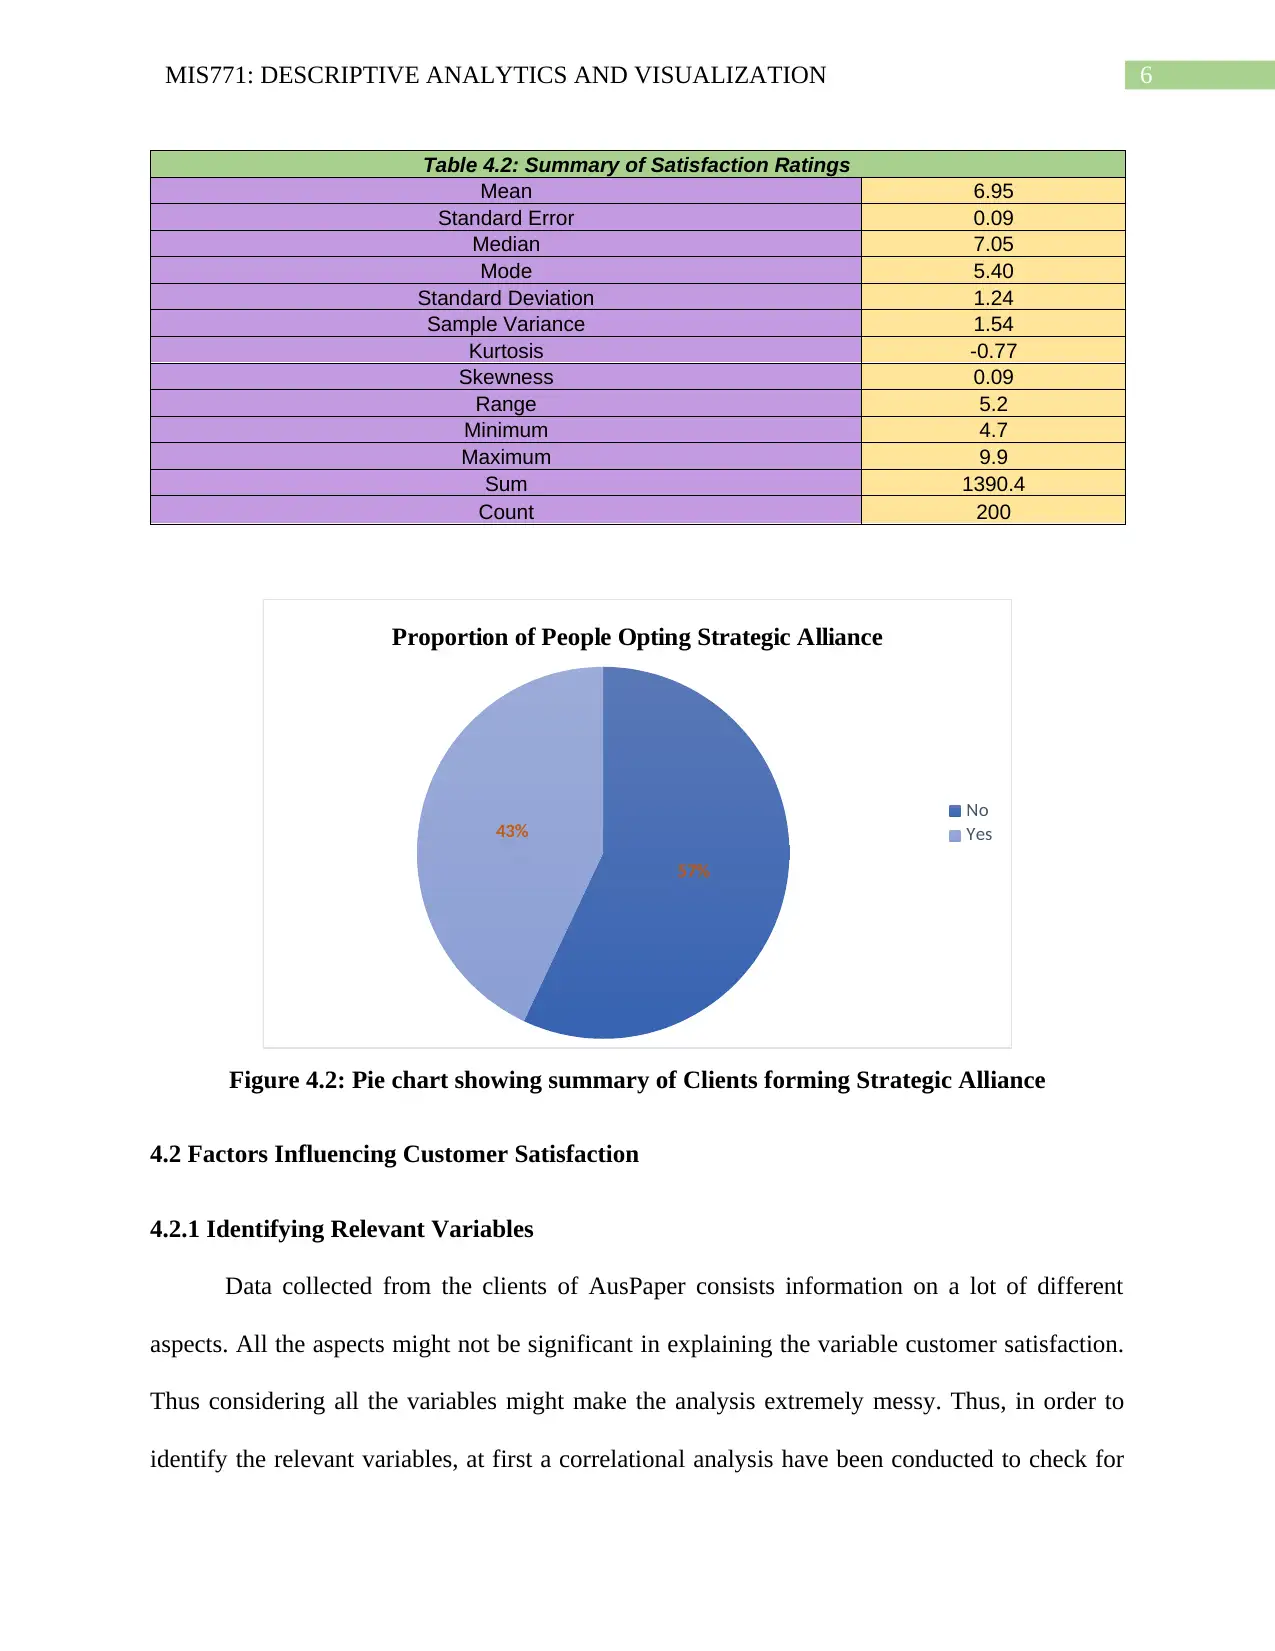
can be seen from table 4.2 has been obtained as 0.09, which is close to zero. This indicates that
the data is more or less symmetric.
Another variable that has been summarized in this section is whether the clients are
interested in forming a strategic alliance with AusPaper or not. It can be seen from the pie chart
presented in figure 4.2 that 57% of the clients are not interested in forming a strategic alliance
with the company AusPaper. Though the percentage of people interested in forming strategic
alliance with AusPaper are quite close to the percentage of people not interested to do the same,
the reason has to be evaluated for the customers not being interested in forming the alliance.
Table 4.1: Frequency Table of Satisfaction Ratings
Satisfaction Ratings Scores
4-5 10
5-6 36
6-7 46
7-8 62
8-9 40
9-10 6
Grand Total 200
4-5 5-6 6-7 7-8 8-9 9-10
0
10
20
30
40
50
60
70
Histogram Showing Distribution of Satisfaction
Satisfaction Ratings
Frequency
Figure 4.1: Histogram showing the distribution of Satisfaction Ratings
⊘ This is a preview!⊘
Do you want full access?
Subscribe today to unlock all pages.
Trusted by 1+ million students worldwide
6MIS771: DESCRIPTIVE ANALYTICS AND VISUALIZATION
Table 4.2: Summary of Satisfaction Ratings
Mean 6.95
Standard Error 0.09
Median 7.05
Mode 5.40
Standard Deviation 1.24
Sample Variance 1.54
Kurtosis -0.77
Skewness 0.09
Range 5.2
Minimum 4.7
Maximum 9.9
Sum 1390.4
Count 200
57%
43%
Proportion of People Opting Strategic Alliance
No
Yes
Figure 4.2: Pie chart showing summary of Clients forming Strategic Alliance
4.2 Factors Influencing Customer Satisfaction
4.2.1 Identifying Relevant Variables
Data collected from the clients of AusPaper consists information on a lot of different
aspects. All the aspects might not be significant in explaining the variable customer satisfaction.
Thus considering all the variables might make the analysis extremely messy. Thus, in order to
identify the relevant variables, at first a correlational analysis have been conducted to check for
Paraphrase This Document
Need a fresh take? Get an instant paraphrase of this document with our AI Paraphraser
7MIS771: DESCRIPTIVE ANALYTICS AND VISUALIZATION
the variables that are not required for the development of the model to explain customer
satisfaction. It can be seen from the correlation table that the variables product quality, complaint
resolution, product line, billing and delivery speed and product image have shown very high
correlation with the predicted variable customer satisfaction. Thus, these variables will be
relevant for developing the model for the explanation of customer satisfaction (Cameron and
Trivedi 2013). The correlation table in given in table 1, in the appendix section. The coefficients
of the correlation observed for each of these variables is higher than 0.40 and thus have been
considered significant for the prediction model. The model that has been developed considering
these selected variables is discussed in the next section.
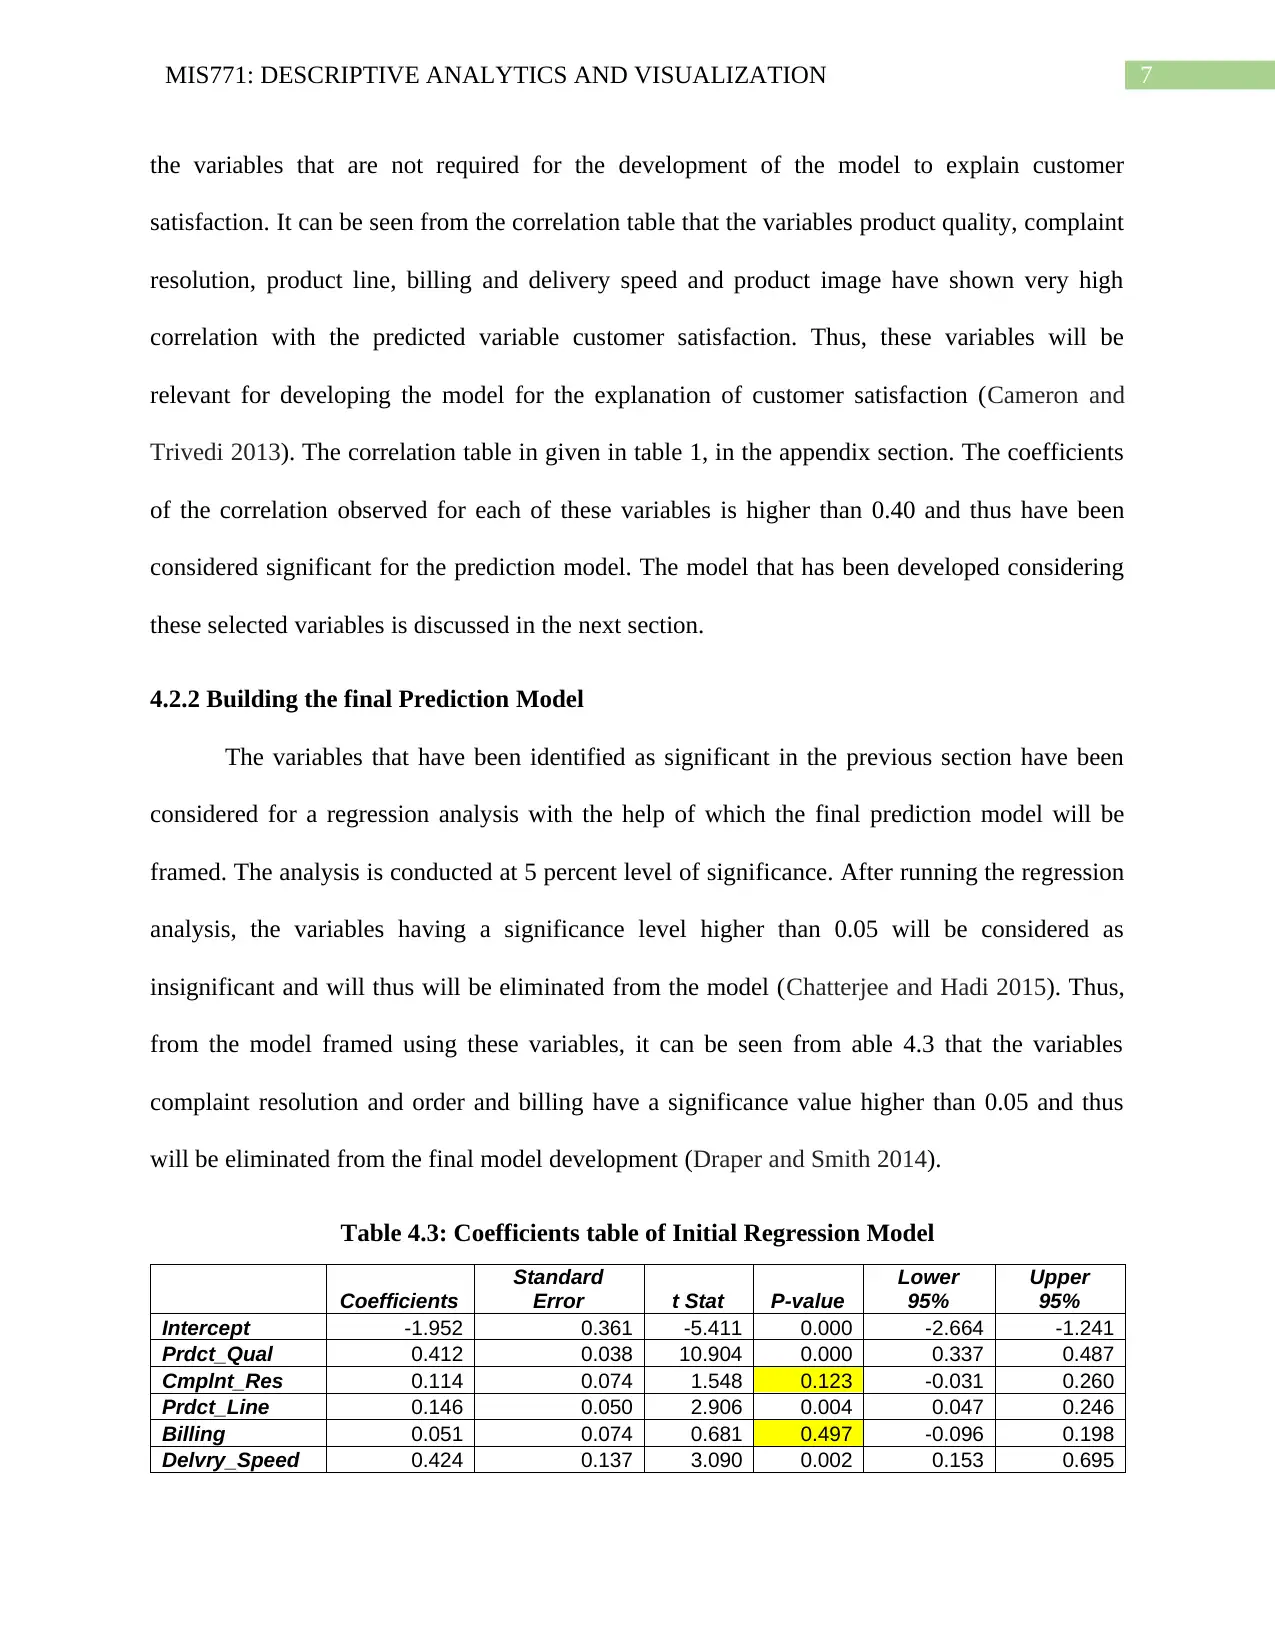
4.2.2 Building the final Prediction Model
The variables that have been identified as significant in the previous section have been
considered for a regression analysis with the help of which the final prediction model will be
framed. The analysis is conducted at 5 percent level of significance. After running the regression
analysis, the variables having a significance level higher than 0.05 will be considered as
insignificant and will thus will be eliminated from the model (Chatterjee and Hadi 2015). Thus,
from the model framed using these variables, it can be seen from able 4.3 that the variables
complaint resolution and order and billing have a significance value higher than 0.05 and thus
will be eliminated from the final model development (Draper and Smith 2014).
Table 4.3: Coefficients table of Initial Regression Model
Coefficients
Standard
Error t Stat P-value
Lower
95%
Upper
95%
Intercept -1.952 0.361 -5.411 0.000 -2.664 -1.241
Prdct_Qual 0.412 0.038 10.904 0.000 0.337 0.487
Cmplnt_Res 0.114 0.074 1.548 0.123 -0.031 0.260
Prdct_Line 0.146 0.050 2.906 0.004 0.047 0.246
Billing 0.051 0.074 0.681 0.497 -0.096 0.198
Delvry_Speed 0.424 0.137 3.090 0.002 0.153 0.695
the variables that are not required for the development of the model to explain customer
satisfaction. It can be seen from the correlation table that the variables product quality, complaint
resolution, product line, billing and delivery speed and product image have shown very high
correlation with the predicted variable customer satisfaction. Thus, these variables will be
relevant for developing the model for the explanation of customer satisfaction (Cameron and
Trivedi 2013). The correlation table in given in table 1, in the appendix section. The coefficients
of the correlation observed for each of these variables is higher than 0.40 and thus have been
considered significant for the prediction model. The model that has been developed considering
these selected variables is discussed in the next section.
4.2.2 Building the final Prediction Model
The variables that have been identified as significant in the previous section have been
considered for a regression analysis with the help of which the final prediction model will be
framed. The analysis is conducted at 5 percent level of significance. After running the regression
analysis, the variables having a significance level higher than 0.05 will be considered as
insignificant and will thus will be eliminated from the model (Chatterjee and Hadi 2015). Thus,
from the model framed using these variables, it can be seen from able 4.3 that the variables
complaint resolution and order and billing have a significance value higher than 0.05 and thus
will be eliminated from the final model development (Draper and Smith 2014).
Table 4.3: Coefficients table of Initial Regression Model
Coefficients
Standard
Error t Stat P-value
Lower
95%
Upper
95%
Intercept -1.952 0.361 -5.411 0.000 -2.664 -1.241
Prdct_Qual 0.412 0.038 10.904 0.000 0.337 0.487
Cmplnt_Res 0.114 0.074 1.548 0.123 -0.031 0.260
Prdct_Line 0.146 0.050 2.906 0.004 0.047 0.246
Billing 0.051 0.074 0.681 0.497 -0.096 0.198
Delvry_Speed 0.424 0.137 3.090 0.002 0.153 0.695
8MIS771: DESCRIPTIVE ANALYTICS AND VISUALIZATION
Image 0.448 0.039 11.362 0.000 0.371 0.526
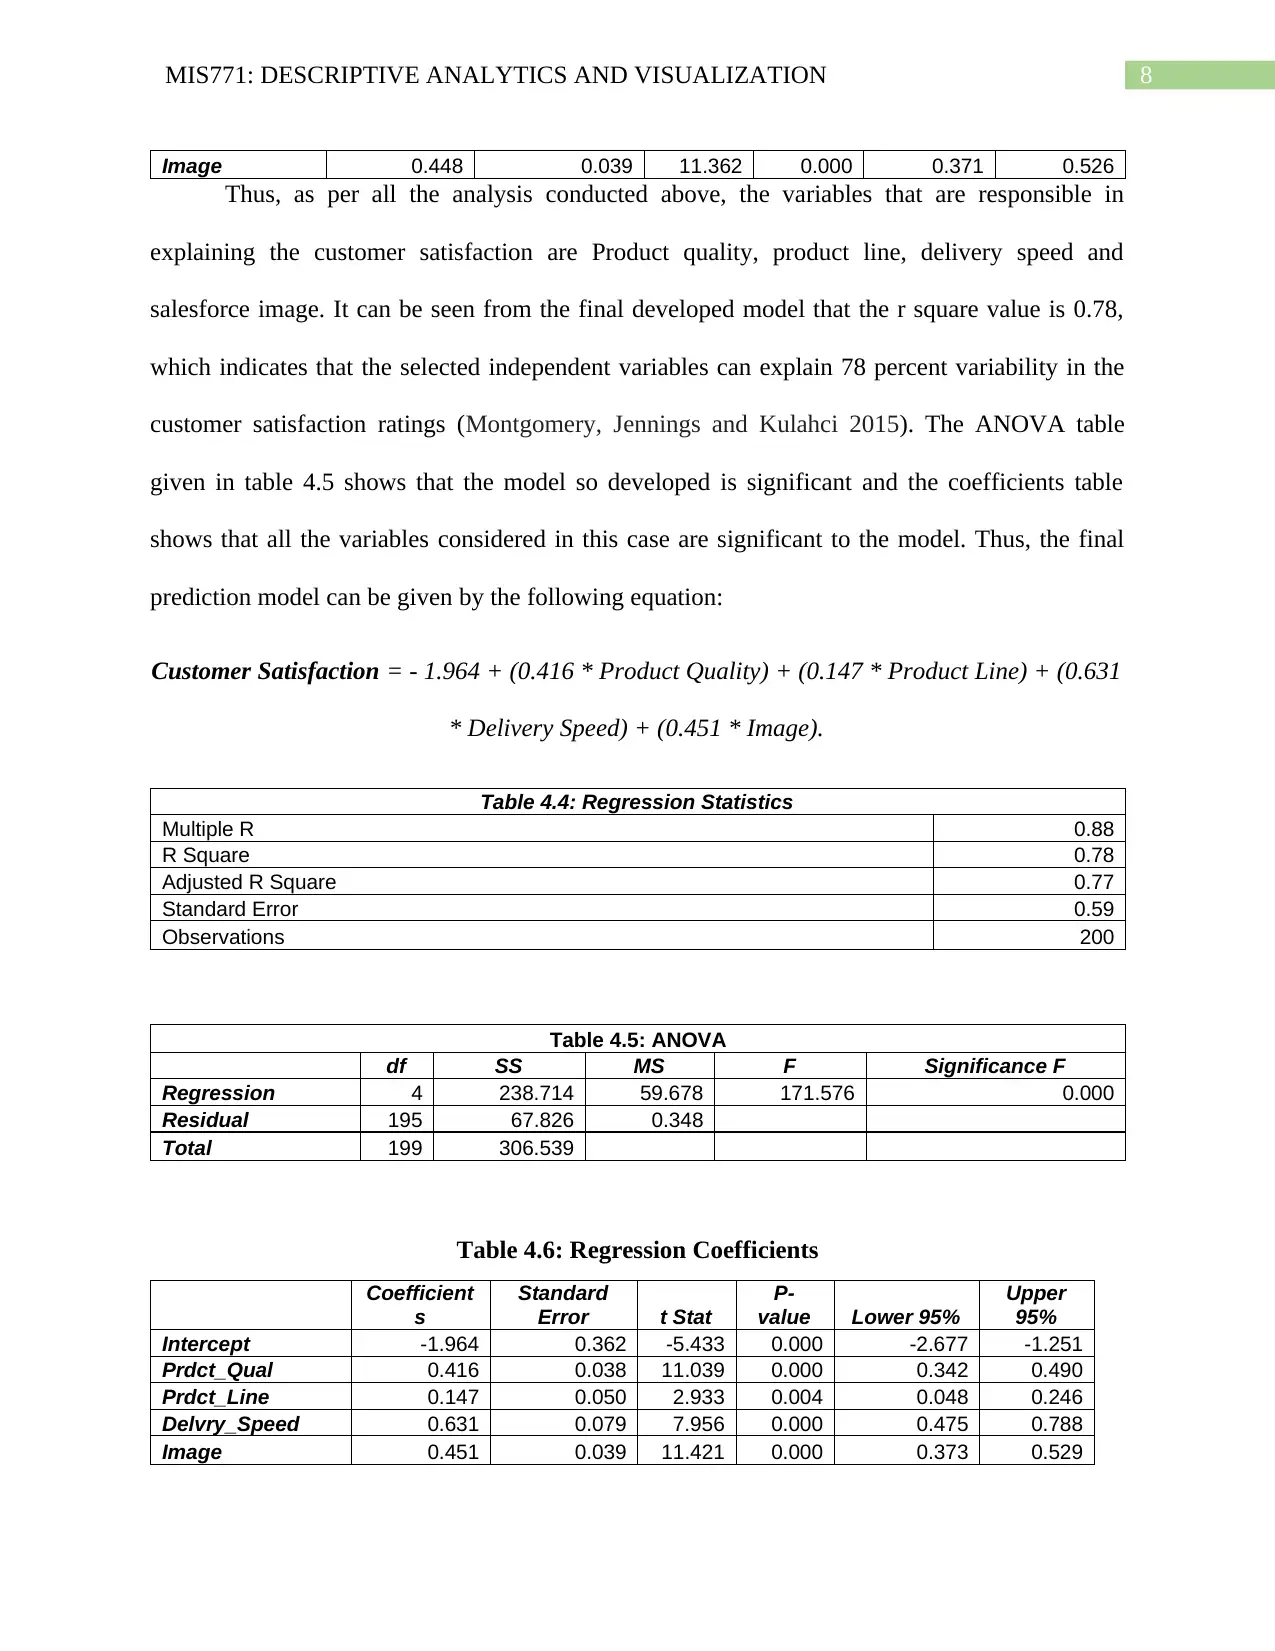
Thus, as per all the analysis conducted above, the variables that are responsible in
explaining the customer satisfaction are Product quality, product line, delivery speed and
salesforce image. It can be seen from the final developed model that the r square value is 0.78,
which indicates that the selected independent variables can explain 78 percent variability in the
customer satisfaction ratings (Montgomery, Jennings and Kulahci 2015). The ANOVA table
given in table 4.5 shows that the model so developed is significant and the coefficients table
shows that all the variables considered in this case are significant to the model. Thus, the final
prediction model can be given by the following equation:
Customer Satisfaction = - 1.964 + (0.416 * Product Quality) + (0.147 * Product Line) + (0.631
* Delivery Speed) + (0.451 * Image).
Table 4.4: Regression Statistics
Multiple R 0.88
R Square 0.78
Adjusted R Square 0.77
Standard Error 0.59
Observations 200
Table 4.5: ANOVA
df SS MS F Significance F
Regression 4 238.714 59.678 171.576 0.000
Residual 195 67.826 0.348
Total 199 306.539
Table 4.6: Regression Coefficients
Coefficient
s
Standard
Error t Stat
P-
value Lower 95%
Upper
95%
Intercept -1.964 0.362 -5.433 0.000 -2.677 -1.251
Prdct_Qual 0.416 0.038 11.039 0.000 0.342 0.490
Prdct_Line 0.147 0.050 2.933 0.004 0.048 0.246
Delvry_Speed 0.631 0.079 7.956 0.000 0.475 0.788
Image 0.451 0.039 11.421 0.000 0.373 0.529
Image 0.448 0.039 11.362 0.000 0.371 0.526
Thus, as per all the analysis conducted above, the variables that are responsible in
explaining the customer satisfaction are Product quality, product line, delivery speed and
salesforce image. It can be seen from the final developed model that the r square value is 0.78,
which indicates that the selected independent variables can explain 78 percent variability in the
customer satisfaction ratings (Montgomery, Jennings and Kulahci 2015). The ANOVA table
given in table 4.5 shows that the model so developed is significant and the coefficients table
shows that all the variables considered in this case are significant to the model. Thus, the final
prediction model can be given by the following equation:
Customer Satisfaction = - 1.964 + (0.416 * Product Quality) + (0.147 * Product Line) + (0.631
* Delivery Speed) + (0.451 * Image).
Table 4.4: Regression Statistics
Multiple R 0.88
R Square 0.78
Adjusted R Square 0.77
Standard Error 0.59
Observations 200
Table 4.5: ANOVA
df SS MS F Significance F
Regression 4 238.714 59.678 171.576 0.000
Residual 195 67.826 0.348
Total 199 306.539
Table 4.6: Regression Coefficients
Coefficient
s
Standard
Error t Stat
P-
value Lower 95%
Upper
95%
Intercept -1.964 0.362 -5.433 0.000 -2.677 -1.251
Prdct_Qual 0.416 0.038 11.039 0.000 0.342 0.490
Prdct_Line 0.147 0.050 2.933 0.004 0.048 0.246
Delvry_Speed 0.631 0.079 7.956 0.000 0.475 0.788
Image 0.451 0.039 11.421 0.000 0.373 0.529
⊘ This is a preview!⊘
Do you want full access?
Subscribe today to unlock all pages.
Trusted by 1+ million students worldwide
9MIS771: DESCRIPTIVE ANALYTICS AND VISUALIZATION
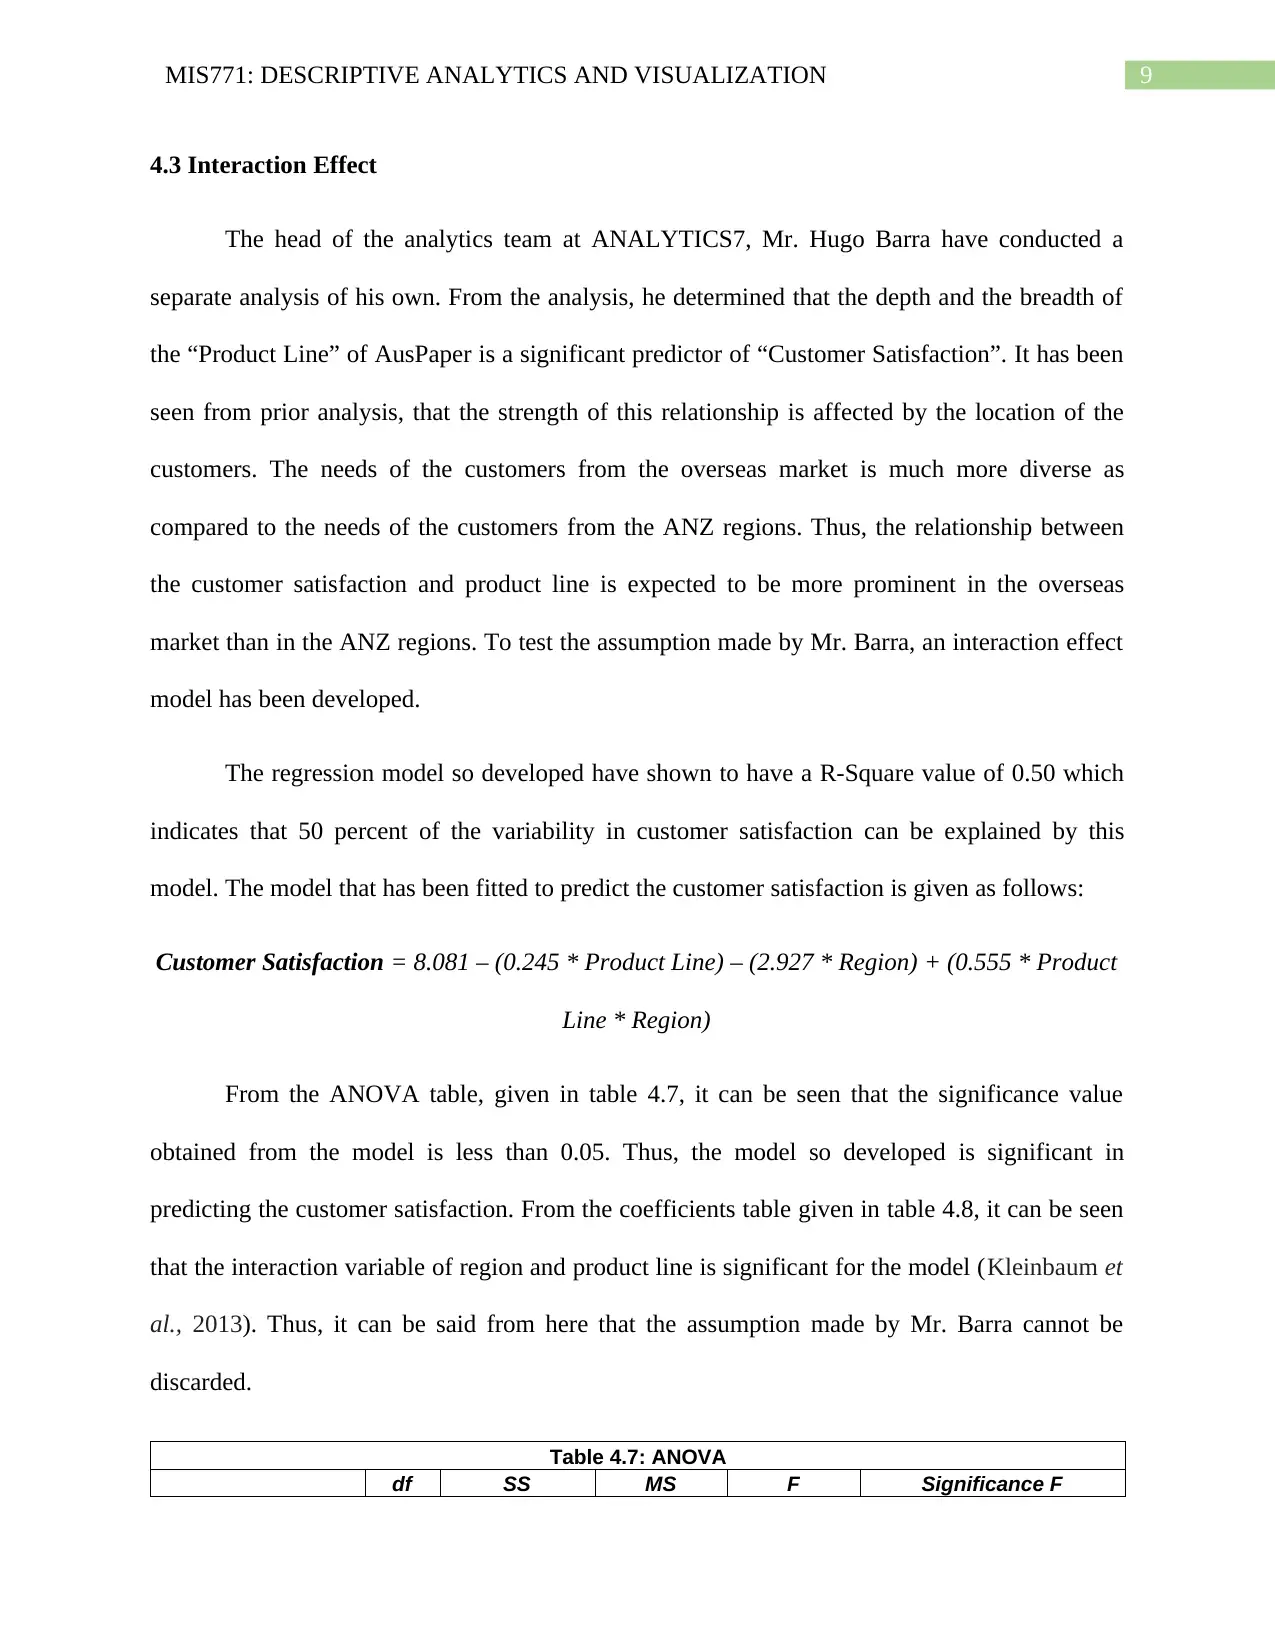
4.3 Interaction Effect
The head of the analytics team at ANALYTICS7, Mr. Hugo Barra have conducted a
separate analysis of his own. From the analysis, he determined that the depth and the breadth of
the “Product Line” of AusPaper is a significant predictor of “Customer Satisfaction”. It has been
seen from prior analysis, that the strength of this relationship is affected by the location of the
customers. The needs of the customers from the overseas market is much more diverse as
compared to the needs of the customers from the ANZ regions. Thus, the relationship between
the customer satisfaction and product line is expected to be more prominent in the overseas
market than in the ANZ regions. To test the assumption made by Mr. Barra, an interaction effect
model has been developed.
The regression model so developed have shown to have a R-Square value of 0.50 which
indicates that 50 percent of the variability in customer satisfaction can be explained by this
model. The model that has been fitted to predict the customer satisfaction is given as follows:
Customer Satisfaction = 8.081 – (0.245 * Product Line) – (2.927 * Region) + (0.555 * Product
Line * Region)
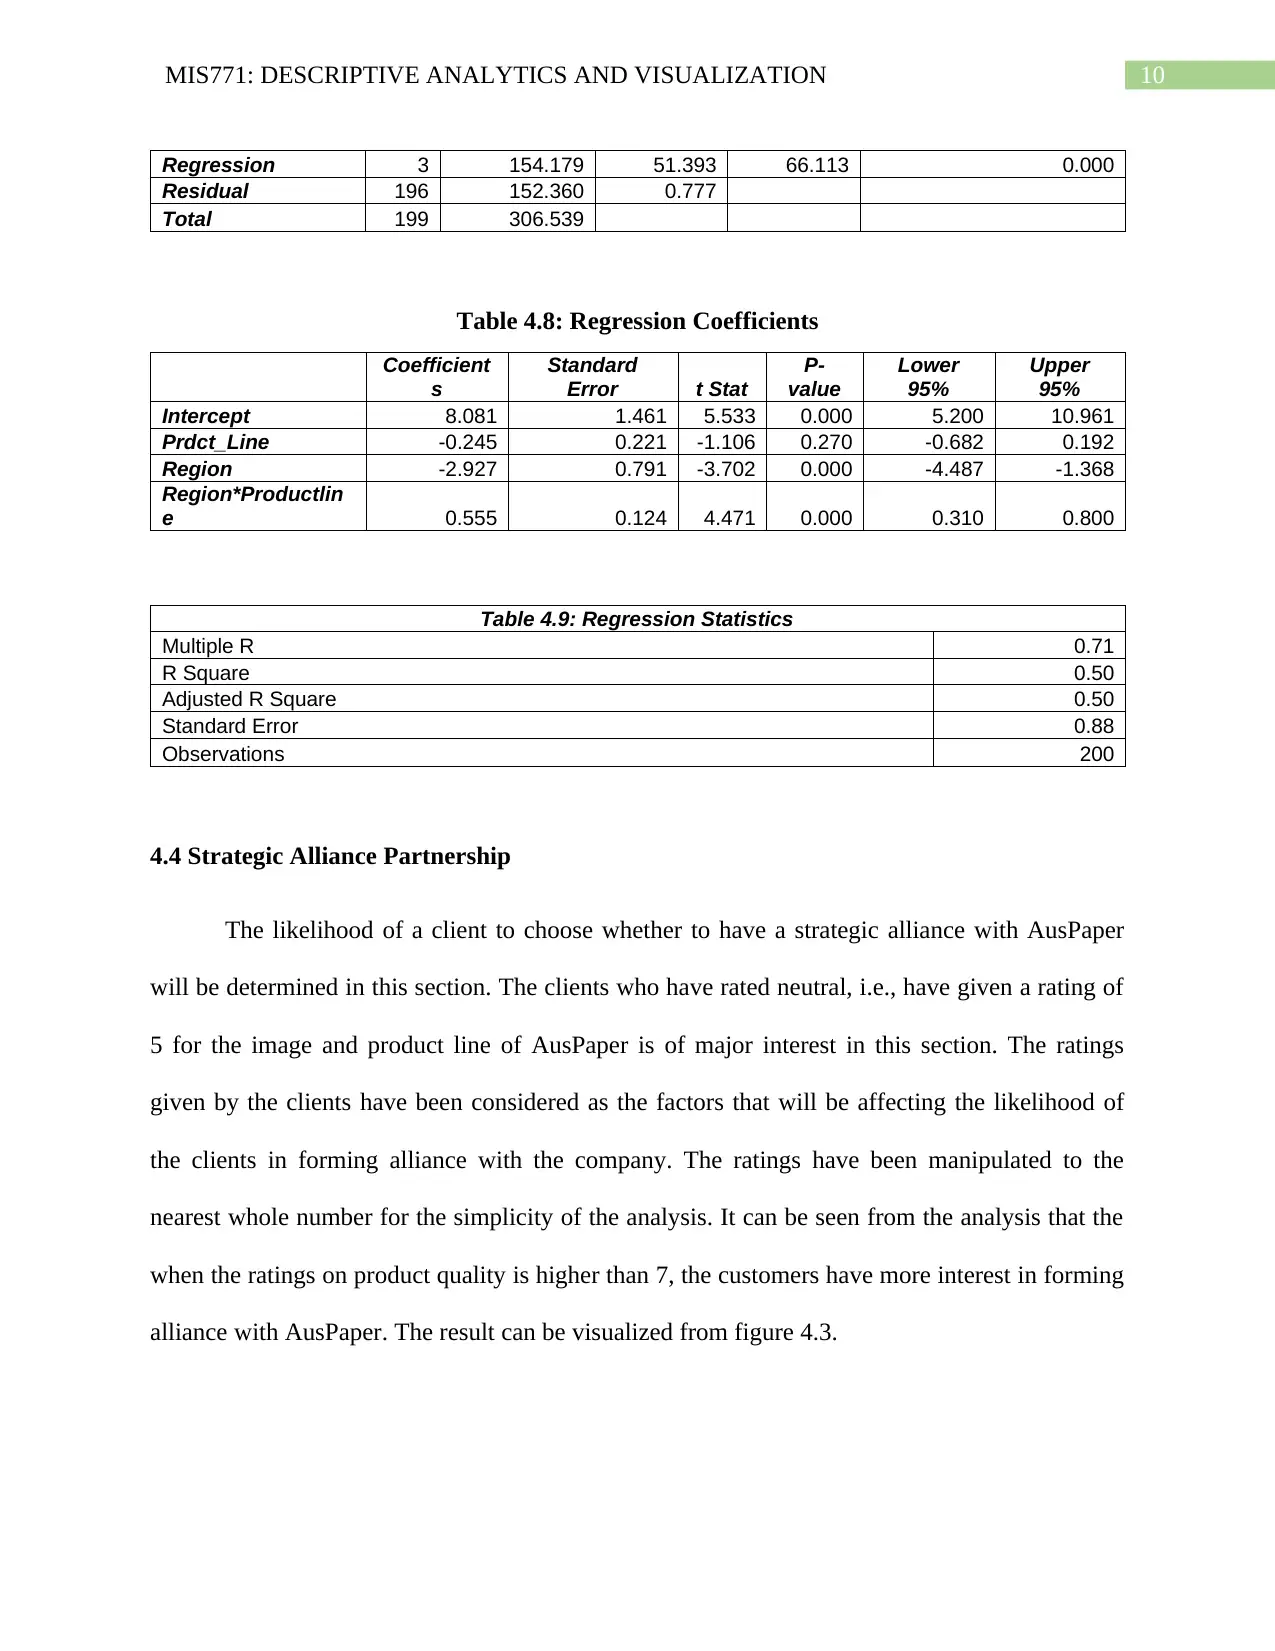
From the ANOVA table, given in table 4.7, it can be seen that the significance value
obtained from the model is less than 0.05. Thus, the model so developed is significant in
predicting the customer satisfaction. From the coefficients table given in table 4.8, it can be seen
that the interaction variable of region and product line is significant for the model (Kleinbaum et
al., 2013). Thus, it can be said from here that the assumption made by Mr. Barra cannot be
discarded.
Table 4.7: ANOVA
df SS MS F Significance F
4.3 Interaction Effect
The head of the analytics team at ANALYTICS7, Mr. Hugo Barra have conducted a
separate analysis of his own. From the analysis, he determined that the depth and the breadth of
the “Product Line” of AusPaper is a significant predictor of “Customer Satisfaction”. It has been
seen from prior analysis, that the strength of this relationship is affected by the location of the
customers. The needs of the customers from the overseas market is much more diverse as
compared to the needs of the customers from the ANZ regions. Thus, the relationship between
the customer satisfaction and product line is expected to be more prominent in the overseas
market than in the ANZ regions. To test the assumption made by Mr. Barra, an interaction effect
model has been developed.
The regression model so developed have shown to have a R-Square value of 0.50 which
indicates that 50 percent of the variability in customer satisfaction can be explained by this
model. The model that has been fitted to predict the customer satisfaction is given as follows:
Customer Satisfaction = 8.081 – (0.245 * Product Line) – (2.927 * Region) + (0.555 * Product
Line * Region)
From the ANOVA table, given in table 4.7, it can be seen that the significance value
obtained from the model is less than 0.05. Thus, the model so developed is significant in
predicting the customer satisfaction. From the coefficients table given in table 4.8, it can be seen
that the interaction variable of region and product line is significant for the model (Kleinbaum et
al., 2013). Thus, it can be said from here that the assumption made by Mr. Barra cannot be
discarded.
Table 4.7: ANOVA
df SS MS F Significance F
Paraphrase This Document
Need a fresh take? Get an instant paraphrase of this document with our AI Paraphraser
10MIS771: DESCRIPTIVE ANALYTICS AND VISUALIZATION
Regression 3 154.179 51.393 66.113 0.000
Residual 196 152.360 0.777
Total 199 306.539
Table 4.8: Regression Coefficients
Coefficient
s
Standard
Error t Stat
P-
value
Lower
95%
Upper
95%
Intercept 8.081 1.461 5.533 0.000 5.200 10.961
Prdct_Line -0.245 0.221 -1.106 0.270 -0.682 0.192
Region -2.927 0.791 -3.702 0.000 -4.487 -1.368
Region*Productlin
e 0.555 0.124 4.471 0.000 0.310 0.800
Table 4.9: Regression Statistics
Multiple R 0.71
R Square 0.50
Adjusted R Square 0.50
Standard Error 0.88
Observations 200
4.4 Strategic Alliance Partnership
The likelihood of a client to choose whether to have a strategic alliance with AusPaper
will be determined in this section. The clients who have rated neutral, i.e., have given a rating of
5 for the image and product line of AusPaper is of major interest in this section. The ratings
given by the clients have been considered as the factors that will be affecting the likelihood of
the clients in forming alliance with the company. The ratings have been manipulated to the
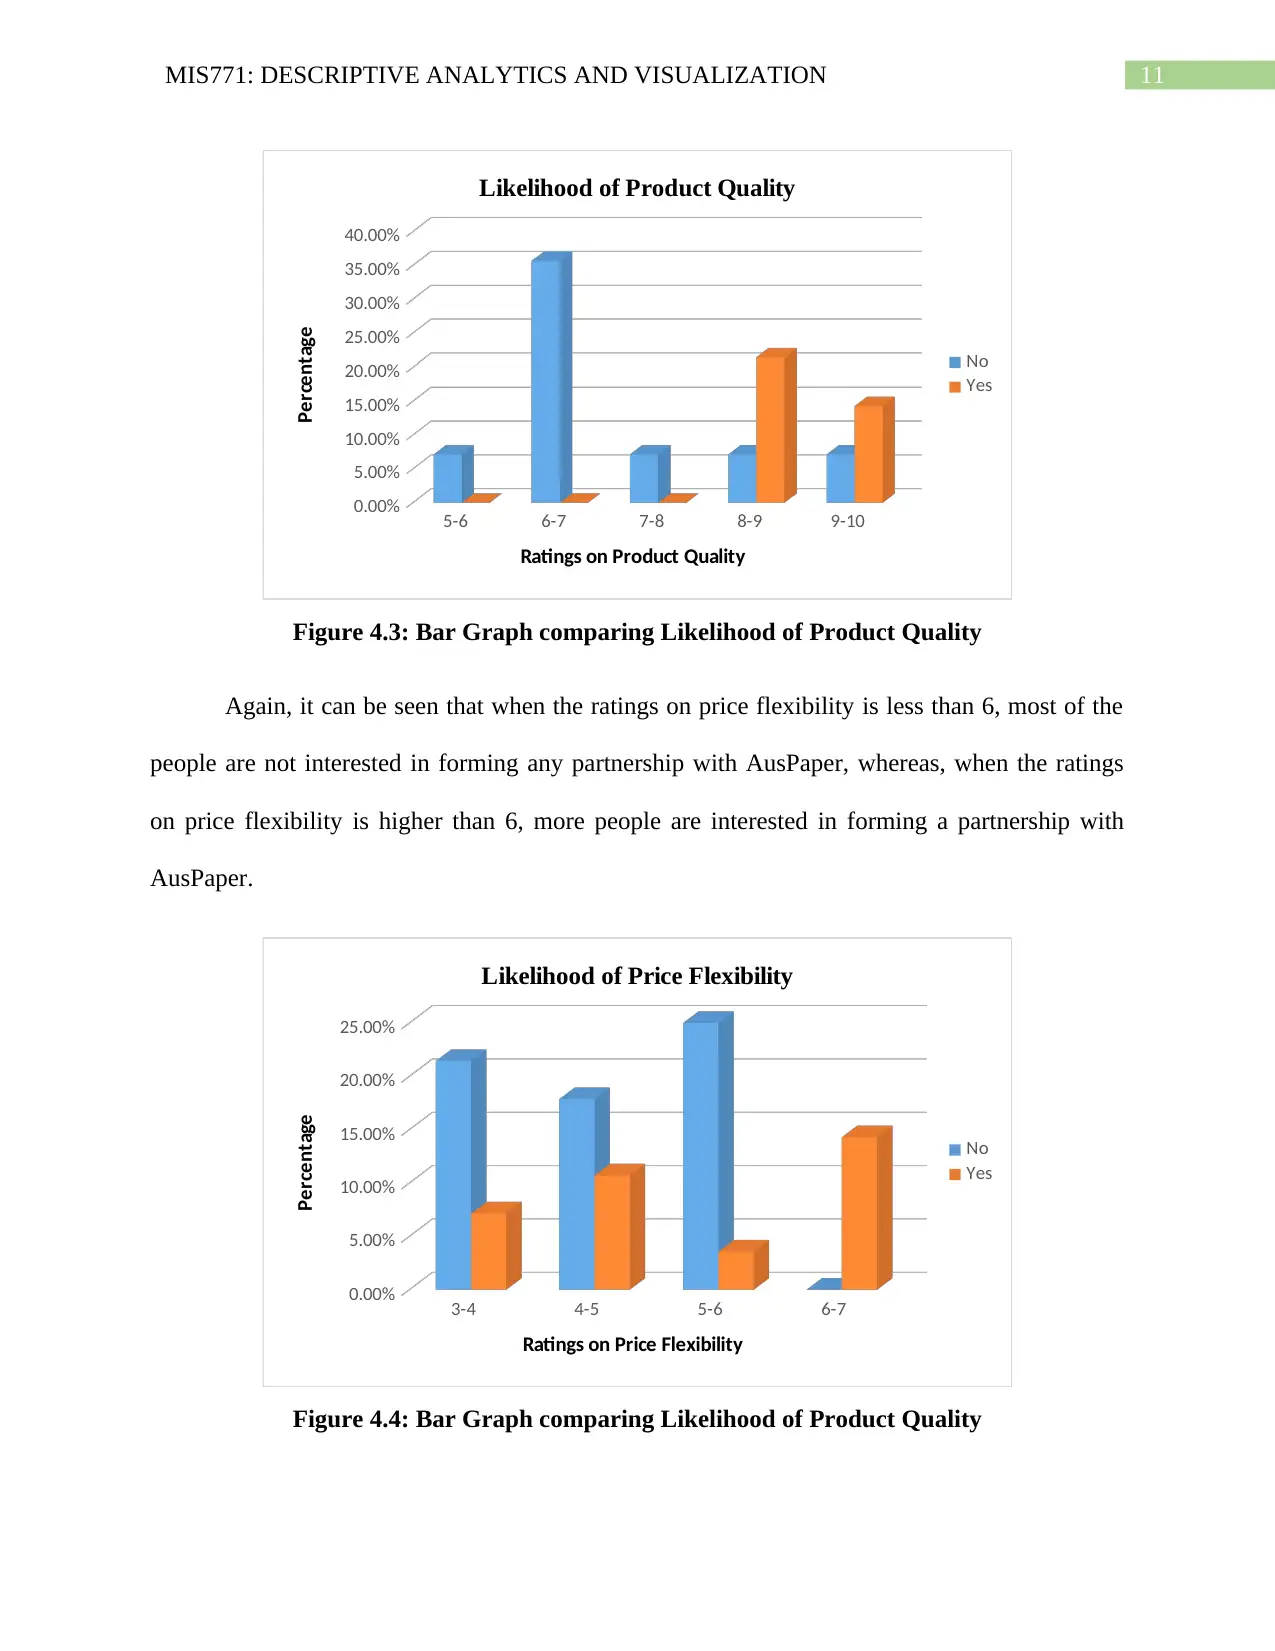
nearest whole number for the simplicity of the analysis. It can be seen from the analysis that the
when the ratings on product quality is higher than 7, the customers have more interest in forming
alliance with AusPaper. The result can be visualized from figure 4.3.
Regression 3 154.179 51.393 66.113 0.000
Residual 196 152.360 0.777
Total 199 306.539
Table 4.8: Regression Coefficients
Coefficient
s
Standard
Error t Stat
P-
value
Lower
95%
Upper
95%
Intercept 8.081 1.461 5.533 0.000 5.200 10.961
Prdct_Line -0.245 0.221 -1.106 0.270 -0.682 0.192
Region -2.927 0.791 -3.702 0.000 -4.487 -1.368
Region*Productlin
e 0.555 0.124 4.471 0.000 0.310 0.800
Table 4.9: Regression Statistics
Multiple R 0.71
R Square 0.50
Adjusted R Square 0.50
Standard Error 0.88
Observations 200
4.4 Strategic Alliance Partnership
The likelihood of a client to choose whether to have a strategic alliance with AusPaper
will be determined in this section. The clients who have rated neutral, i.e., have given a rating of
5 for the image and product line of AusPaper is of major interest in this section. The ratings
given by the clients have been considered as the factors that will be affecting the likelihood of
the clients in forming alliance with the company. The ratings have been manipulated to the
nearest whole number for the simplicity of the analysis. It can be seen from the analysis that the
when the ratings on product quality is higher than 7, the customers have more interest in forming
alliance with AusPaper. The result can be visualized from figure 4.3.
11MIS771: DESCRIPTIVE ANALYTICS AND VISUALIZATION
5-6 6-7 7-8 8-9 9-10
0.00%
5.00%
10.00%
15.00%
20.00%
25.00%
30.00%
35.00%
40.00%
Likelihood of Product Quality
No
Yes
Ratings on Product Quality
Percentage
Figure 4.3: Bar Graph comparing Likelihood of Product Quality
Again, it can be seen that when the ratings on price flexibility is less than 6, most of the
people are not interested in forming any partnership with AusPaper, whereas, when the ratings
on price flexibility is higher than 6, more people are interested in forming a partnership with
AusPaper.
3-4 4-5 5-6 6-7
0.00%
5.00%
10.00%
15.00%
20.00%
25.00%
Likelihood of Price Flexibility
No
Yes
Ratings on Price Flexibility
Percentage
Figure 4.4: Bar Graph comparing Likelihood of Product Quality
⊘ This is a preview!⊘
Do you want full access?
Subscribe today to unlock all pages.
Trusted by 1+ million students worldwide
1 out of 16
Related Documents


Your All-in-One AI-Powered Toolkit for Academic Success.
+13062052269
info@desklib.com
Available 24*7 on WhatsApp / Email
![[object Object]](/_next/static/media/star-bottom.7253800d.svg)
Unlock your academic potential
Copyright © 2020–2026 A2Z Services. All Rights Reserved. Developed and managed by ZUCOL.