Financial Data Analysis for Strategic Business Management
VerifiedAdded on 2023/06/15
|15
|1124
|238
Report
AI Summary
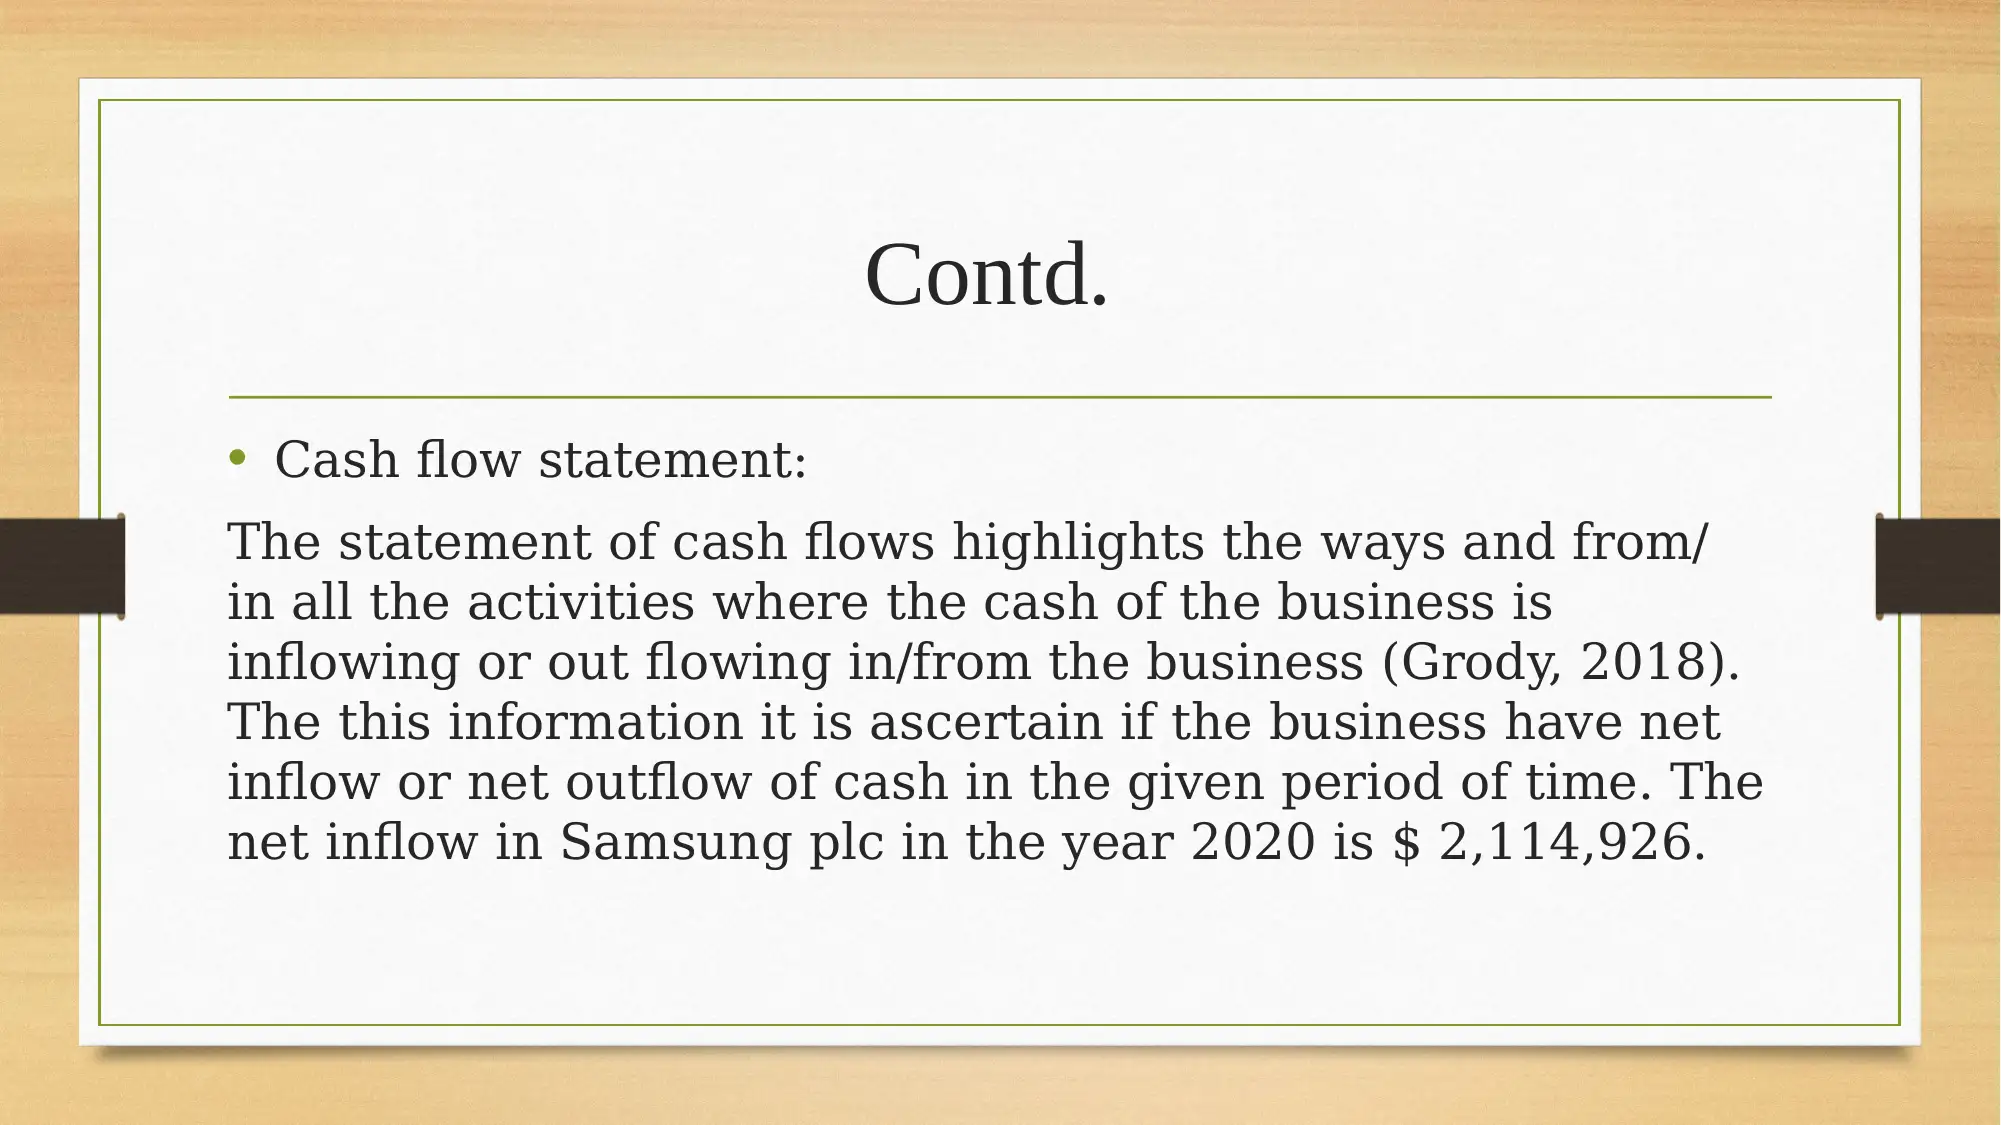
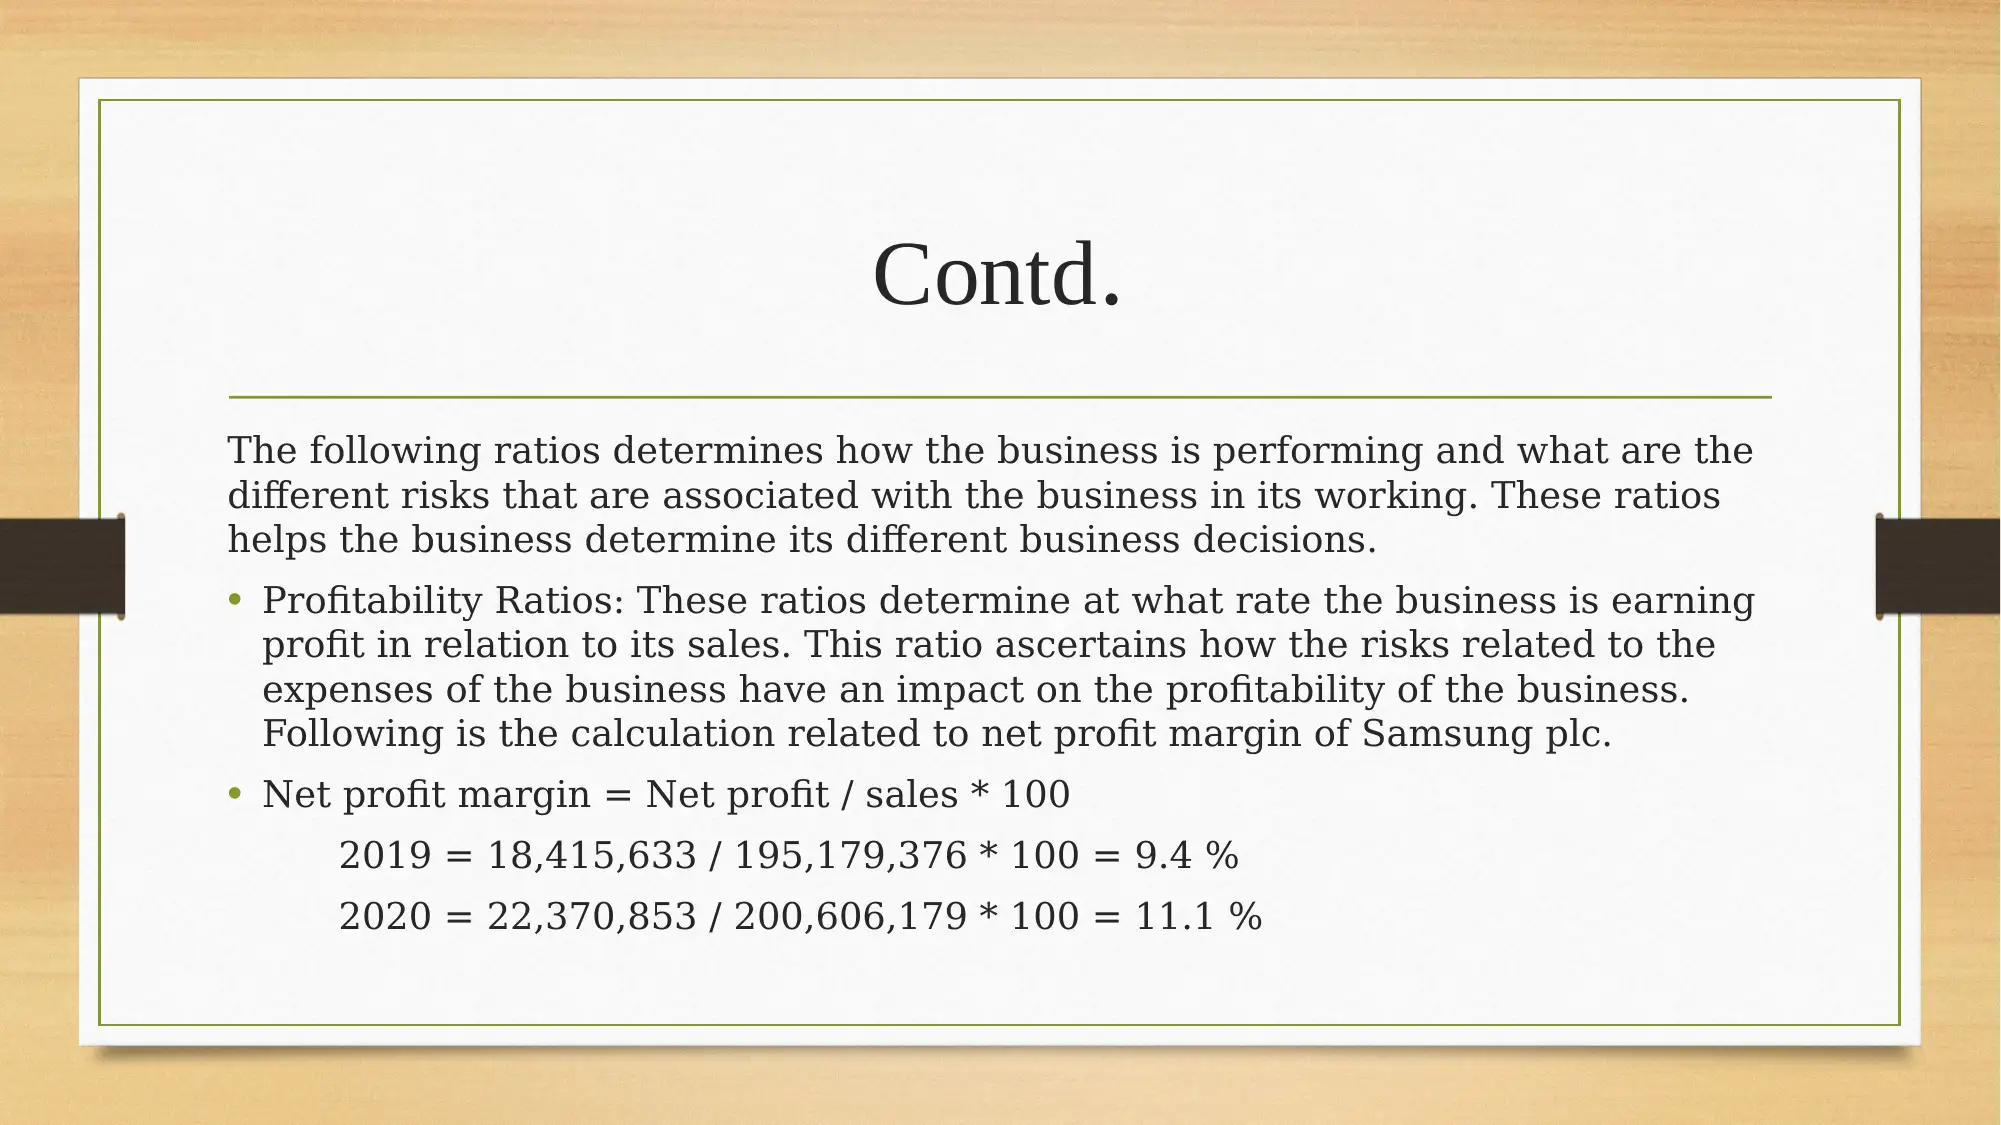
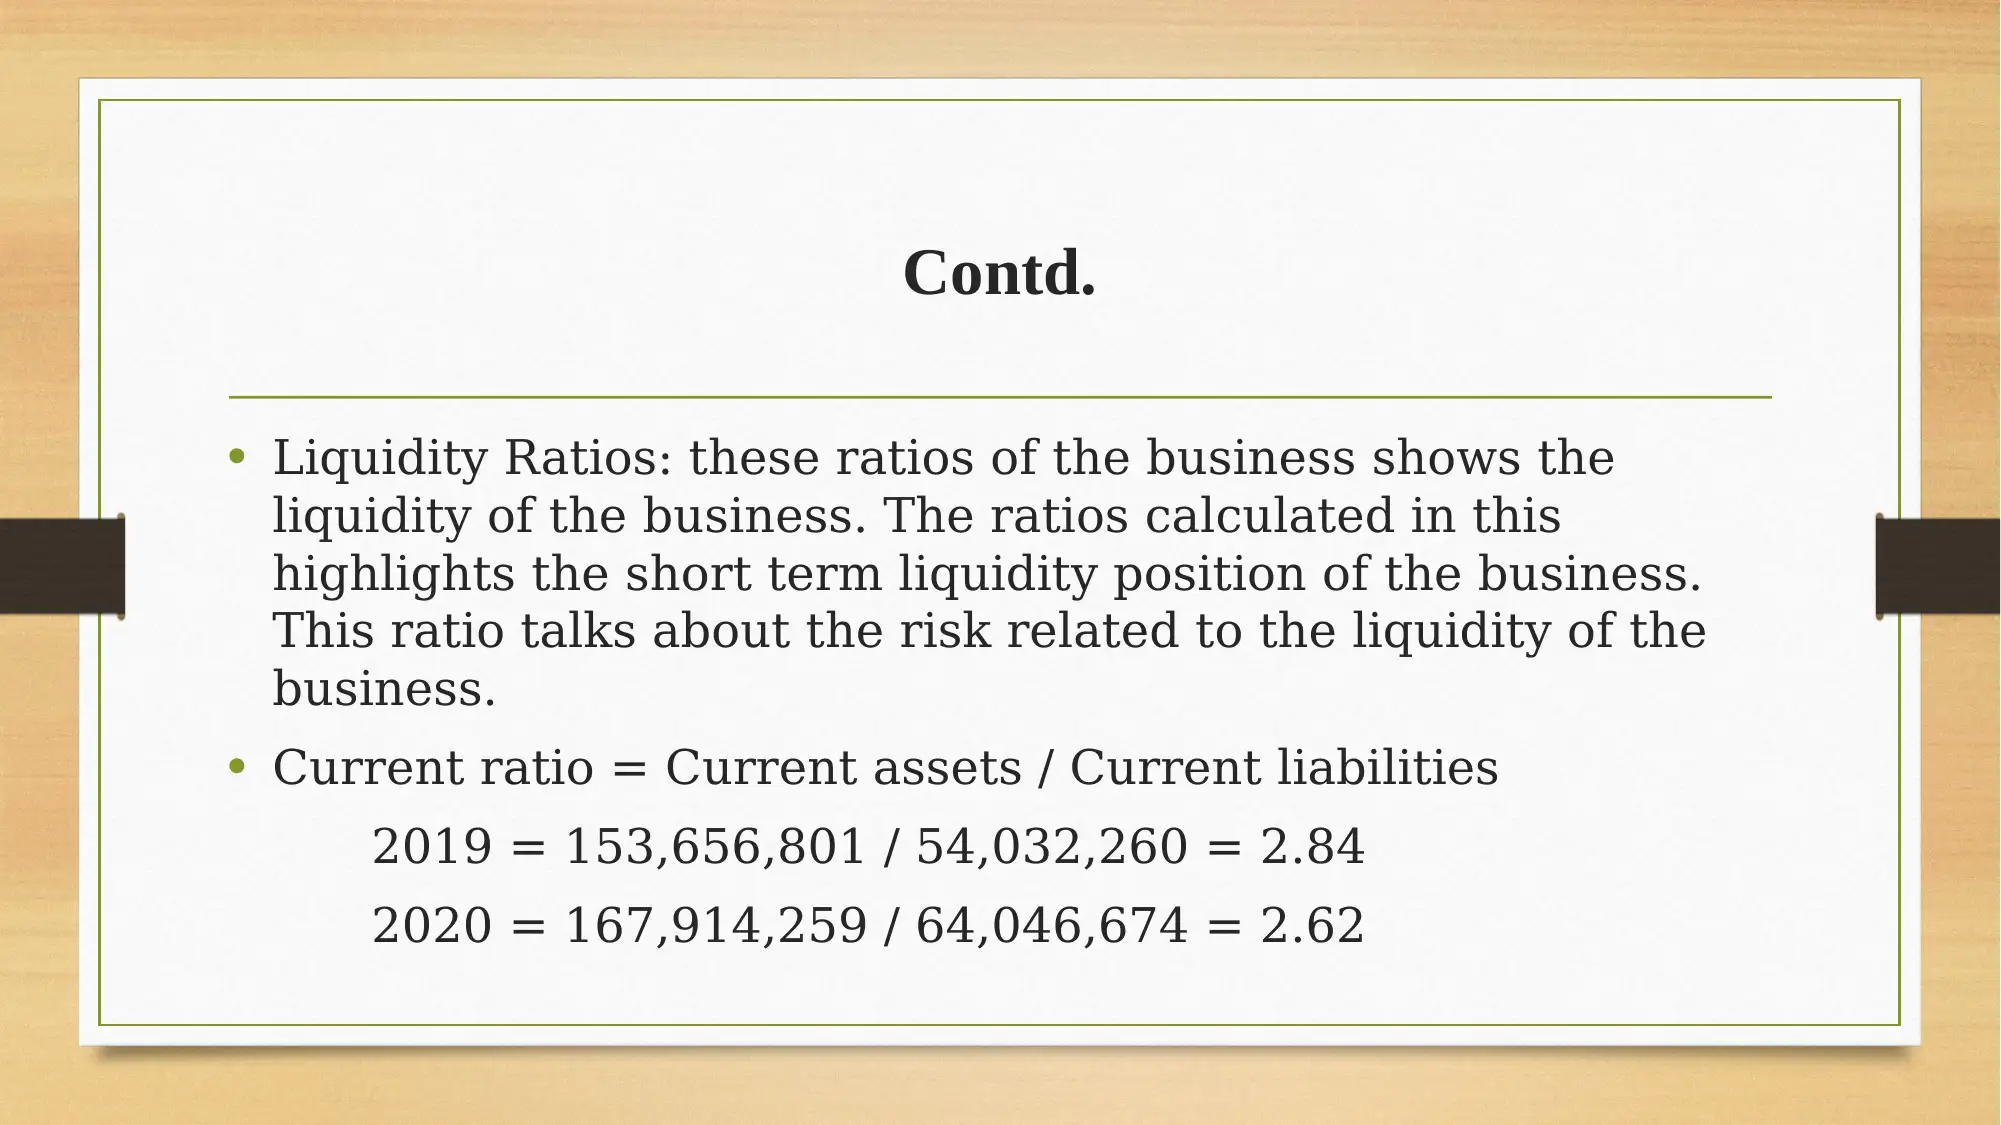
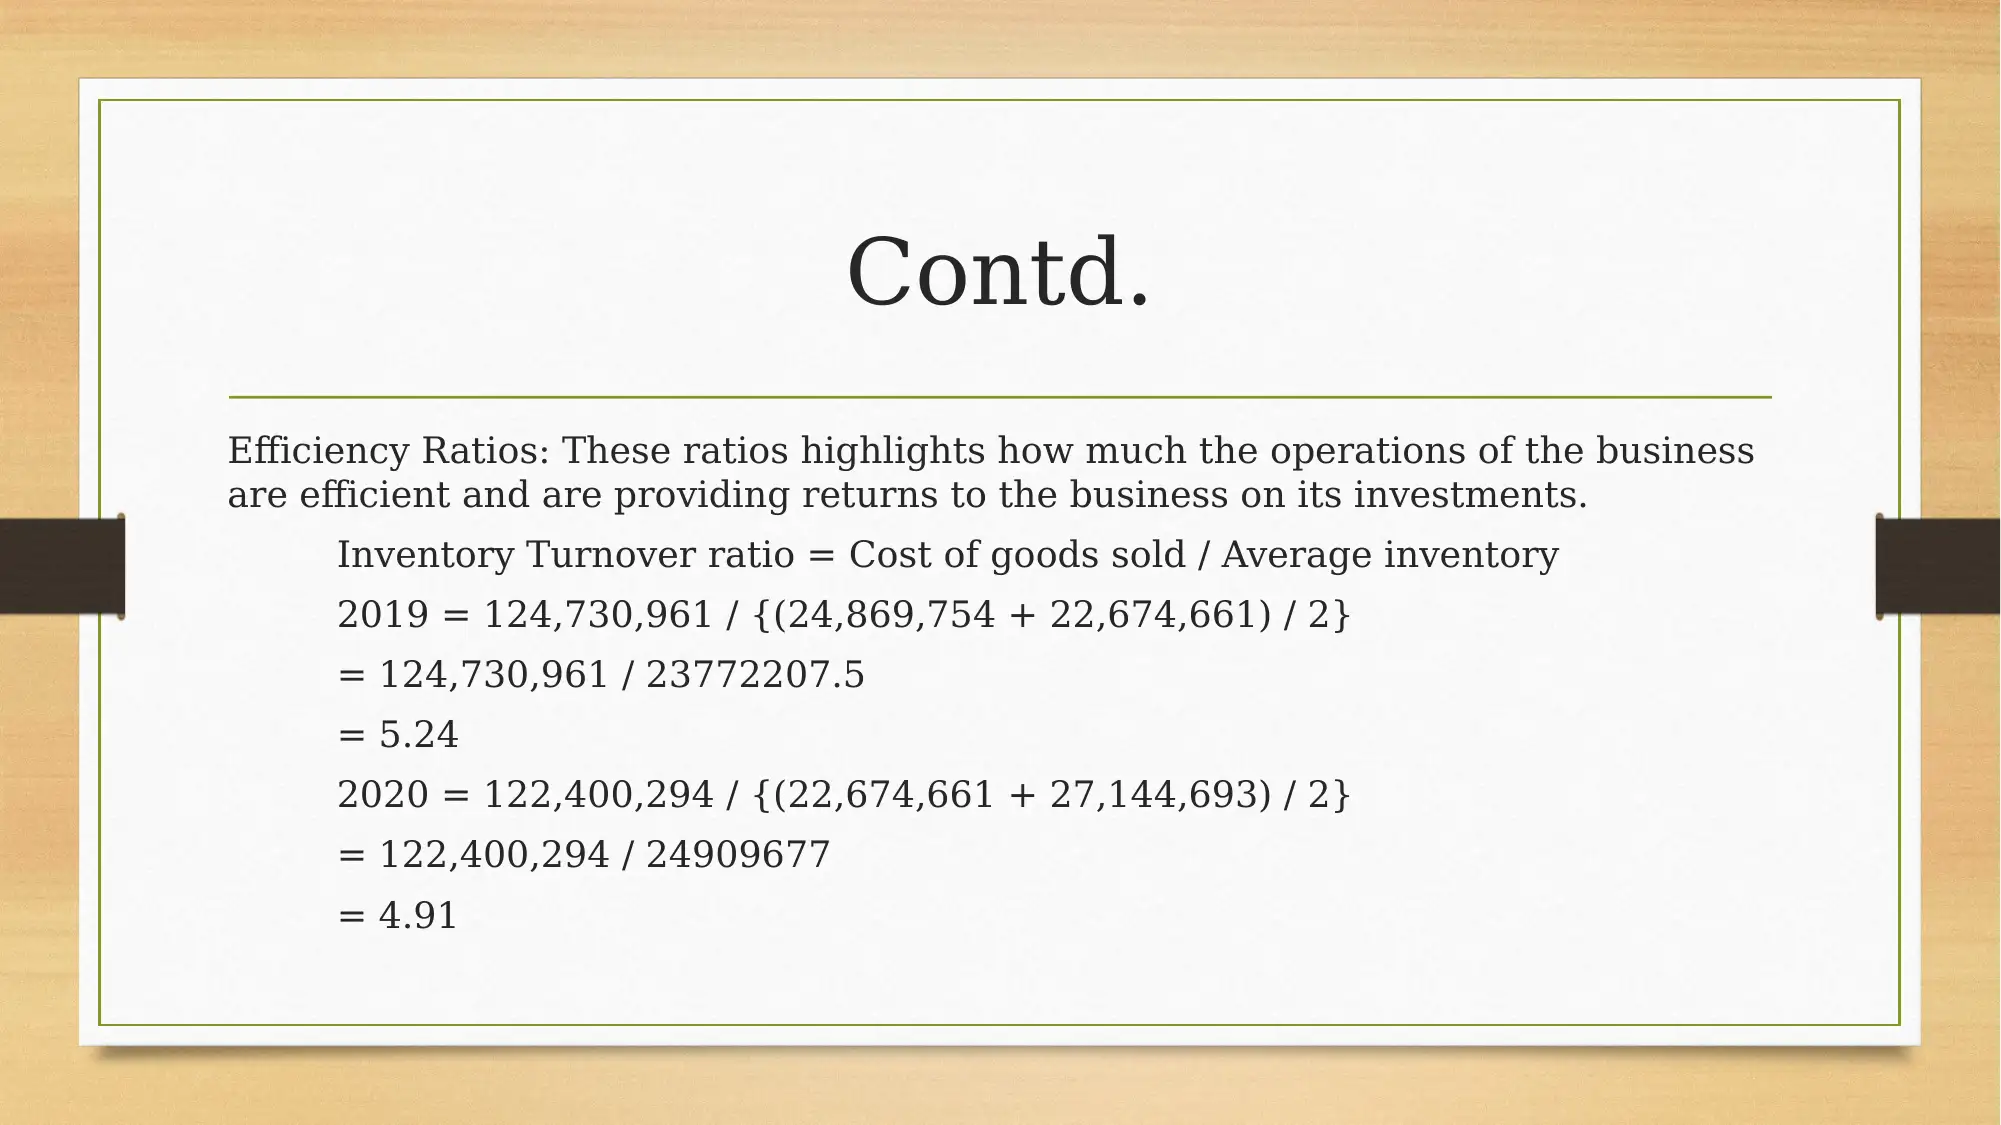
This report examines the critical role of financial data in formulating and implementing business strategies. It evaluates various sources of financial data, including balance sheets, income statements, and cash flow statements, and assesses their importance in strategic decision-making. The report analyzes financial risks, using ratio analysis to highlight profitability, liquidity, and efficiency. It also discusses methods for appraising strategic capital expenditure, such as the payback period and net present value technique. The conclusion emphasizes the significance of financial data for strategic managers and business success. Desklib provides students access to similar solved assignments.

Finance for Strategic Managers
Paraphrase This Document
Need a fresh take? Get an instant paraphrase of this document with our AI Paraphraser

Cover Content
• Introduction
• Evaluation of the sources of financial data
• Assessment of the financial data and its need in the formulation of business strategy
• Analysis of the financial risk related to the business
• Methods used for appraising strategic capital expenditure
• CONCLUSION
• REFERENCES
• Introduction
• Evaluation of the sources of financial data
• Assessment of the financial data and its need in the formulation of business strategy
• Analysis of the financial risk related to the business
• Methods used for appraising strategic capital expenditure
• CONCLUSION
• REFERENCES

INTRODUCTION
Finance related to all the different activities
which are connected with the allocation and
the managing of the financial funds within an
organisation. Financial statements are the
main sources of financial information which
provides the different users of this data to
formulate strategies and work according to the
needs of the business (Bashir and et.al., 2018).
⊘ This is a preview!⊘
Do you want full access?
Subscribe today to unlock all pages.

Trusted by 1+ million students worldwide

Evaluation of the sources of financial data
• A business generally have different objectives
to work in a market. The main objective is to
make money and be profitable to sustain in the
marketplace. The business earn to pay its bills
and invest these funds to earn a return
(Bongomin and et.al., 2018). There are
different sources of financial information which
is required to be taken into account before
formulating the strategies for the business.
Paraphrase This Document
Need a fresh take? Get an instant paraphrase of this document with our AI Paraphraser

Contd.
• Balance Sheet or the Statement of Financial position:
The balance sheet refers to the statement which clarifies
the financial position of the business. This provides
information to the users about what the business owns as in
its assets and what the business is obliged to pay as to their
liabilities with the net worth which is the owner's equity.
The assets of the business are bifurcated into two types,
current and non-current assets. Current assets of the refers
to those assets which can be easily converted into cash
(Chiu and Lee, 2020).

Contd.
• Income Statement or statement of profit and loss:
Income statement of the business shows different incomes
and expenses which are covered by the business in the
period of its operations (Craja, Kim and Lessmann, 2020). It
shows the net profit or loss the business has earned or
incurred in the business due to these incomes and expenses.
The expenses of Samsung plc falls into different categories
like production of different items, research and
development costs for different technologies etc. The net
profit earned by Samsung in the year 2020 is $ 22,370,853.
⊘ This is a preview!⊘
Do you want full access?
Subscribe today to unlock all pages.

Trusted by 1+ million students worldwide

Contd.
• Cash flow statement:
The statement of cash flows highlights the ways and from/
in all the activities where the cash of the business is
inflowing or out flowing in/from the business (Grody, 2018).
The this information it is ascertain if the business have net
inflow or net outflow of cash in the given period of time. The
net inflow in Samsung plc in the year 2020 is $ 2,114,926.
Paraphrase This Document
Need a fresh take? Get an instant paraphrase of this document with our AI Paraphraser

Assessment of the financial data and its need in formulation of business strategy
The financial data is necessary in the business to provide different
important information related to the financial position, cash flows
and the performance of the business to the different users of the
financial information. This set of data helps the different users of
the financial information to take decisions which are related to
the business (Hussain and Siemiatycki, 2018).

Analysis of the financial risk related to the business decisions
The financial risk refers to the danger that may arise in the
business that might put a threat on the financial position of
the business. The financial risk for Samsung is discussed
below with the help of ratio analysis of the last two
accounting year (Martinez, Scherger and Guercio, 2018).
The financial risk refers to the danger that may arise in the
business that might put a threat on the financial position of
the business. The financial risk for Samsung is discussed
below with the help of ratio analysis of the last two
accounting year (Martinez, Scherger and Guercio, 2018).
⊘ This is a preview!⊘
Do you want full access?
Subscribe today to unlock all pages.

Trusted by 1+ million students worldwide

Contd.
The following ratios determines how the business is performing and what are the
different risks that are associated with the business in its working. These ratios
helps the business determine its different business decisions.
• Profitability Ratios: These ratios determine at what rate the business is earning
profit in relation to its sales. This ratio ascertains how the risks related to the
expenses of the business have an impact on the profitability of the business.
Following is the calculation related to net profit margin of Samsung plc.
• Net profit margin = Net profit / sales * 100
2019 = 18,415,633 / 195,179,376 * 100 = 9.4 %
2020 = 22,370,853 / 200,606,179 * 100 = 11.1 %
Paraphrase This Document
Need a fresh take? Get an instant paraphrase of this document with our AI Paraphraser

Contd.
• Liquidity Ratios: these ratios of the business shows the
liquidity of the business. The ratios calculated in this
highlights the short term liquidity position of the business.
This ratio talks about the risk related to the liquidity of the
business.
• Current ratio = Current assets / Current liabilities
2019 = 153,656,801 / 54,032,260 = 2.84
2020 = 167,914,259 / 64,046,674 = 2.62

Contd.
Efficiency Ratios: These ratios highlights how much the operations of the business
are efficient and are providing returns to the business on its investments.
Inventory Turnover ratio = Cost of goods sold / Average inventory
2019 = 124,730,961 / {(24,869,754 + 22,674,661) / 2}
= 124,730,961 / 23772207.5
= 5.24
2020 = 122,400,294 / {(22,674,661 + 27,144,693) / 2}
= 122,400,294 / 24909677
= 4.91
⊘ This is a preview!⊘
Do you want full access?
Subscribe today to unlock all pages.

Trusted by 1+ million students worldwide
1 out of 15
Related Documents
Your All-in-One AI-Powered Toolkit for Academic Success.
+13062052269
info@desklib.com
Available 24*7 on WhatsApp / Email
Unlock your academic potential
Copyright © 2020–2025 A2Z Services. All Rights Reserved. Developed and managed by ZUCOL.


