Strategic Corporate Finance Report: Axiata and Maxis Analysis
VerifiedAdded on 2023/06/11
|19
|4335
|127
Report
AI Summary
This report provides a strategic corporate finance analysis of Axiata Group Berhad and Maxis Berhad, two companies in the communication industry, focusing on a five-year performance review. Part A analyzes the companies' financial performance using various ratios, including liquidity, profitability, working capital, and capital structure ratios, to assess their financial health and efficiency. It also examines strategic investments and corporate governance practices. Part B delves into the calculation of the Weighted Average Cost of Capital (WACC) for J&J, Net Present Value (NPV) calculations, and explores different alternatives to cash dividends for returning value to shareholders, providing a comprehensive financial overview and strategic insights for decision-making.

Strategic Corporate Finance
Paraphrase This Document
Need a fresh take? Get an instant paraphrase of this document with our AI Paraphraser
Table of Contents
INTRODUCTION...........................................................................................................................3
MAIN BODY..................................................................................................................................3
Part A..............................................................................................................................................3
Analysing the performance of the companies on the basis of Ratios..........................................3
Strategic Investment....................................................................................................................7
Corporate Governance.................................................................................................................7
CONCLUSION................................................................................................................................8
Part B.............................................................................................................................................8
1. Calculating the Weighted Average Cost of Capital (WACC) for J & J..................................8
2. Calculating the net present value and recommendations.......................................................10
3. Explaining the four different alternatives to cash dividend as the way of returning value to
the shareholders.........................................................................................................................11
REFERENCES................................................................................................................................1
APPENDICES.................................................................................................................................3
INTRODUCTION
Strategic corporate finance is concerned with managing the finances of the company with
the view to succeed by achieving the long term goals and objectives of the company and
maximization of the funds of the shareholders. This report will investigate the financial
performance of two companies namely, Axiata Group Berhad and Maxis Berhad operating in the
communication industry. Both the companies are listed companies on the FTSE Bursa Malaysia
KLCI Index. On the basis of ratio analysis, corporate governance and investment strategy a
report will be prepared for the Board of Directors through analysis and evaluation of the five-
year performance of both the companies.
Axiata Group Berhad is popularly known as Axiata. The former name of company is TM
International Berhad. It is a Malaysia based MNC operating largely in Asia as
telecommunications conglomerate. One of the largest wireless carriers in Malaysia. Maxis
Berhad or Maxis Communications is a Malaysian service provider of communication services.
The company is one of the biggest and oldest company in telecommunications sector in
Malaysia.
MAIN BODY
Part A
Analysing the performance of the companies on the basis of Ratios
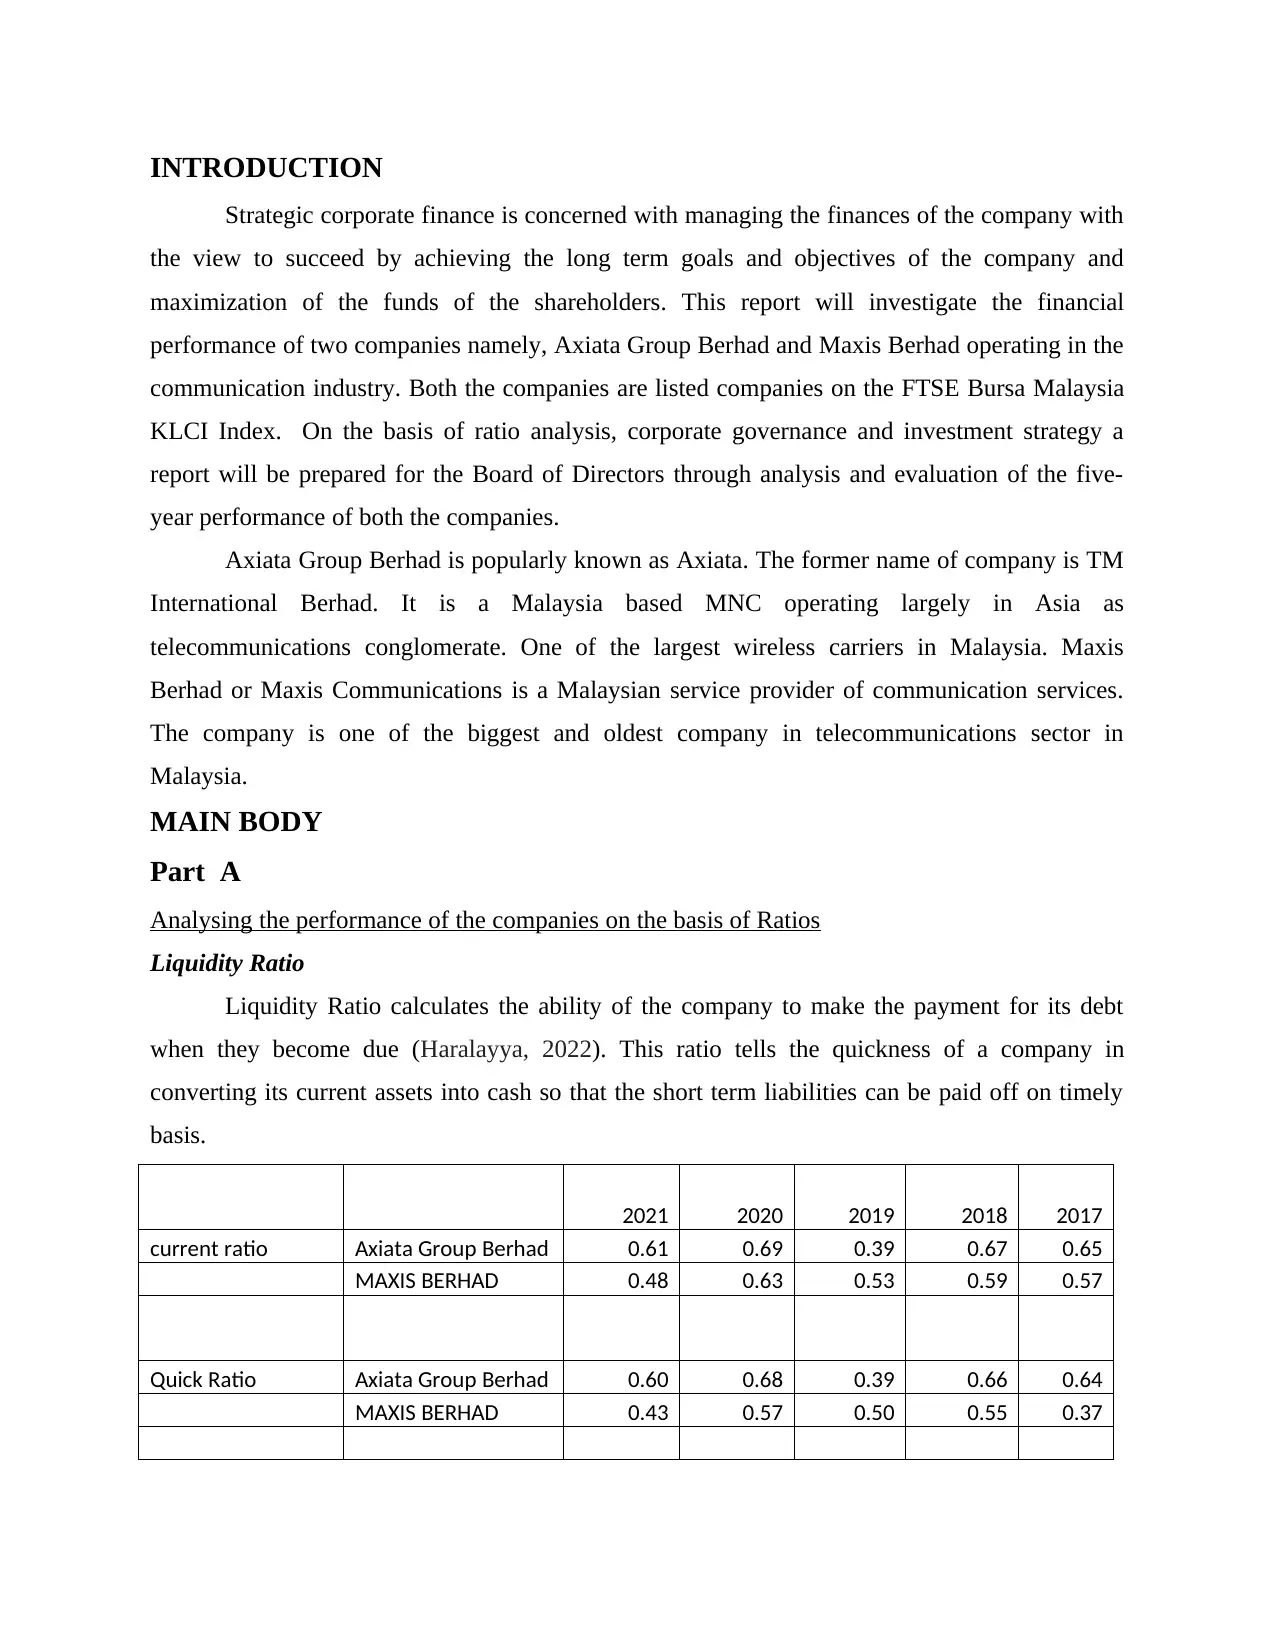
Liquidity Ratio
Liquidity Ratio calculates the ability of the company to make the payment for its debt
when they become due (Haralayya, 2022). This ratio tells the quickness of a company in
converting its current assets into cash so that the short term liabilities can be paid off on timely
basis.
2021 2020 2019 2018 2017
current ratio Axiata Group Berhad 0.61 0.69 0.39 0.67 0.65
MAXIS BERHAD 0.48 0.63 0.53 0.59 0.57
Quick Ratio Axiata Group Berhad 0.60 0.68 0.39 0.66 0.64
MAXIS BERHAD 0.43 0.57 0.50 0.55 0.37
Strategic corporate finance is concerned with managing the finances of the company with
the view to succeed by achieving the long term goals and objectives of the company and
maximization of the funds of the shareholders. This report will investigate the financial
performance of two companies namely, Axiata Group Berhad and Maxis Berhad operating in the
communication industry. Both the companies are listed companies on the FTSE Bursa Malaysia
KLCI Index. On the basis of ratio analysis, corporate governance and investment strategy a
report will be prepared for the Board of Directors through analysis and evaluation of the five-
year performance of both the companies.
Axiata Group Berhad is popularly known as Axiata. The former name of company is TM
International Berhad. It is a Malaysia based MNC operating largely in Asia as
telecommunications conglomerate. One of the largest wireless carriers in Malaysia. Maxis
Berhad or Maxis Communications is a Malaysian service provider of communication services.
The company is one of the biggest and oldest company in telecommunications sector in
Malaysia.
MAIN BODY
Part A
Analysing the performance of the companies on the basis of Ratios
Liquidity Ratio
Liquidity Ratio calculates the ability of the company to make the payment for its debt
when they become due (Haralayya, 2022). This ratio tells the quickness of a company in
converting its current assets into cash so that the short term liabilities can be paid off on timely
basis.
2021 2020 2019 2018 2017
current ratio Axiata Group Berhad 0.61 0.69 0.39 0.67 0.65
MAXIS BERHAD 0.48 0.63 0.53 0.59 0.57
Quick Ratio Axiata Group Berhad 0.60 0.68 0.39 0.66 0.64
MAXIS BERHAD 0.43 0.57 0.50 0.55 0.37
⊘ This is a preview!⊘
Do you want full access?
Subscribe today to unlock all pages.
Trusted by 1+ million students worldwide
The two liquidity ratios calculated are current ratio and quick ratio. The current ratio of
Axiata Group Berhad is 0.61 for the year 2021. The company had the lowest current ratio in the
year 2019. Expect year 2019 other four years shows little variations in the current ratio. The
company’s current ratio rises in year 2018 slightly as compared to the year 2017. The reason
behind weak current ratio in the year 2019 is low current assets with the company against the
comparatively high current liabilities as compared to the other years. On an average the current
ratio of the company indicates that the company has 0.6 current asset against each of its short
term liability (INTEGRATED ANNUAL REPORTS. 2022). Liquidity ratios shows the cash
available with the company to pay for its current liabilities. Quick assets are calculated by
subtracting the inventories from the current assets. The immediate cash available with the
company to pay for its 1RM of short term liabilities is 0.60RM in the current year.
The current and quick ratios of Maxis Berhad fell in the year 2021 in comparison to
2020. Company has RM0.63 and RM0.57 worth of current and quick assets respectively against
1RM of its current liabilities in the year 2020 that declined to 0.48RM of current and 0.43RM of
quick assets in the year 2021. On an average the company has RM0.5 of current assets against
each of its liabilities.
The liquidity of Axiata Group Berhad is better in comparison to Maxis Berhad. This
indicates the better availability of short term assets with the company Axiata as compared to
Maxis to pay for its current liabilities when they arise.
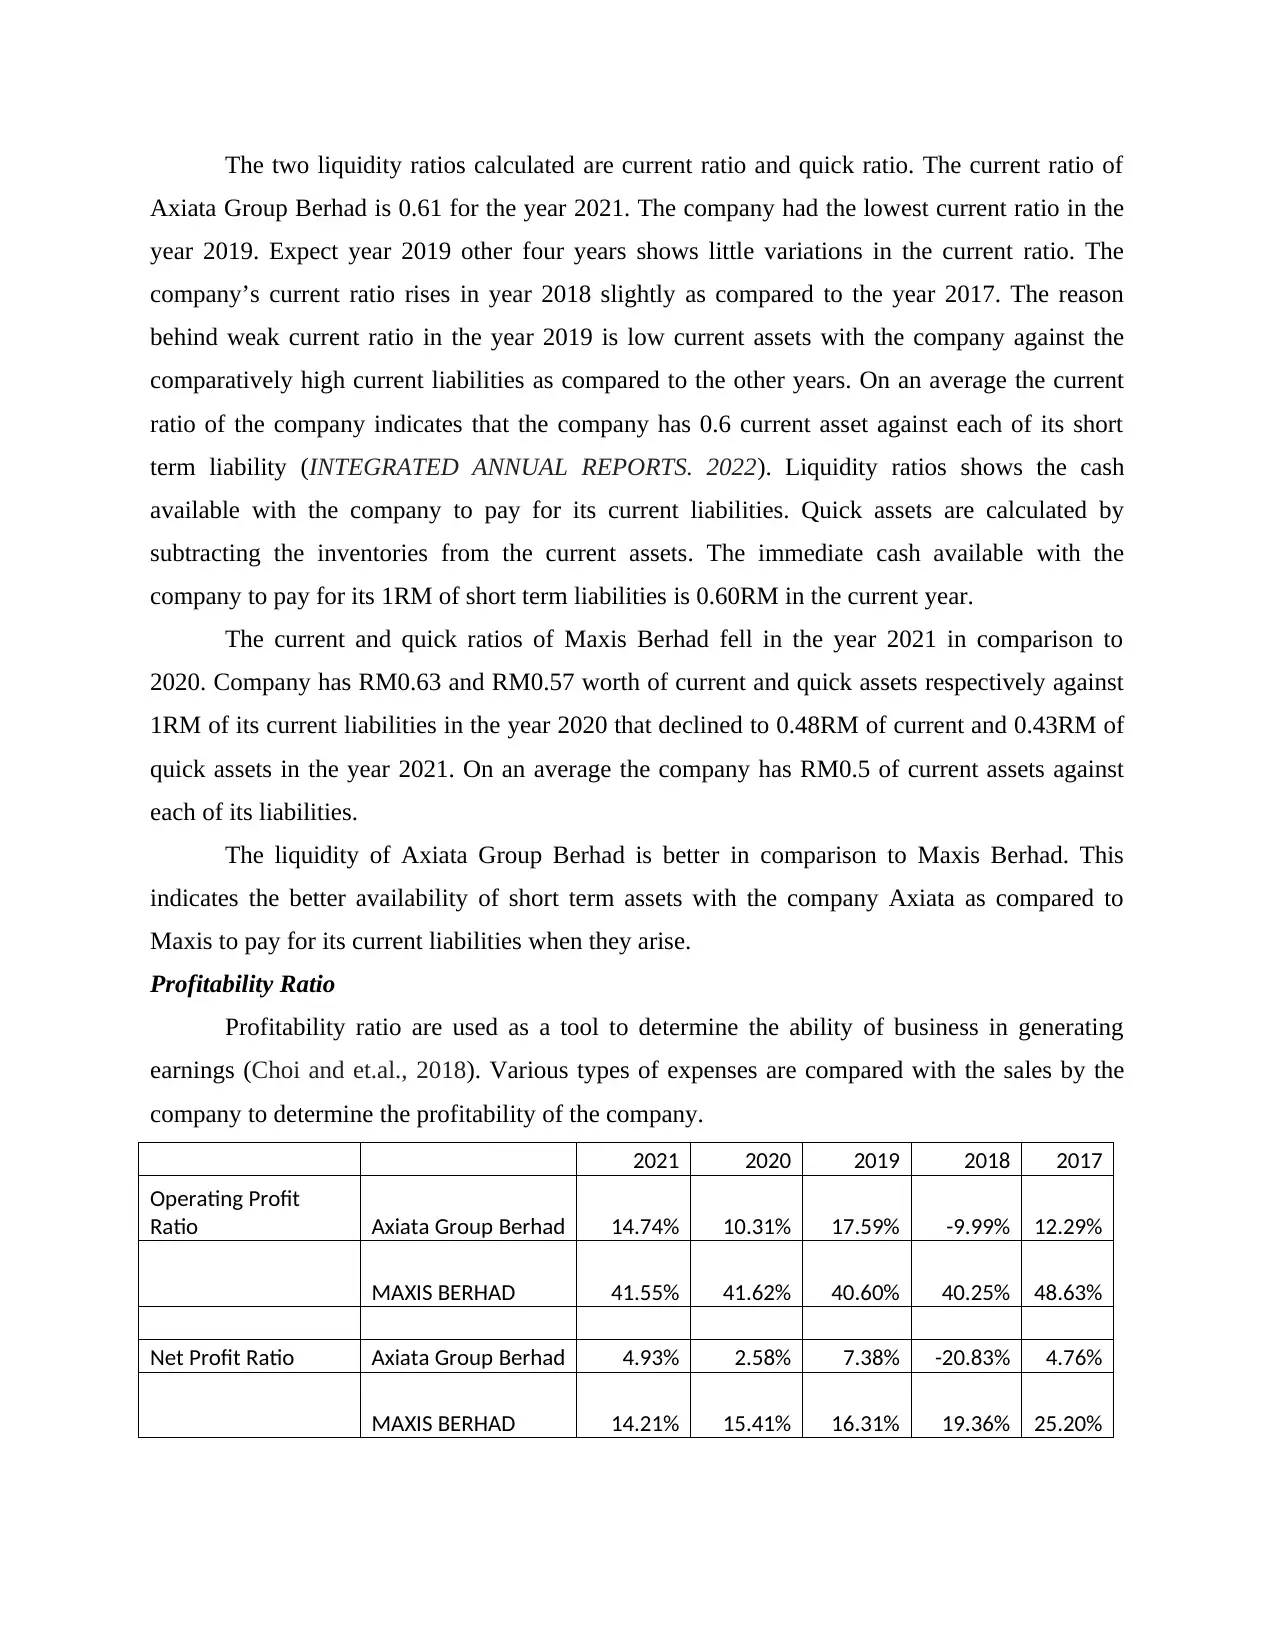
Profitability Ratio
Profitability ratio are used as a tool to determine the ability of business in generating
earnings (Choi and et.al., 2018). Various types of expenses are compared with the sales by the
company to determine the profitability of the company.
2021 2020 2019 2018 2017
Operating Profit
Ratio Axiata Group Berhad 14.74% 10.31% 17.59% -9.99% 12.29%
MAXIS BERHAD 41.55% 41.62% 40.60% 40.25% 48.63%
Net Profit Ratio Axiata Group Berhad 4.93% 2.58% 7.38% -20.83% 4.76%
MAXIS BERHAD 14.21% 15.41% 16.31% 19.36% 25.20%
Axiata Group Berhad is 0.61 for the year 2021. The company had the lowest current ratio in the
year 2019. Expect year 2019 other four years shows little variations in the current ratio. The
company’s current ratio rises in year 2018 slightly as compared to the year 2017. The reason
behind weak current ratio in the year 2019 is low current assets with the company against the
comparatively high current liabilities as compared to the other years. On an average the current
ratio of the company indicates that the company has 0.6 current asset against each of its short
term liability (INTEGRATED ANNUAL REPORTS. 2022). Liquidity ratios shows the cash
available with the company to pay for its current liabilities. Quick assets are calculated by
subtracting the inventories from the current assets. The immediate cash available with the
company to pay for its 1RM of short term liabilities is 0.60RM in the current year.
The current and quick ratios of Maxis Berhad fell in the year 2021 in comparison to
2020. Company has RM0.63 and RM0.57 worth of current and quick assets respectively against
1RM of its current liabilities in the year 2020 that declined to 0.48RM of current and 0.43RM of
quick assets in the year 2021. On an average the company has RM0.5 of current assets against
each of its liabilities.
The liquidity of Axiata Group Berhad is better in comparison to Maxis Berhad. This
indicates the better availability of short term assets with the company Axiata as compared to
Maxis to pay for its current liabilities when they arise.
Profitability Ratio
Profitability ratio are used as a tool to determine the ability of business in generating
earnings (Choi and et.al., 2018). Various types of expenses are compared with the sales by the
company to determine the profitability of the company.
2021 2020 2019 2018 2017
Operating Profit
Ratio Axiata Group Berhad 14.74% 10.31% 17.59% -9.99% 12.29%
MAXIS BERHAD 41.55% 41.62% 40.60% 40.25% 48.63%
Net Profit Ratio Axiata Group Berhad 4.93% 2.58% 7.38% -20.83% 4.76%
MAXIS BERHAD 14.21% 15.41% 16.31% 19.36% 25.20%
Paraphrase This Document
Need a fresh take? Get an instant paraphrase of this document with our AI Paraphraser
Operating profit ratio is calculated by dividing the profit generated by the company from
its operations or the revenue left with the company after providing for its operating expenses
with the sales by the company. The ratio for the operations of the Axiata Group Berhad show an
increasing trend for the year 2021 as compared to the year 2020. The company has operating loss
for the year 2018 and the computed ratio is -10% approximately. The operating profit ratio of the
company hiked in the year 2019. Net profit ratio for the year 2021 is nearly 5% showing an
approx. rise of 2.5% from the previous year.
Operating profit ratio of the Maxis communication is stable from the last four years after
a decline of nearly 8% in the year 2018. The net profit ratio of the company shows gradual
declining trend over the past five years (Annual Report. 2022).
In terms of the profitability the Maxis communications is ahead and better from the
Axiata Group Berhad. Both the operating profit and net profit ratios are promising for the later
company in comparison to former.
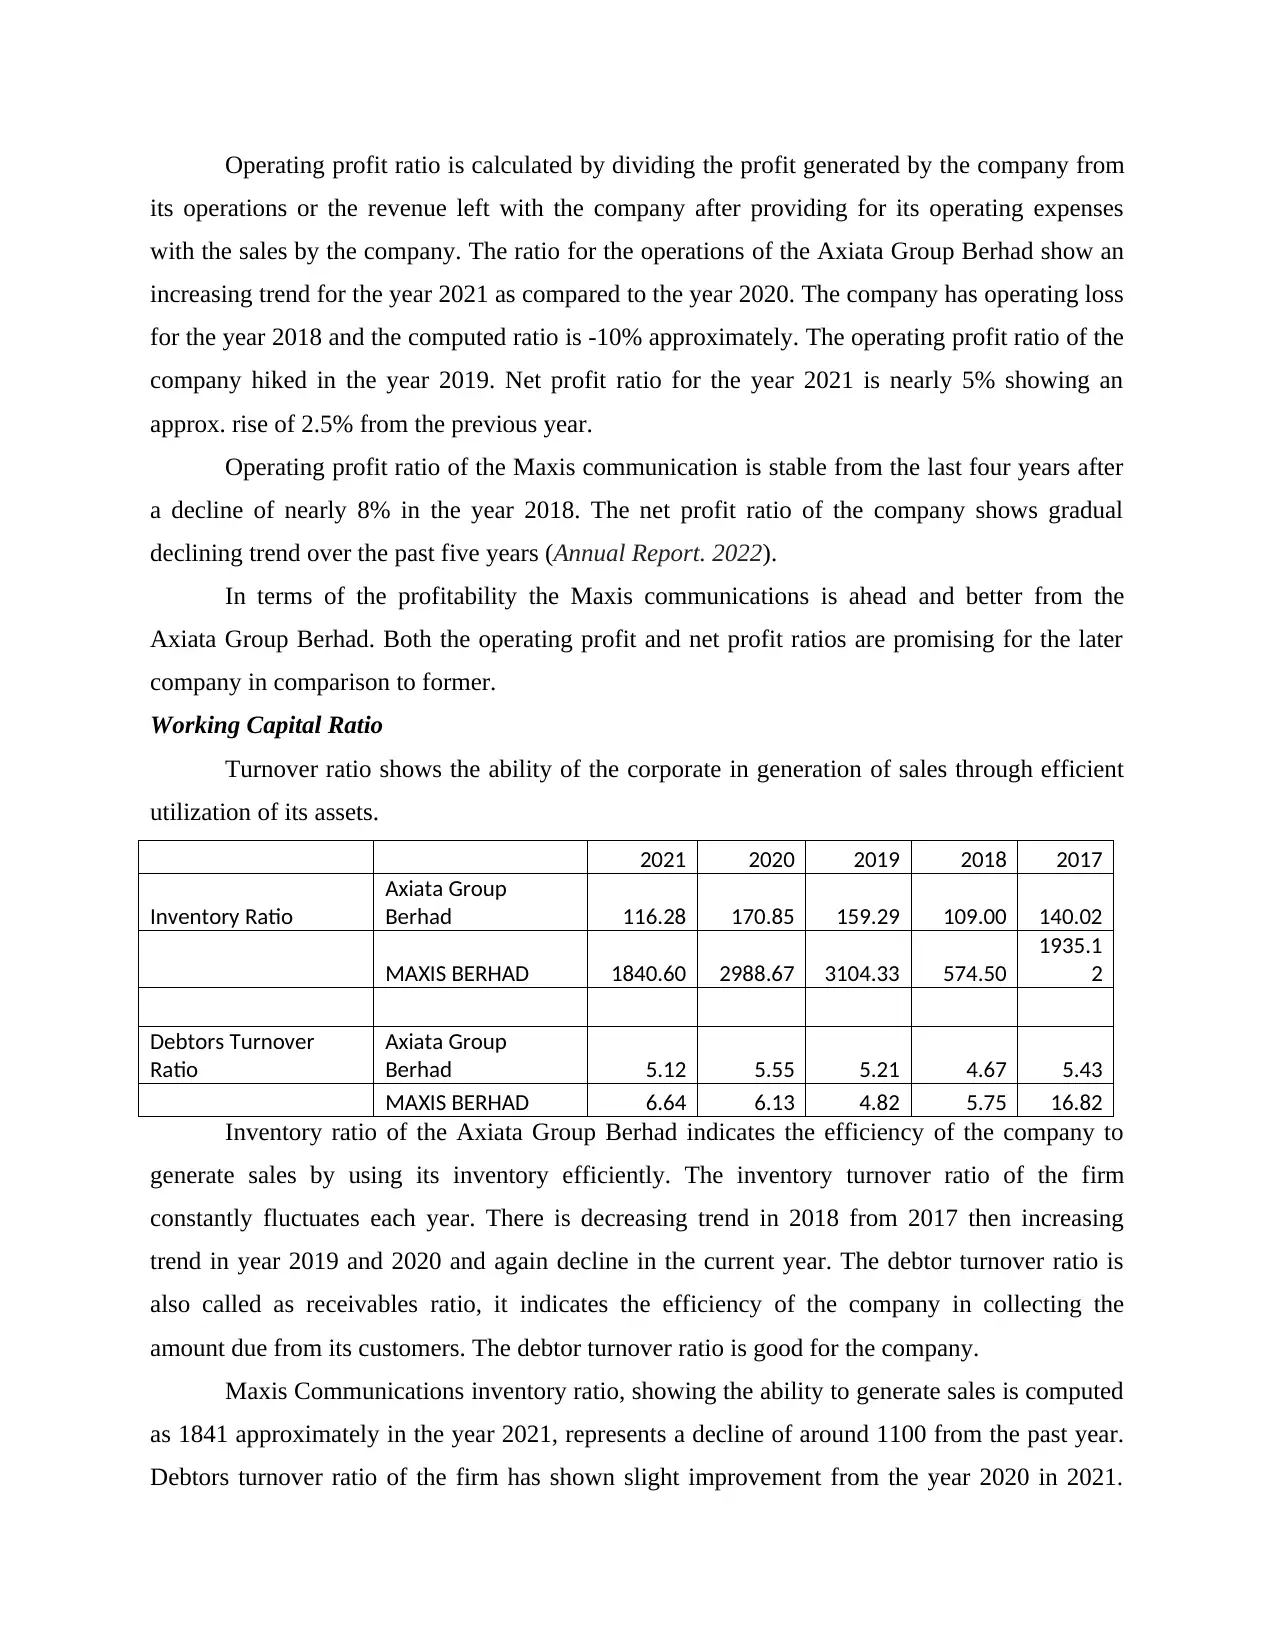
Working Capital Ratio
Turnover ratio shows the ability of the corporate in generation of sales through efficient
utilization of its assets.
2021 2020 2019 2018 2017
Inventory Ratio
Axiata Group
Berhad 116.28 170.85 159.29 109.00 140.02
MAXIS BERHAD 1840.60 2988.67 3104.33 574.50
1935.1
2
Debtors Turnover
Ratio
Axiata Group
Berhad 5.12 5.55 5.21 4.67 5.43
MAXIS BERHAD 6.64 6.13 4.82 5.75 16.82
Inventory ratio of the Axiata Group Berhad indicates the efficiency of the company to
generate sales by using its inventory efficiently. The inventory turnover ratio of the firm
constantly fluctuates each year. There is decreasing trend in 2018 from 2017 then increasing
trend in year 2019 and 2020 and again decline in the current year. The debtor turnover ratio is
also called as receivables ratio, it indicates the efficiency of the company in collecting the
amount due from its customers. The debtor turnover ratio is good for the company.
Maxis Communications inventory ratio, showing the ability to generate sales is computed
as 1841 approximately in the year 2021, represents a decline of around 1100 from the past year.
Debtors turnover ratio of the firm has shown slight improvement from the year 2020 in 2021.
its operations or the revenue left with the company after providing for its operating expenses
with the sales by the company. The ratio for the operations of the Axiata Group Berhad show an
increasing trend for the year 2021 as compared to the year 2020. The company has operating loss
for the year 2018 and the computed ratio is -10% approximately. The operating profit ratio of the
company hiked in the year 2019. Net profit ratio for the year 2021 is nearly 5% showing an
approx. rise of 2.5% from the previous year.
Operating profit ratio of the Maxis communication is stable from the last four years after
a decline of nearly 8% in the year 2018. The net profit ratio of the company shows gradual
declining trend over the past five years (Annual Report. 2022).
In terms of the profitability the Maxis communications is ahead and better from the
Axiata Group Berhad. Both the operating profit and net profit ratios are promising for the later
company in comparison to former.
Working Capital Ratio
Turnover ratio shows the ability of the corporate in generation of sales through efficient
utilization of its assets.
2021 2020 2019 2018 2017
Inventory Ratio
Axiata Group
Berhad 116.28 170.85 159.29 109.00 140.02
MAXIS BERHAD 1840.60 2988.67 3104.33 574.50
1935.1
2
Debtors Turnover
Ratio
Axiata Group
Berhad 5.12 5.55 5.21 4.67 5.43
MAXIS BERHAD 6.64 6.13 4.82 5.75 16.82
Inventory ratio of the Axiata Group Berhad indicates the efficiency of the company to
generate sales by using its inventory efficiently. The inventory turnover ratio of the firm
constantly fluctuates each year. There is decreasing trend in 2018 from 2017 then increasing
trend in year 2019 and 2020 and again decline in the current year. The debtor turnover ratio is
also called as receivables ratio, it indicates the efficiency of the company in collecting the
amount due from its customers. The debtor turnover ratio is good for the company.
Maxis Communications inventory ratio, showing the ability to generate sales is computed
as 1841 approximately in the year 2021, represents a decline of around 1100 from the past year.
Debtors turnover ratio of the firm has shown slight improvement from the year 2020 in 2021.
There is an increasing trend over the last three years reflecting the increasing efficiency of the
firm.
On the basis of the working capital ratio the efficiency of Maxis Berhad is higher than the
other company Axiata Group Berhad. Maxis communication uses its assets more efficiently than
the Axiata leading to comparatively higher sales of the company.
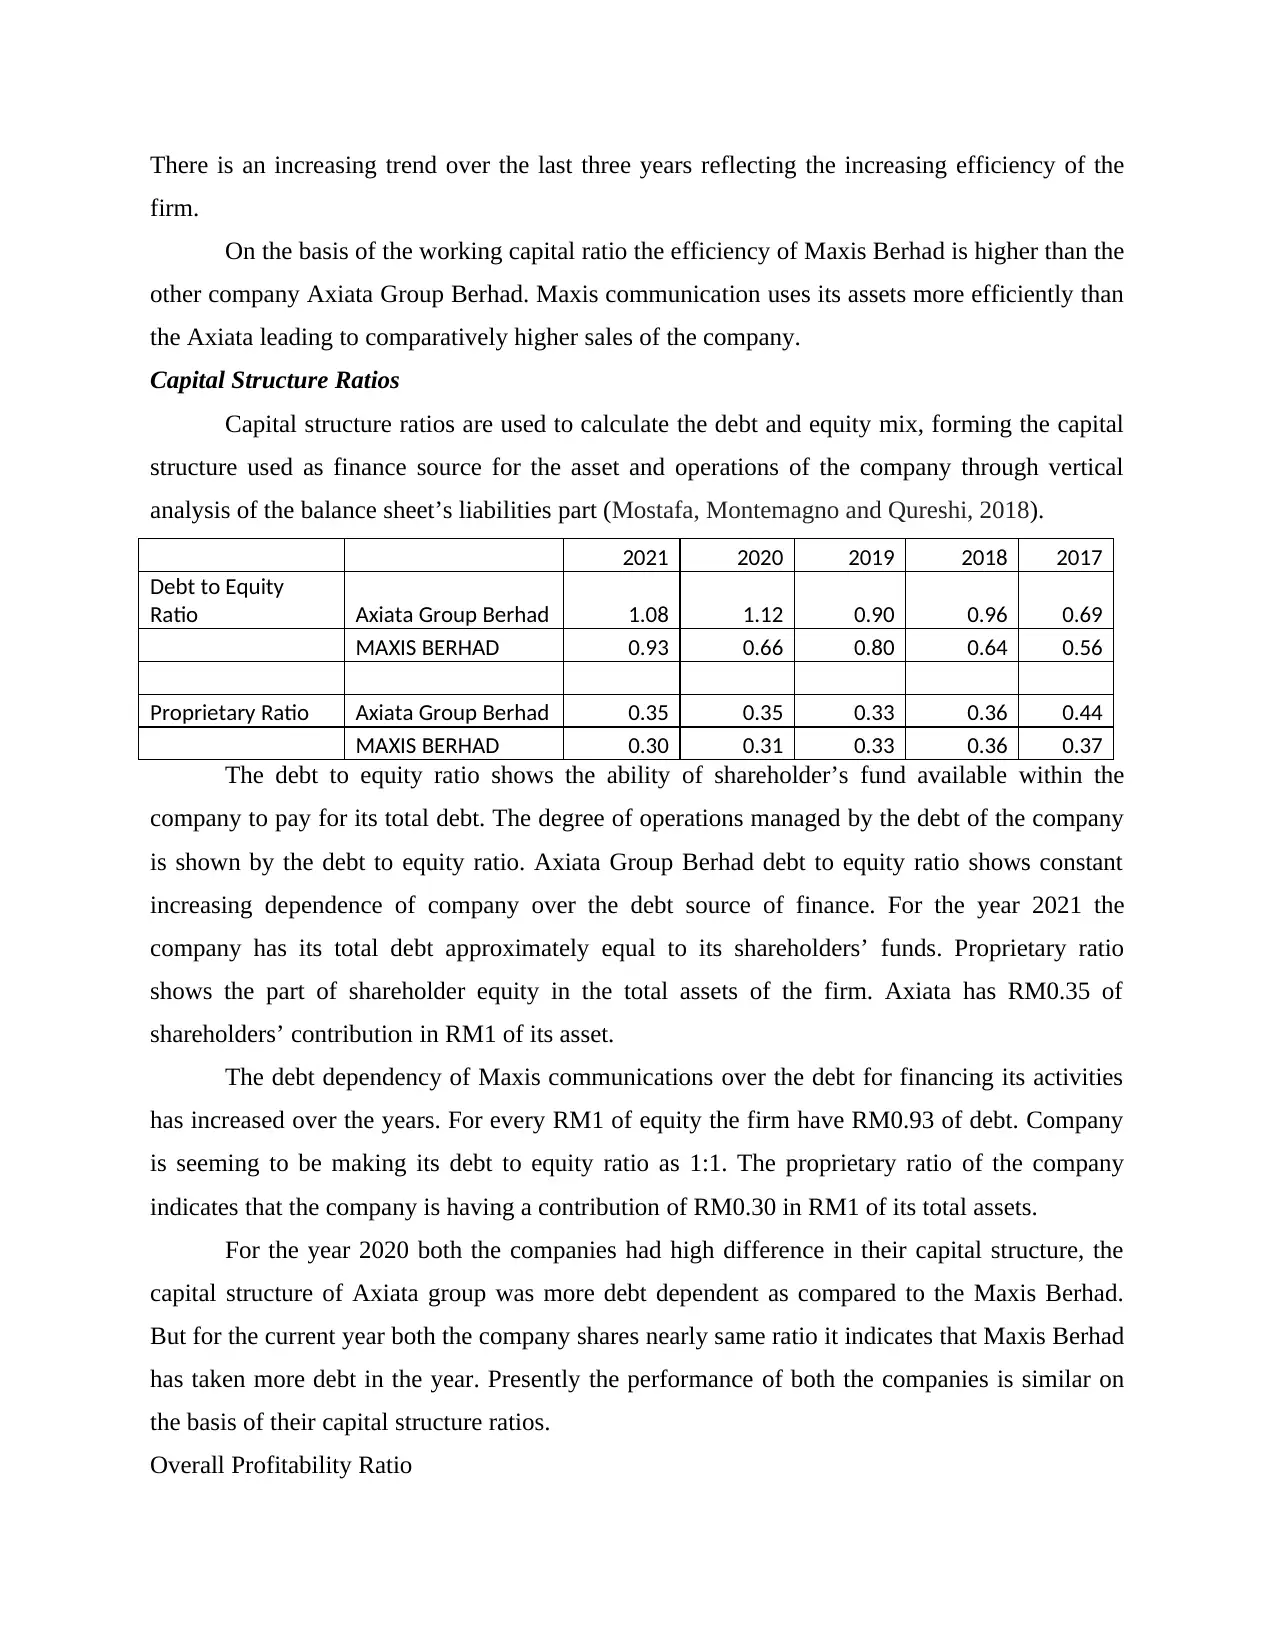
Capital Structure Ratios
Capital structure ratios are used to calculate the debt and equity mix, forming the capital
structure used as finance source for the asset and operations of the company through vertical
analysis of the balance sheet’s liabilities part (Mostafa, Montemagno and Qureshi, 2018).
2021 2020 2019 2018 2017
Debt to Equity
Ratio Axiata Group Berhad 1.08 1.12 0.90 0.96 0.69
MAXIS BERHAD 0.93 0.66 0.80 0.64 0.56
Proprietary Ratio Axiata Group Berhad 0.35 0.35 0.33 0.36 0.44
MAXIS BERHAD 0.30 0.31 0.33 0.36 0.37
The debt to equity ratio shows the ability of shareholder’s fund available within the
company to pay for its total debt. The degree of operations managed by the debt of the company
is shown by the debt to equity ratio. Axiata Group Berhad debt to equity ratio shows constant
increasing dependence of company over the debt source of finance. For the year 2021 the
company has its total debt approximately equal to its shareholders’ funds. Proprietary ratio
shows the part of shareholder equity in the total assets of the firm. Axiata has RM0.35 of
shareholders’ contribution in RM1 of its asset.
The debt dependency of Maxis communications over the debt for financing its activities
has increased over the years. For every RM1 of equity the firm have RM0.93 of debt. Company
is seeming to be making its debt to equity ratio as 1:1. The proprietary ratio of the company
indicates that the company is having a contribution of RM0.30 in RM1 of its total assets.
For the year 2020 both the companies had high difference in their capital structure, the
capital structure of Axiata group was more debt dependent as compared to the Maxis Berhad.
But for the current year both the company shares nearly same ratio it indicates that Maxis Berhad
has taken more debt in the year. Presently the performance of both the companies is similar on
the basis of their capital structure ratios.
Overall Profitability Ratio
firm.
On the basis of the working capital ratio the efficiency of Maxis Berhad is higher than the
other company Axiata Group Berhad. Maxis communication uses its assets more efficiently than
the Axiata leading to comparatively higher sales of the company.
Capital Structure Ratios
Capital structure ratios are used to calculate the debt and equity mix, forming the capital
structure used as finance source for the asset and operations of the company through vertical
analysis of the balance sheet’s liabilities part (Mostafa, Montemagno and Qureshi, 2018).
2021 2020 2019 2018 2017
Debt to Equity
Ratio Axiata Group Berhad 1.08 1.12 0.90 0.96 0.69
MAXIS BERHAD 0.93 0.66 0.80 0.64 0.56
Proprietary Ratio Axiata Group Berhad 0.35 0.35 0.33 0.36 0.44
MAXIS BERHAD 0.30 0.31 0.33 0.36 0.37
The debt to equity ratio shows the ability of shareholder’s fund available within the
company to pay for its total debt. The degree of operations managed by the debt of the company
is shown by the debt to equity ratio. Axiata Group Berhad debt to equity ratio shows constant
increasing dependence of company over the debt source of finance. For the year 2021 the
company has its total debt approximately equal to its shareholders’ funds. Proprietary ratio
shows the part of shareholder equity in the total assets of the firm. Axiata has RM0.35 of
shareholders’ contribution in RM1 of its asset.
The debt dependency of Maxis communications over the debt for financing its activities
has increased over the years. For every RM1 of equity the firm have RM0.93 of debt. Company
is seeming to be making its debt to equity ratio as 1:1. The proprietary ratio of the company
indicates that the company is having a contribution of RM0.30 in RM1 of its total assets.
For the year 2020 both the companies had high difference in their capital structure, the
capital structure of Axiata group was more debt dependent as compared to the Maxis Berhad.
But for the current year both the company shares nearly same ratio it indicates that Maxis Berhad
has taken more debt in the year. Presently the performance of both the companies is similar on
the basis of their capital structure ratios.
Overall Profitability Ratio
⊘ This is a preview!⊘
Do you want full access?
Subscribe today to unlock all pages.
Trusted by 1+ million students worldwide
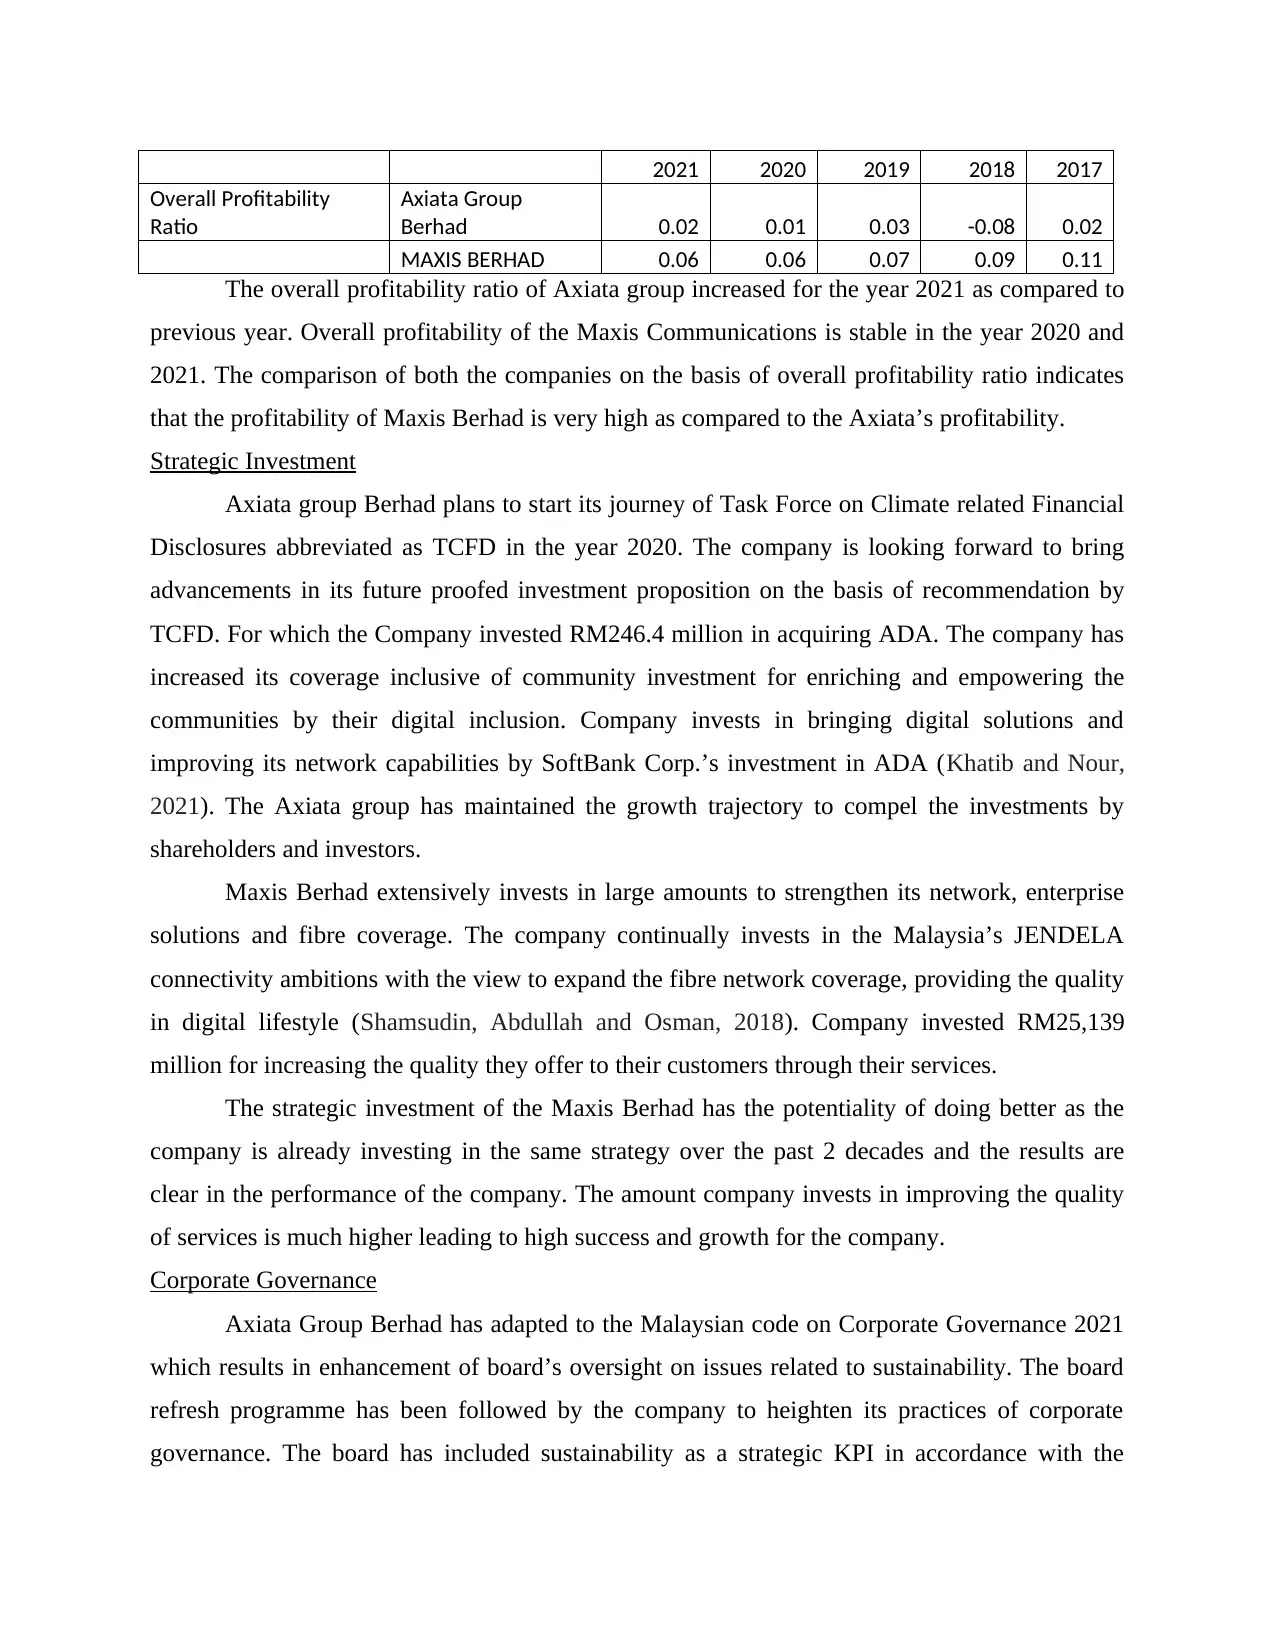
2021 2020 2019 2018 2017
Overall Profitability
Ratio
Axiata Group
Berhad 0.02 0.01 0.03 -0.08 0.02
MAXIS BERHAD 0.06 0.06 0.07 0.09 0.11
The overall profitability ratio of Axiata group increased for the year 2021 as compared to
previous year. Overall profitability of the Maxis Communications is stable in the year 2020 and
2021. The comparison of both the companies on the basis of overall profitability ratio indicates
that the profitability of Maxis Berhad is very high as compared to the Axiata’s profitability.
Strategic Investment
Axiata group Berhad plans to start its journey of Task Force on Climate related Financial
Disclosures abbreviated as TCFD in the year 2020. The company is looking forward to bring
advancements in its future proofed investment proposition on the basis of recommendation by
TCFD. For which the Company invested RM246.4 million in acquiring ADA. The company has
increased its coverage inclusive of community investment for enriching and empowering the
communities by their digital inclusion. Company invests in bringing digital solutions and
improving its network capabilities by SoftBank Corp.’s investment in ADA (Khatib and Nour,
2021). The Axiata group has maintained the growth trajectory to compel the investments by
shareholders and investors.
Maxis Berhad extensively invests in large amounts to strengthen its network, enterprise
solutions and fibre coverage. The company continually invests in the Malaysia’s JENDELA
connectivity ambitions with the view to expand the fibre network coverage, providing the quality
in digital lifestyle (Shamsudin, Abdullah and Osman, 2018). Company invested RM25,139
million for increasing the quality they offer to their customers through their services.
The strategic investment of the Maxis Berhad has the potentiality of doing better as the
company is already investing in the same strategy over the past 2 decades and the results are
clear in the performance of the company. The amount company invests in improving the quality
of services is much higher leading to high success and growth for the company.
Corporate Governance
Axiata Group Berhad has adapted to the Malaysian code on Corporate Governance 2021
which results in enhancement of board’s oversight on issues related to sustainability. The board
refresh programme has been followed by the company to heighten its practices of corporate
governance. The board has included sustainability as a strategic KPI in accordance with the
Paraphrase This Document
Need a fresh take? Get an instant paraphrase of this document with our AI Paraphraser
Malaysian code (Dixon, 2022). High ethical and good corporate governance standards are
followed by the company. The effectivity of the governance is recognized by the Indonesian
Institute for corporate directorship corporate governance award 2021. All the principles of good
corporate governance like integrity, ethics, respect to rights and balanced disclosure are
followed.
The board of the Maxis Communication is committed towards upholding the highest
standards of corporate governance. The company hols integrity at all levels, regulatory duties
and commercial objectives are duly undertaken (Ab, Rahaman and Haron, 2021). Malaysian
Code on Corporate Governance 2021 recommendations are followed by the company.
The Corporate Governance of Axiata Group Berhad is better in comparison to Maxis.
Through effective corporate governance the company ensures the sustainability in its processes
and is highly integrated and transparent.
CONCLUSION
Based on the report the importance of strategic corporate finance in evaluating the
performance has been highlighted. The report has calculated the ratios of Axiata Group Berhad
and Maxis Berhad to analyse the performance of the two companies. Maxis Berhad is the higher
performing company based on the liquidity, profitability, solvency and efficiency of the
company being better. The corporate governance of the Axiata Group Berhad is better than
Maxis communications. The strategic investment of Maxis Communications in more reliable.
Part B
1. Calculating the Weighted Average Cost of Capital (WACC) for J & J
The WACC is a concept which outlines the average cost of capital from the different
sources though which company generates money. These different sources include common
stock, bonds, debenture, preferred stock and other different forms of debt (Budhathoki and Rai,
2020). This tool is assistive for the investors to determine that whether investment within the
company is beneficial and profitable or not. This WACC is being calculated by multiplying the
cost of every capital source with the related weight and then totalling all the sources together
gives the WACC.
WACC=(VE×Re) + (VD×Rd×(1−Tc))
Here
E- market value of equity
D is market value of debt
V is E + D
Re is cost of equity
Rd is cost of debt
Tc is corporate tax rate
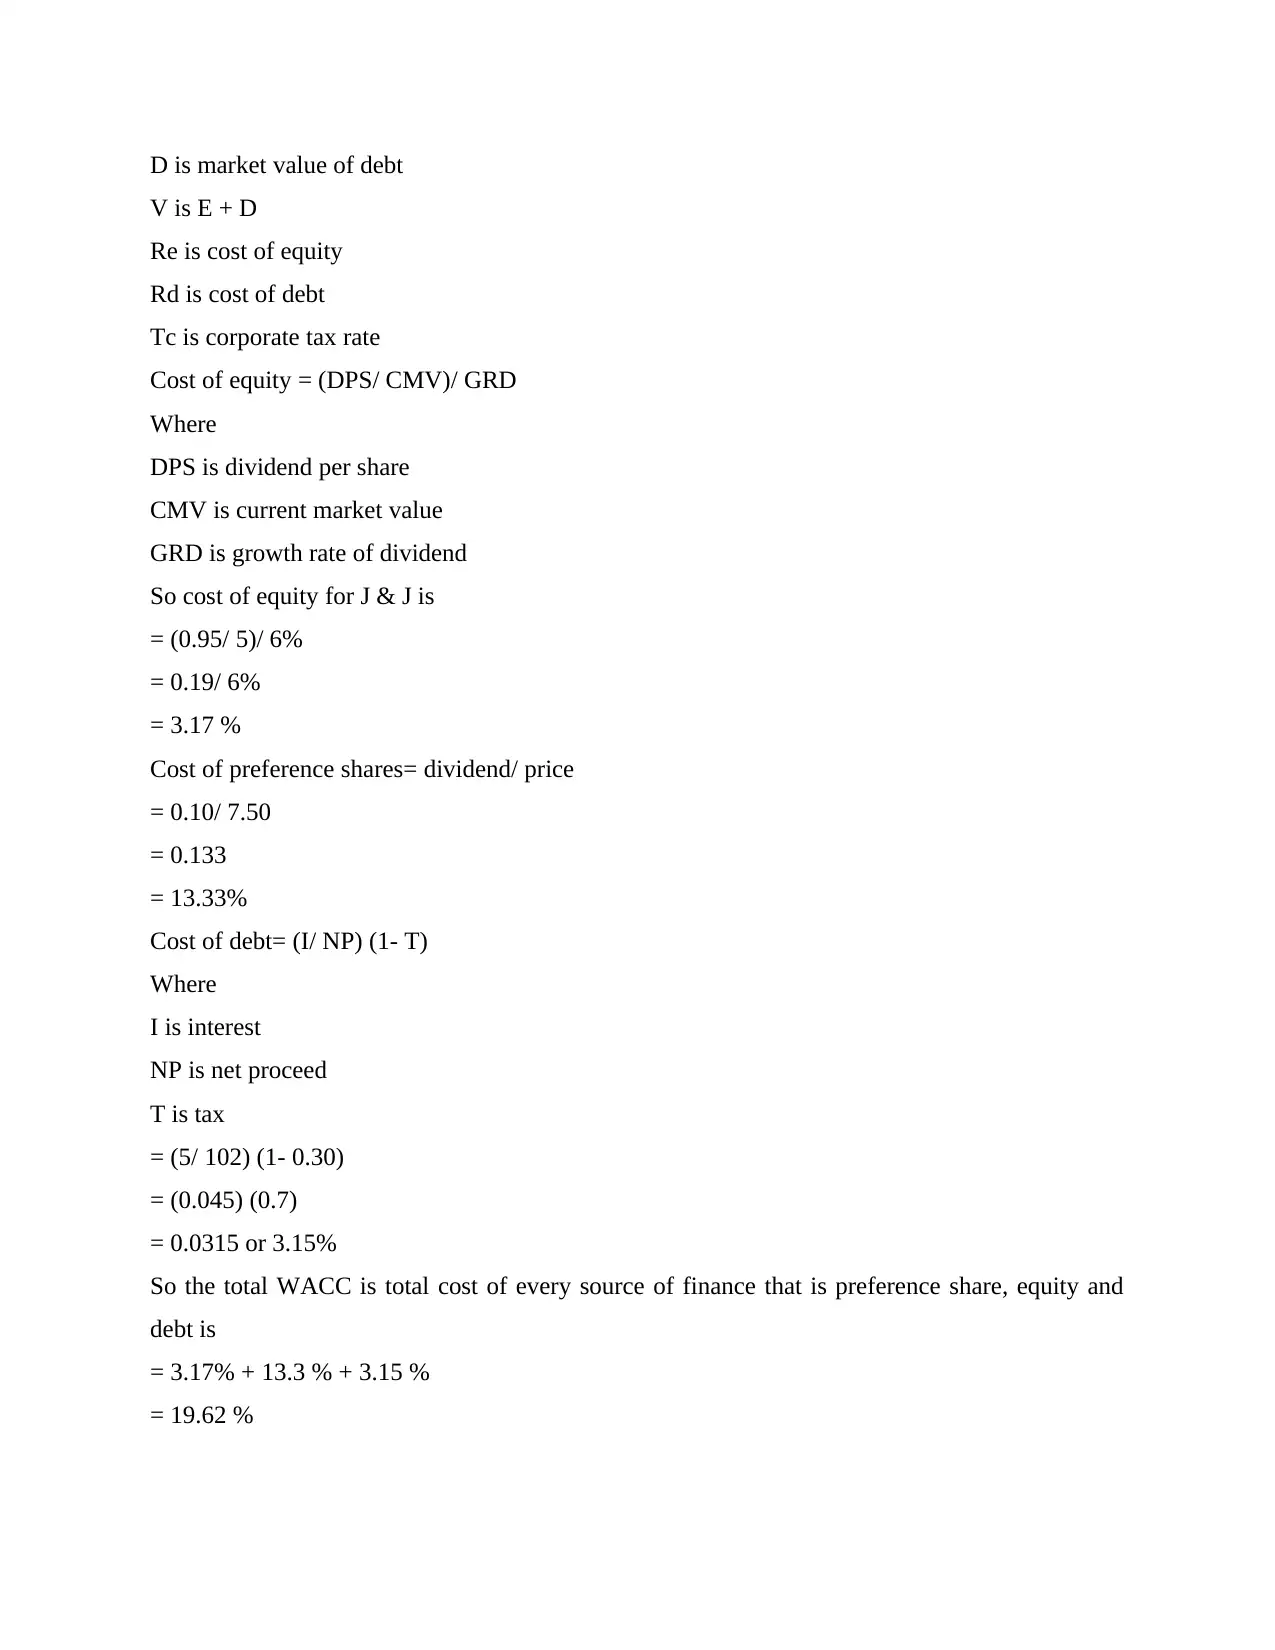
Cost of equity = (DPS/ CMV)/ GRD
Where
DPS is dividend per share
CMV is current market value
GRD is growth rate of dividend
So cost of equity for J & J is
= (0.95/ 5)/ 6%
= 0.19/ 6%
= 3.17 %
Cost of preference shares= dividend/ price
= 0.10/ 7.50
= 0.133
= 13.33%
Cost of debt= (I/ NP) (1- T)
Where
I is interest
NP is net proceed
T is tax
= (5/ 102) (1- 0.30)
= (0.045) (0.7)
= 0.0315 or 3.15%
So the total WACC is total cost of every source of finance that is preference share, equity and
debt is
= 3.17% + 13.3 % + 3.15 %
= 19.62 %
V is E + D
Re is cost of equity
Rd is cost of debt
Tc is corporate tax rate
Cost of equity = (DPS/ CMV)/ GRD
Where
DPS is dividend per share
CMV is current market value
GRD is growth rate of dividend
So cost of equity for J & J is
= (0.95/ 5)/ 6%
= 0.19/ 6%
= 3.17 %
Cost of preference shares= dividend/ price
= 0.10/ 7.50
= 0.133
= 13.33%
Cost of debt= (I/ NP) (1- T)
Where
I is interest
NP is net proceed
T is tax
= (5/ 102) (1- 0.30)
= (0.045) (0.7)
= 0.0315 or 3.15%
So the total WACC is total cost of every source of finance that is preference share, equity and
debt is
= 3.17% + 13.3 % + 3.15 %
= 19.62 %
⊘ This is a preview!⊘
Do you want full access?
Subscribe today to unlock all pages.
Trusted by 1+ million students worldwide
Thus, with the help of the above WACC it is clear that the average cost for the company
for arranging and gathering the finance is 19.62 %. This is particularly because of the reason that
when the company operates then they assume better returns. Hence, for this the weighted average
is being calculated and this implies that the expected return which the shareholders and lender
expect is 19.62 %.
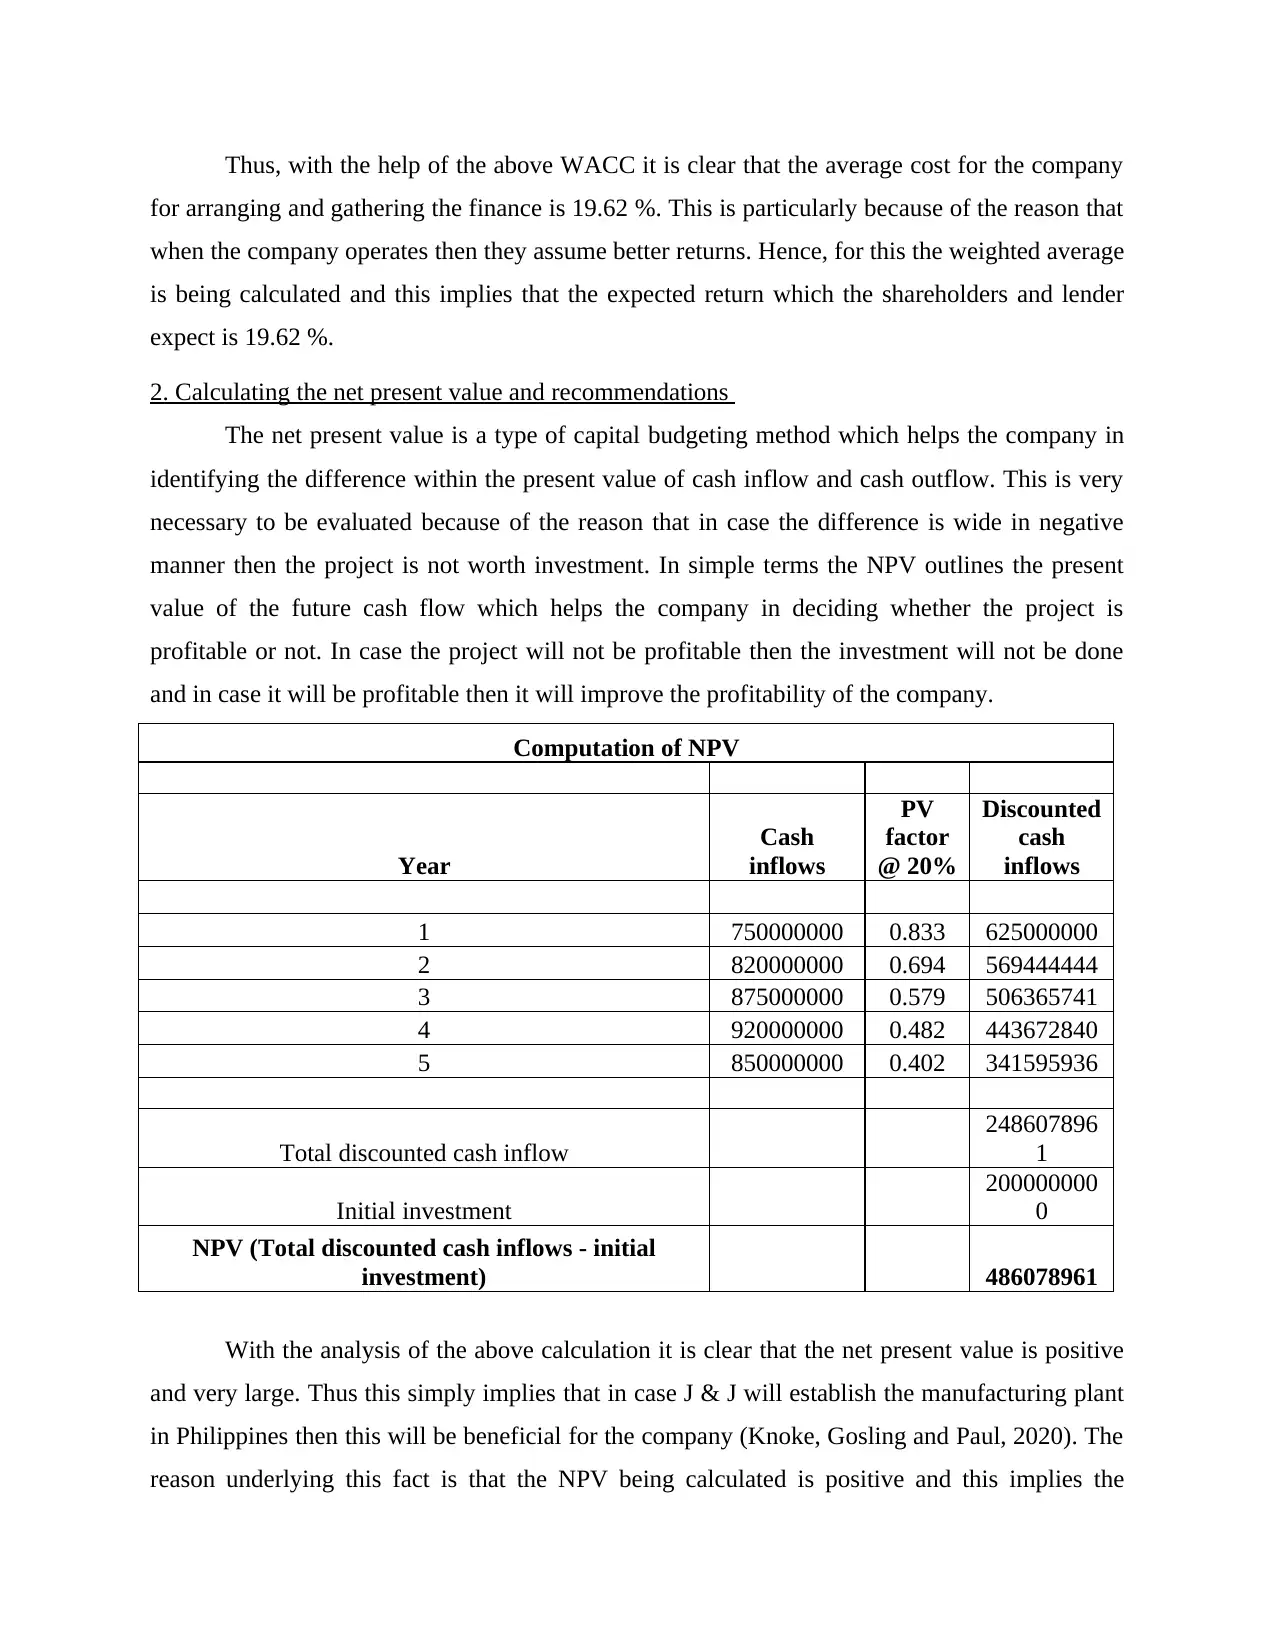
2. Calculating the net present value and recommendations
The net present value is a type of capital budgeting method which helps the company in
identifying the difference within the present value of cash inflow and cash outflow. This is very
necessary to be evaluated because of the reason that in case the difference is wide in negative
manner then the project is not worth investment. In simple terms the NPV outlines the present
value of the future cash flow which helps the company in deciding whether the project is
profitable or not. In case the project will not be profitable then the investment will not be done
and in case it will be profitable then it will improve the profitability of the company.
Computation of NPV
Year
Cash
inflows
PV
factor
@ 20%
Discounted
cash
inflows
1 750000000 0.833 625000000
2 820000000 0.694 569444444
3 875000000 0.579 506365741
4 920000000 0.482 443672840
5 850000000 0.402 341595936
Total discounted cash inflow
248607896
1
Initial investment
200000000
0
NPV (Total discounted cash inflows - initial
investment) 486078961
With the analysis of the above calculation it is clear that the net present value is positive
and very large. Thus this simply implies that in case J & J will establish the manufacturing plant
in Philippines then this will be beneficial for the company (Knoke, Gosling and Paul, 2020). The
reason underlying this fact is that the NPV being calculated is positive and this implies the
for arranging and gathering the finance is 19.62 %. This is particularly because of the reason that
when the company operates then they assume better returns. Hence, for this the weighted average
is being calculated and this implies that the expected return which the shareholders and lender
expect is 19.62 %.
2. Calculating the net present value and recommendations
The net present value is a type of capital budgeting method which helps the company in
identifying the difference within the present value of cash inflow and cash outflow. This is very
necessary to be evaluated because of the reason that in case the difference is wide in negative
manner then the project is not worth investment. In simple terms the NPV outlines the present
value of the future cash flow which helps the company in deciding whether the project is
profitable or not. In case the project will not be profitable then the investment will not be done
and in case it will be profitable then it will improve the profitability of the company.
Computation of NPV
Year
Cash
inflows
PV
factor
@ 20%
Discounted
cash
inflows
1 750000000 0.833 625000000
2 820000000 0.694 569444444
3 875000000 0.579 506365741
4 920000000 0.482 443672840
5 850000000 0.402 341595936
Total discounted cash inflow
248607896
1
Initial investment
200000000
0
NPV (Total discounted cash inflows - initial
investment) 486078961
With the analysis of the above calculation it is clear that the net present value is positive
and very large. Thus this simply implies that in case J & J will establish the manufacturing plant
in Philippines then this will be beneficial for the company (Knoke, Gosling and Paul, 2020). The
reason underlying this fact is that the NPV being calculated is positive and this implies the
Paraphrase This Document
Need a fresh take? Get an instant paraphrase of this document with our AI Paraphraser
project is worth investment. This is also beneficial for the company as the project is beneficial
and highly profitable. Thus, for J & J it is beneficial that they open the establishment in
Philippines.
The recommendation of the use of NPV is that company and potential investor can
analyse that whether they should invest within the project or not. Also, it is recommended to the
company to not invest in the project which is having negative NPV. This is pertaining to the fact
that when the NPV is negative then it implies that in future the project will be providing loss and
this will be affecting the profitability of the business to a great extent.
3. Explaining the four different alternatives to cash dividend as the way of returning value to the
shareholders
The cash dividend is being referred to as the distribution of the funds and the money paid
to the shareholders from the current earning. There are different alternatives for the cash
dividend which company can pay against the cash dividend. These alternatives include the
following-
The first alternative involves share repurchases and within this method the company
purchase its own shares and this results in reduction of the numbers of outstanding
shares. With this company can either retire the shares or even can hold them like a
treasury stock. Thus, the reduction in the shares outstanding outlines that even the profits
will be same the earnings per share will be increasing.
Another alternative to cash dividend is stock split which is a way to issue stock dividend.
Many a times the company can split the shares and this can be treated as an alternate to
the cash dividend. This stock split is being executed with help of issuing new shares in
exchange of the old shares. This splitting of stock does not change the market
capitalisation of the company but only changes the number of shared outstanding.
In addition to this another alternative to cash dividend is the stock dividend. Within this
method, the company provides for an additional shares of stock in exchange of the cash
dividend (What Are the Alternatives to Cash Dividends for Shareholders? 2022). In this
method the company gives more stake to the shareholders other than the existing stake in
order to avoid the cash dividend.

Moreover, another method for avoiding the cash dividend is the qualified dividend. These
qualified dividends are being paid in cash to the shareholders but these are taxed at the
same rate as compared to the long term capital gains.
Hence, with this it can be stated that instead of using the cash dividend the company can
undertake the use of the different alternatives listed above.
qualified dividends are being paid in cash to the shareholders but these are taxed at the
same rate as compared to the long term capital gains.
Hence, with this it can be stated that instead of using the cash dividend the company can
undertake the use of the different alternatives listed above.
⊘ This is a preview!⊘
Do you want full access?
Subscribe today to unlock all pages.
Trusted by 1+ million students worldwide
1 out of 19
Related Documents


Your All-in-One AI-Powered Toolkit for Academic Success.
+13062052269
info@desklib.com
Available 24*7 on WhatsApp / Email
![[object Object]](/_next/static/media/star-bottom.7253800d.svg)
Unlock your academic potential
Copyright © 2020–2026 A2Z Services. All Rights Reserved. Developed and managed by ZUCOL.