Financial Performance Evaluation of Samsung PLC for Strategic Managers
VerifiedAdded on 2020/10/22
|11
|2503
|364
Report
AI Summary
This report provides a comprehensive financial analysis of Samsung PLC. It begins with an introduction to strategic financial management and its application to the company. The report examines Samsung's financial statements, including the income statement and balance sheet, interpreting key data points. It then performs a comparative analysis using various financial ratios, such as liquidity, leverage, and profitability ratios, comparing 2016 and 2017 data to assess trends and performance. The report further delves into strategic decision-making, specifically focusing on the Net Present Value (NPV) of replacing an old machine with a new one, providing calculations and recommendations. Finally, the report concludes with a summary of findings and recommendations for the strategic management of Samsung's finances.

Finance for strategic
manager
manager
Paraphrase This Document
Need a fresh take? Get an instant paraphrase of this document with our AI Paraphraser
Table of Contents
INTRODUCTION...........................................................................................................................1
TASK 1............................................................................................................................................1
Covered in PPT...........................................................................................................................1
TASK 2 ...........................................................................................................................................1
2.1 Interpretation of financial statements of Samsung PLC.......................................................1
2.2 Comparative analysis of financial data using Ratio analysis for Samsung PLC..................2
TASK 3 ...........................................................................................................................................4
Covered in leaflet........................................................................................................................4
TASK 4 ...........................................................................................................................................4
3.2 Providing advice for the best course of action......................................................................4
CONCLUSION................................................................................................................................6
REFERENCES................................................................................................................................7
APPENDIX......................................................................................................................................8
INTRODUCTION
Finance is the life blood of any organisation without finance no organisation can survive
in the market. Strategic managers use strategic financial management system to form best
strategies to utilize finance within the organisation. Strategic financial management refers to the
planning and controlling the usage of financial resources of the organisation. Samsung PLC is a
manufacturing company, it needs to properly maintain the financial resources.
In this project report, sources of financial data, formulation of business strategy, analysis
of financial statements, strategic decision making, cash flows etc. are discussed to analyse the
financial position of Samsung PLC. Ratio analysis is used to determine the profitability of the
organisation. Financial statements show the actual financial condition of the company, that helps
the managers to form best business strategy (Basak and Makarov, 2014).
TASK 1
Covered in PPT
TASK 2
2.1 Interpretation of financial statements of Samsung PLC
Interpretation of financial statements refers to analysis and determination of the
importance of the financial statement data which helps in forecasting for future earnings, debt
maturities, ability to pay interest, profitability of current and long term etc. It also includes many
processes like analysis, arrangement, establishing relationship between present facts and give
conclusion on the basis of that facts. The company involves first three steps in growth and
summarisation of financial and operating information as well as in the preparation of financial
statements. These steps are analysis of each and every transaction for determination of accounts
which is to be debited or credited and their measurement and variation of amount involved in
these transactions, recording of those transaction in the journals, summarised in ledgers and
preparation of an account and last in preparation of financial statements (Gorbenko and Malenko,
2014).
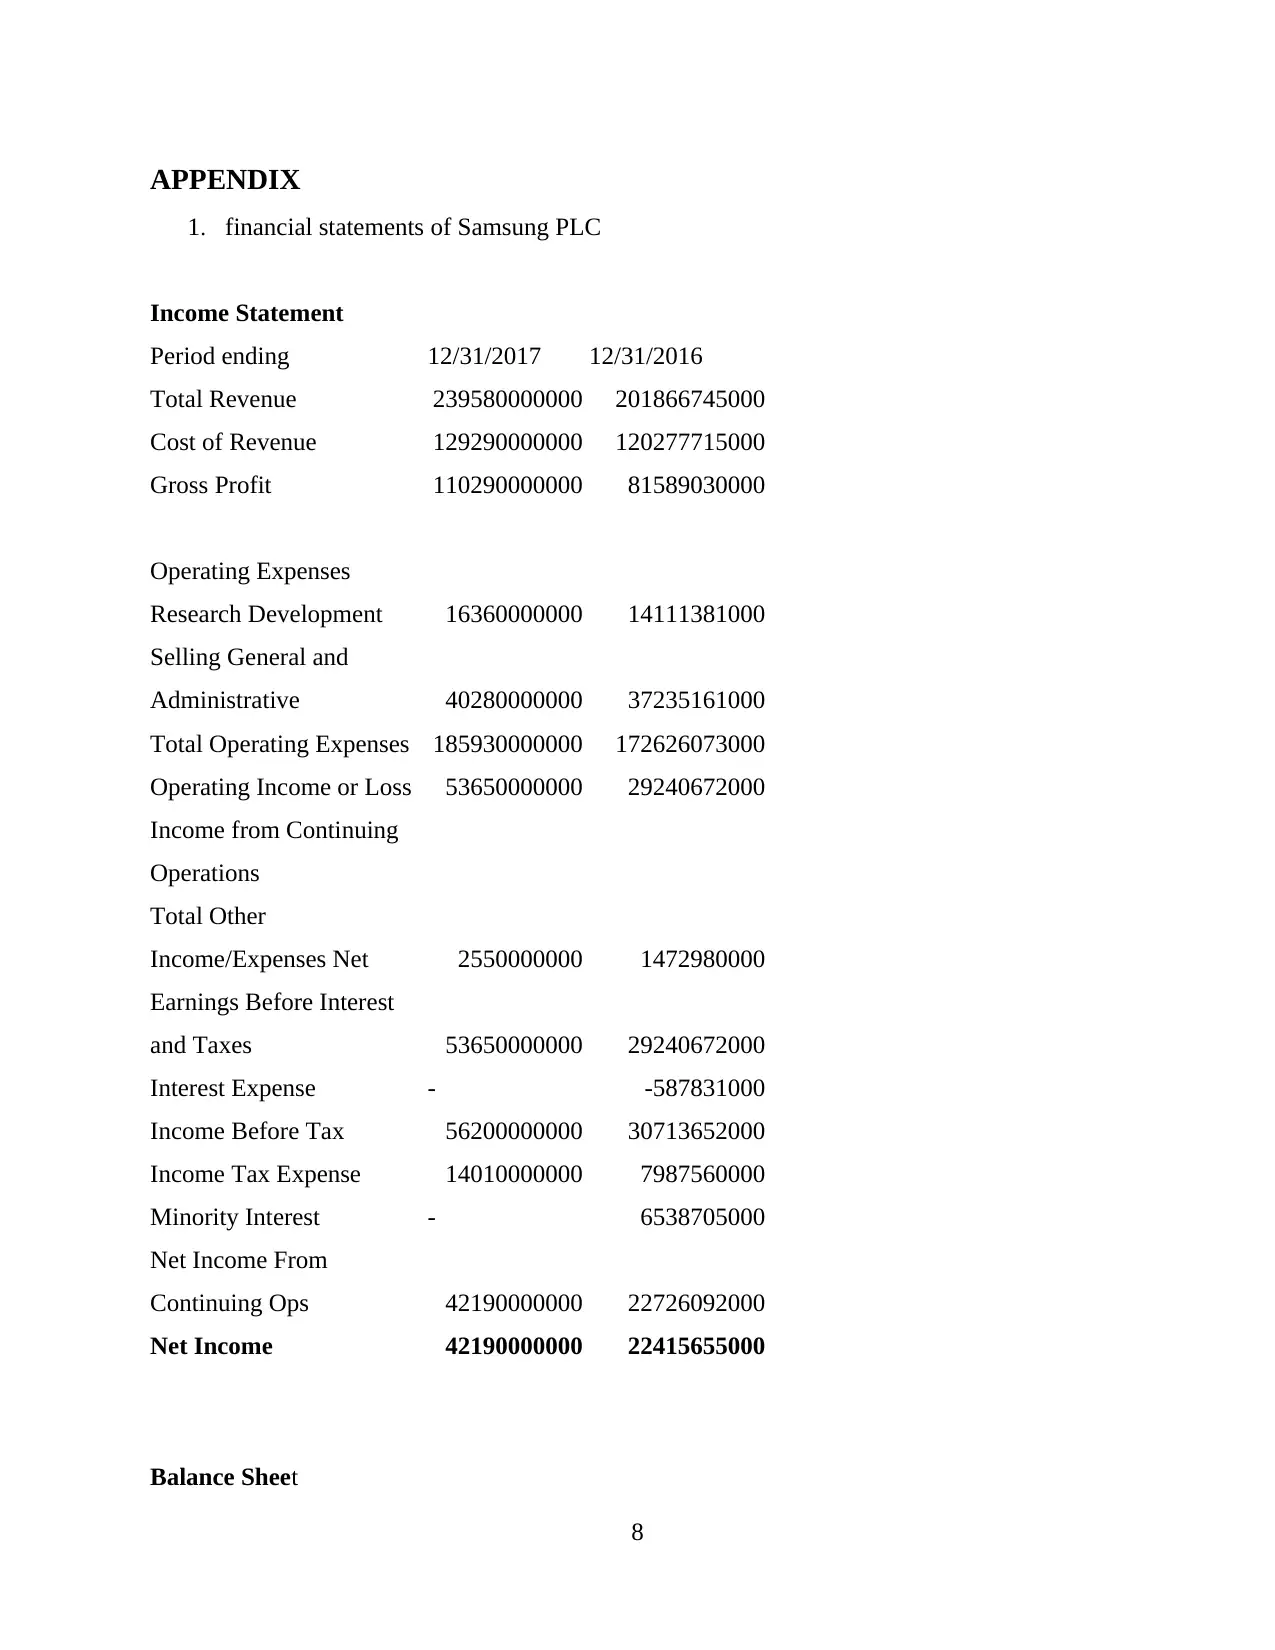
Income statement: It is one out of three financial statement which investors need to
understand in order to analysis profitability and company's future growth which plays a
important role in deciding whether to invest or not. As per appendix 1. Samsung's total revenue
1
Finance is the life blood of any organisation without finance no organisation can survive
in the market. Strategic managers use strategic financial management system to form best
strategies to utilize finance within the organisation. Strategic financial management refers to the
planning and controlling the usage of financial resources of the organisation. Samsung PLC is a
manufacturing company, it needs to properly maintain the financial resources.
In this project report, sources of financial data, formulation of business strategy, analysis
of financial statements, strategic decision making, cash flows etc. are discussed to analyse the
financial position of Samsung PLC. Ratio analysis is used to determine the profitability of the
organisation. Financial statements show the actual financial condition of the company, that helps
the managers to form best business strategy (Basak and Makarov, 2014).
TASK 1
Covered in PPT
TASK 2
2.1 Interpretation of financial statements of Samsung PLC
Interpretation of financial statements refers to analysis and determination of the
importance of the financial statement data which helps in forecasting for future earnings, debt
maturities, ability to pay interest, profitability of current and long term etc. It also includes many
processes like analysis, arrangement, establishing relationship between present facts and give
conclusion on the basis of that facts. The company involves first three steps in growth and
summarisation of financial and operating information as well as in the preparation of financial
statements. These steps are analysis of each and every transaction for determination of accounts
which is to be debited or credited and their measurement and variation of amount involved in
these transactions, recording of those transaction in the journals, summarised in ledgers and
preparation of an account and last in preparation of financial statements (Gorbenko and Malenko,
2014).
Income statement: It is one out of three financial statement which investors need to
understand in order to analysis profitability and company's future growth which plays a
important role in deciding whether to invest or not. As per appendix 1. Samsung's total revenue
1
⊘ This is a preview!⊘
Do you want full access?
Subscribe today to unlock all pages.
Trusted by 1+ million students worldwide
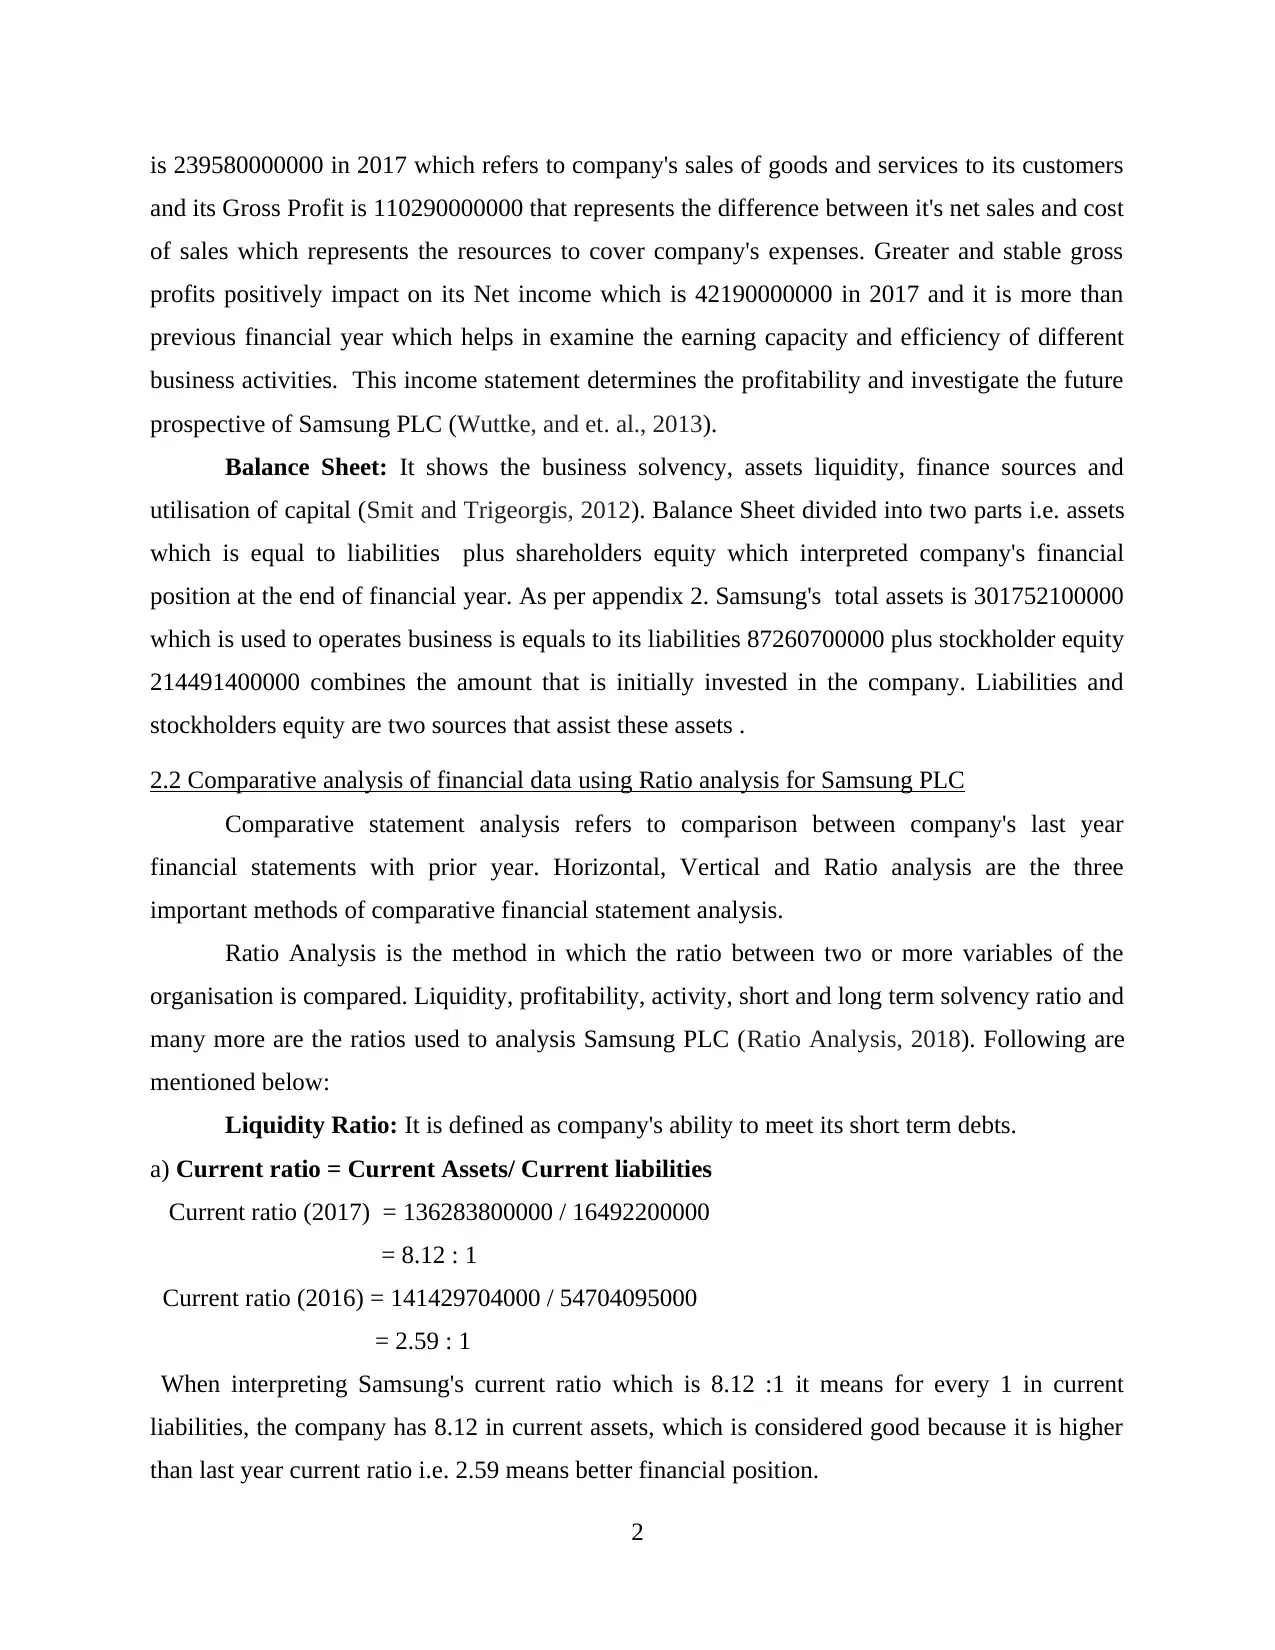
is 239580000000 in 2017 which refers to company's sales of goods and services to its customers
and its Gross Profit is 110290000000 that represents the difference between it's net sales and cost
of sales which represents the resources to cover company's expenses. Greater and stable gross
profits positively impact on its Net income which is 42190000000 in 2017 and it is more than
previous financial year which helps in examine the earning capacity and efficiency of different
business activities. This income statement determines the profitability and investigate the future
prospective of Samsung PLC (Wuttke, and et. al., 2013).
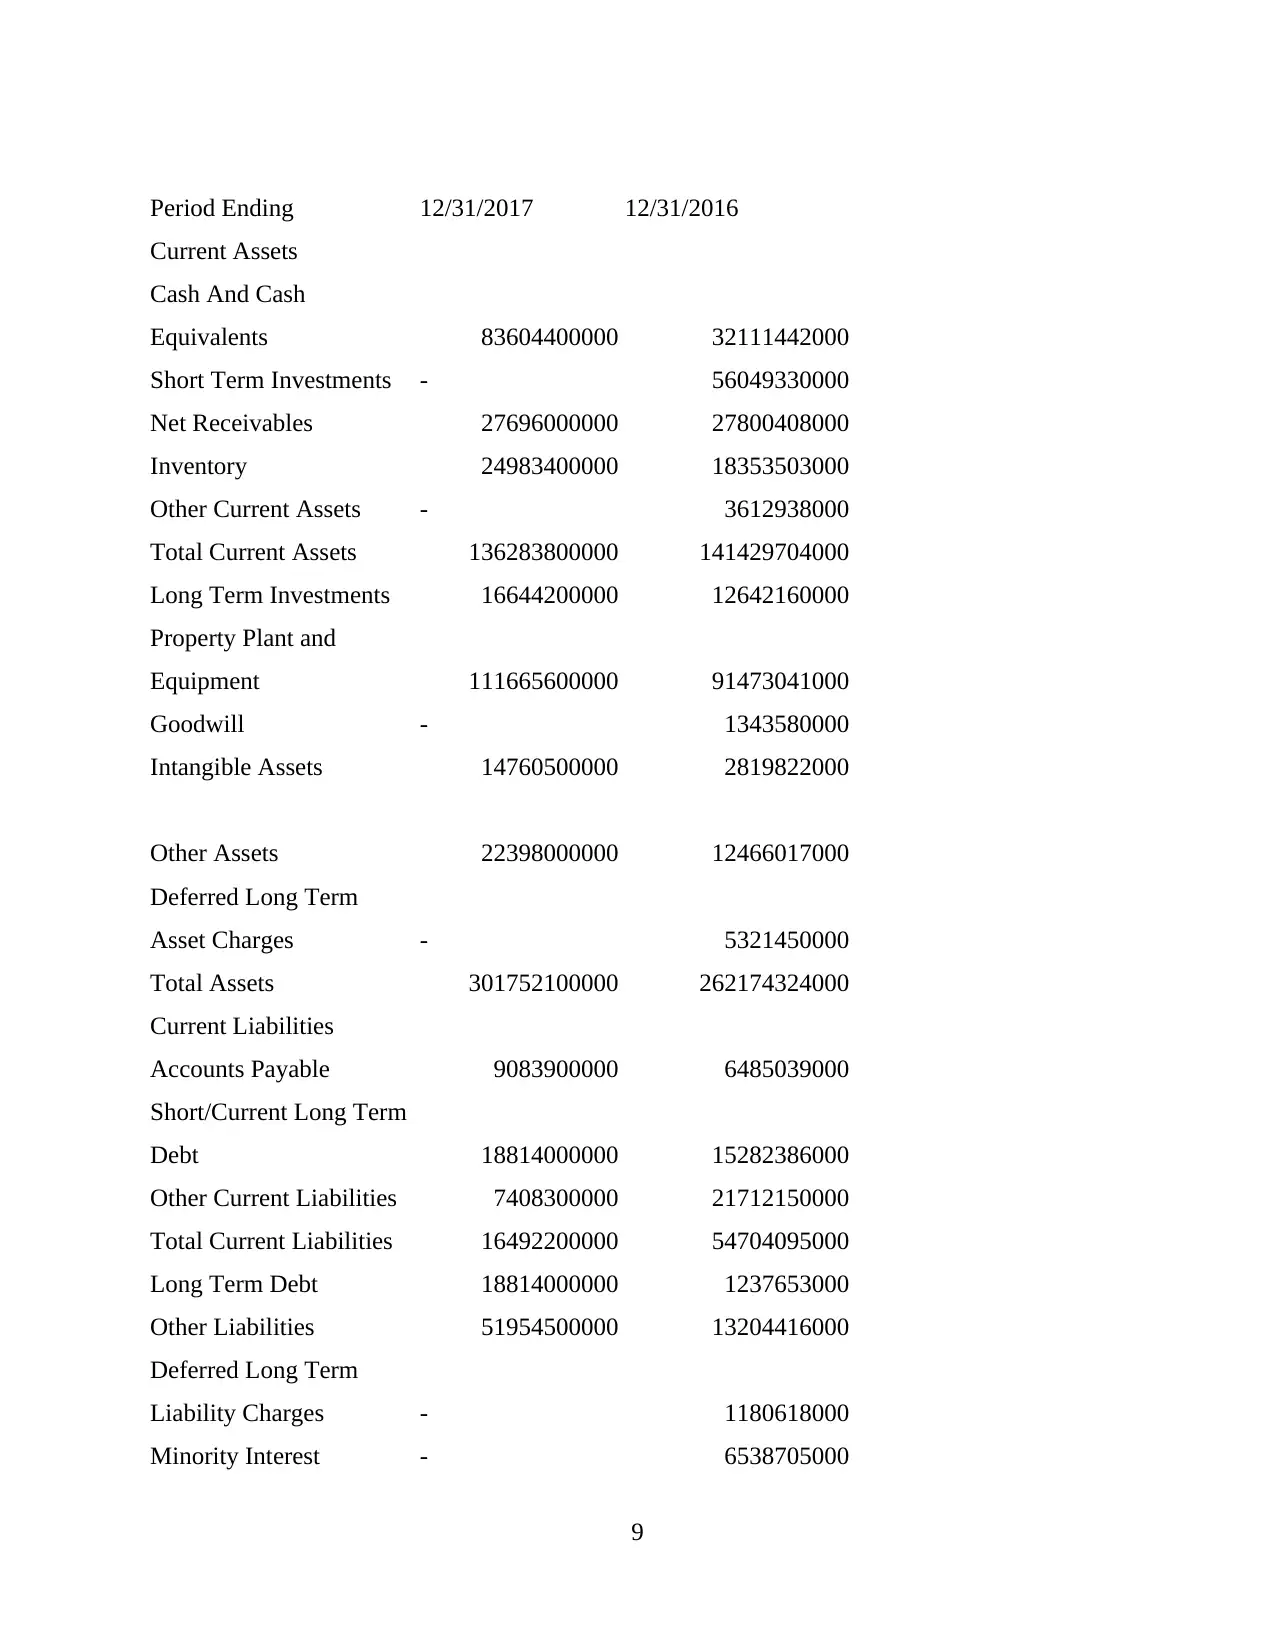
Balance Sheet: It shows the business solvency, assets liquidity, finance sources and
utilisation of capital (Smit and Trigeorgis, 2012). Balance Sheet divided into two parts i.e. assets
which is equal to liabilities plus shareholders equity which interpreted company's financial
position at the end of financial year. As per appendix 2. Samsung's total assets is 301752100000
which is used to operates business is equals to its liabilities 87260700000 plus stockholder equity
214491400000 combines the amount that is initially invested in the company. Liabilities and
stockholders equity are two sources that assist these assets .
2.2 Comparative analysis of financial data using Ratio analysis for Samsung PLC
Comparative statement analysis refers to comparison between company's last year
financial statements with prior year. Horizontal, Vertical and Ratio analysis are the three
important methods of comparative financial statement analysis.
Ratio Analysis is the method in which the ratio between two or more variables of the
organisation is compared. Liquidity, profitability, activity, short and long term solvency ratio and
many more are the ratios used to analysis Samsung PLC (Ratio Analysis, 2018). Following are
mentioned below:
Liquidity Ratio: It is defined as company's ability to meet its short term debts.
a) Current ratio = Current Assets/ Current liabilities
Current ratio (2017) = 136283800000 / 16492200000
= 8.12 : 1
Current ratio (2016) = 141429704000 / 54704095000
= 2.59 : 1
When interpreting Samsung's current ratio which is 8.12 :1 it means for every 1 in current
liabilities, the company has 8.12 in current assets, which is considered good because it is higher
than last year current ratio i.e. 2.59 means better financial position.
2
and its Gross Profit is 110290000000 that represents the difference between it's net sales and cost
of sales which represents the resources to cover company's expenses. Greater and stable gross
profits positively impact on its Net income which is 42190000000 in 2017 and it is more than
previous financial year which helps in examine the earning capacity and efficiency of different
business activities. This income statement determines the profitability and investigate the future
prospective of Samsung PLC (Wuttke, and et. al., 2013).
Balance Sheet: It shows the business solvency, assets liquidity, finance sources and
utilisation of capital (Smit and Trigeorgis, 2012). Balance Sheet divided into two parts i.e. assets
which is equal to liabilities plus shareholders equity which interpreted company's financial
position at the end of financial year. As per appendix 2. Samsung's total assets is 301752100000
which is used to operates business is equals to its liabilities 87260700000 plus stockholder equity
214491400000 combines the amount that is initially invested in the company. Liabilities and
stockholders equity are two sources that assist these assets .
2.2 Comparative analysis of financial data using Ratio analysis for Samsung PLC
Comparative statement analysis refers to comparison between company's last year
financial statements with prior year. Horizontal, Vertical and Ratio analysis are the three
important methods of comparative financial statement analysis.
Ratio Analysis is the method in which the ratio between two or more variables of the
organisation is compared. Liquidity, profitability, activity, short and long term solvency ratio and
many more are the ratios used to analysis Samsung PLC (Ratio Analysis, 2018). Following are
mentioned below:
Liquidity Ratio: It is defined as company's ability to meet its short term debts.
a) Current ratio = Current Assets/ Current liabilities
Current ratio (2017) = 136283800000 / 16492200000
= 8.12 : 1
Current ratio (2016) = 141429704000 / 54704095000
= 2.59 : 1
When interpreting Samsung's current ratio which is 8.12 :1 it means for every 1 in current
liabilities, the company has 8.12 in current assets, which is considered good because it is higher
than last year current ratio i.e. 2.59 means better financial position.
2
Paraphrase This Document
Need a fresh take? Get an instant paraphrase of this document with our AI Paraphraser
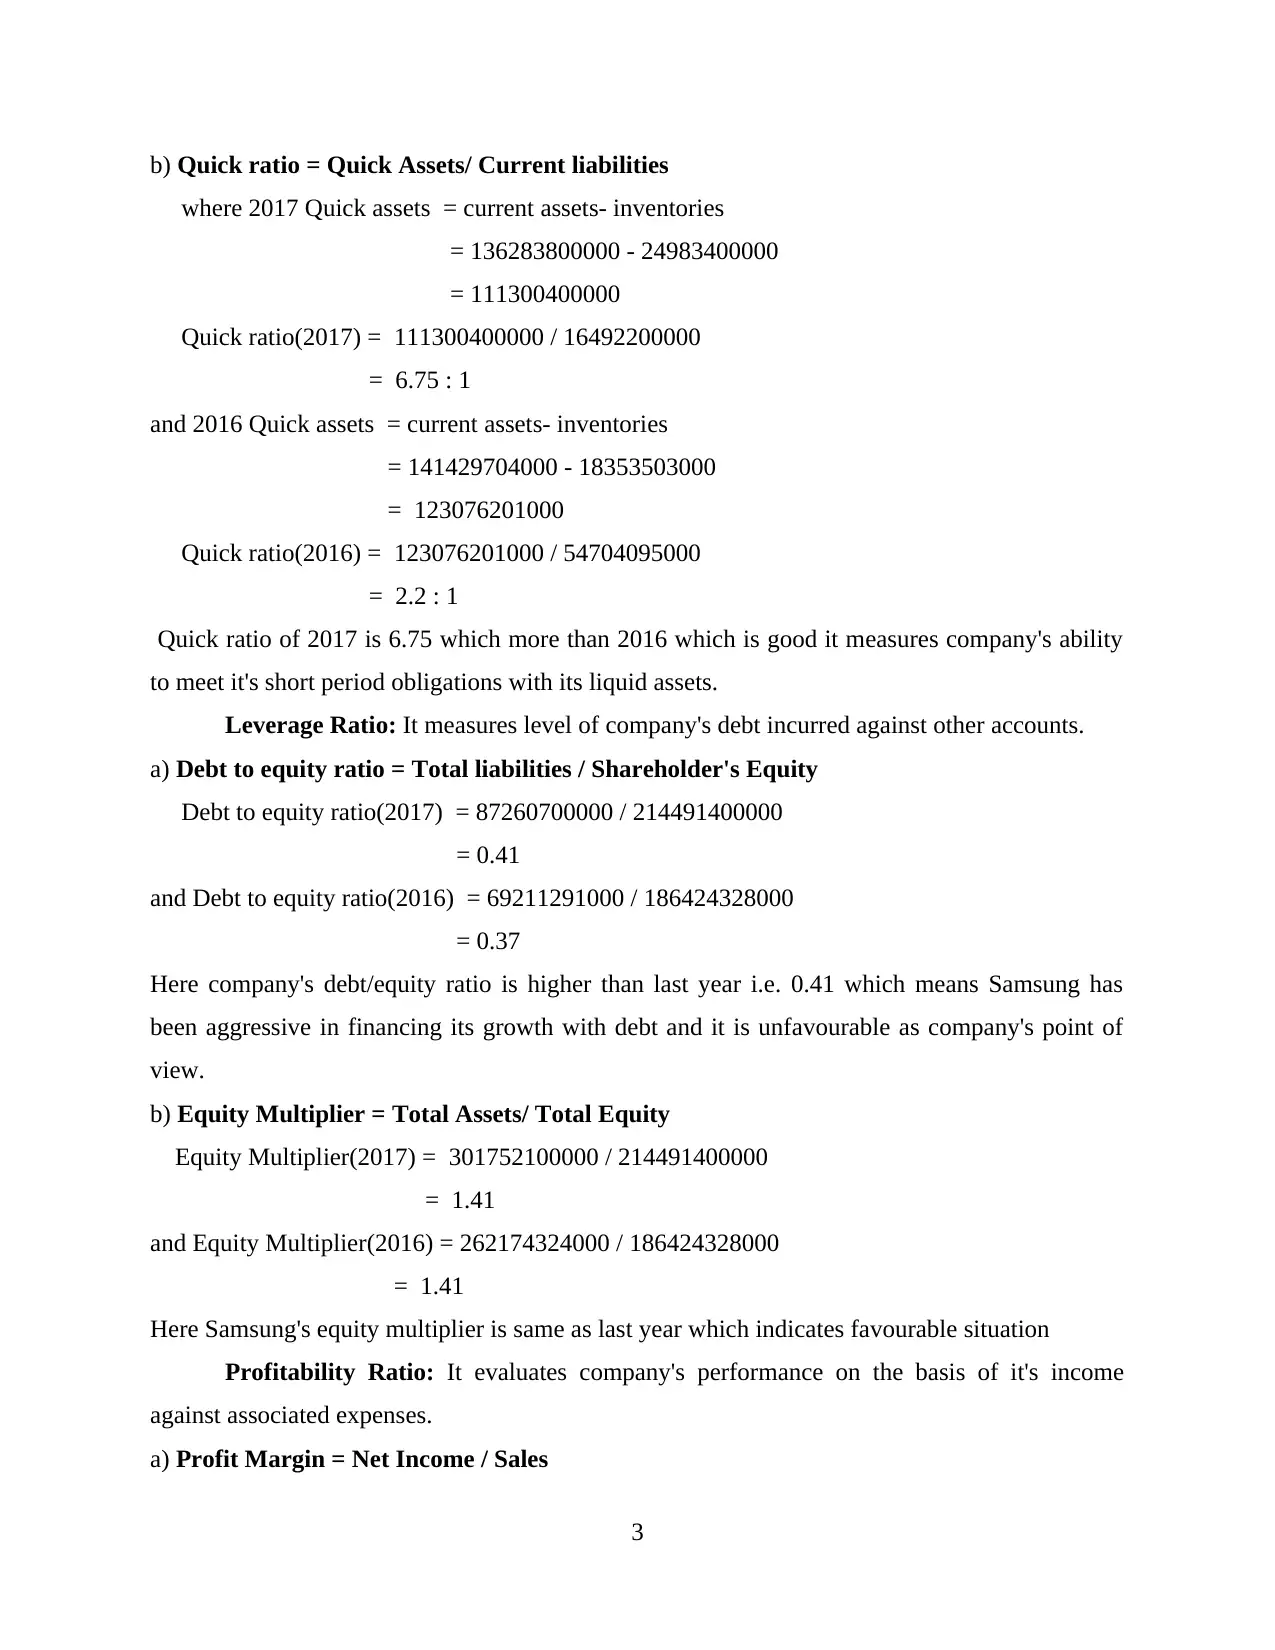
b) Quick ratio = Quick Assets/ Current liabilities
where 2017 Quick assets = current assets- inventories
= 136283800000 - 24983400000
= 111300400000
Quick ratio(2017) = 111300400000 / 16492200000
= 6.75 : 1
and 2016 Quick assets = current assets- inventories
= 141429704000 - 18353503000
= 123076201000
Quick ratio(2016) = 123076201000 / 54704095000
= 2.2 : 1
Quick ratio of 2017 is 6.75 which more than 2016 which is good it measures company's ability
to meet it's short period obligations with its liquid assets.
Leverage Ratio: It measures level of company's debt incurred against other accounts.
a) Debt to equity ratio = Total liabilities / Shareholder's Equity
Debt to equity ratio(2017) = 87260700000 / 214491400000
= 0.41
and Debt to equity ratio(2016) = 69211291000 / 186424328000
= 0.37
Here company's debt/equity ratio is higher than last year i.e. 0.41 which means Samsung has
been aggressive in financing its growth with debt and it is unfavourable as company's point of
view.
b) Equity Multiplier = Total Assets/ Total Equity
Equity Multiplier(2017) = 301752100000 / 214491400000
= 1.41
and Equity Multiplier(2016) = 262174324000 / 186424328000
= 1.41
Here Samsung's equity multiplier is same as last year which indicates favourable situation
Profitability Ratio: It evaluates company's performance on the basis of it's income
against associated expenses.
a) Profit Margin = Net Income / Sales
3
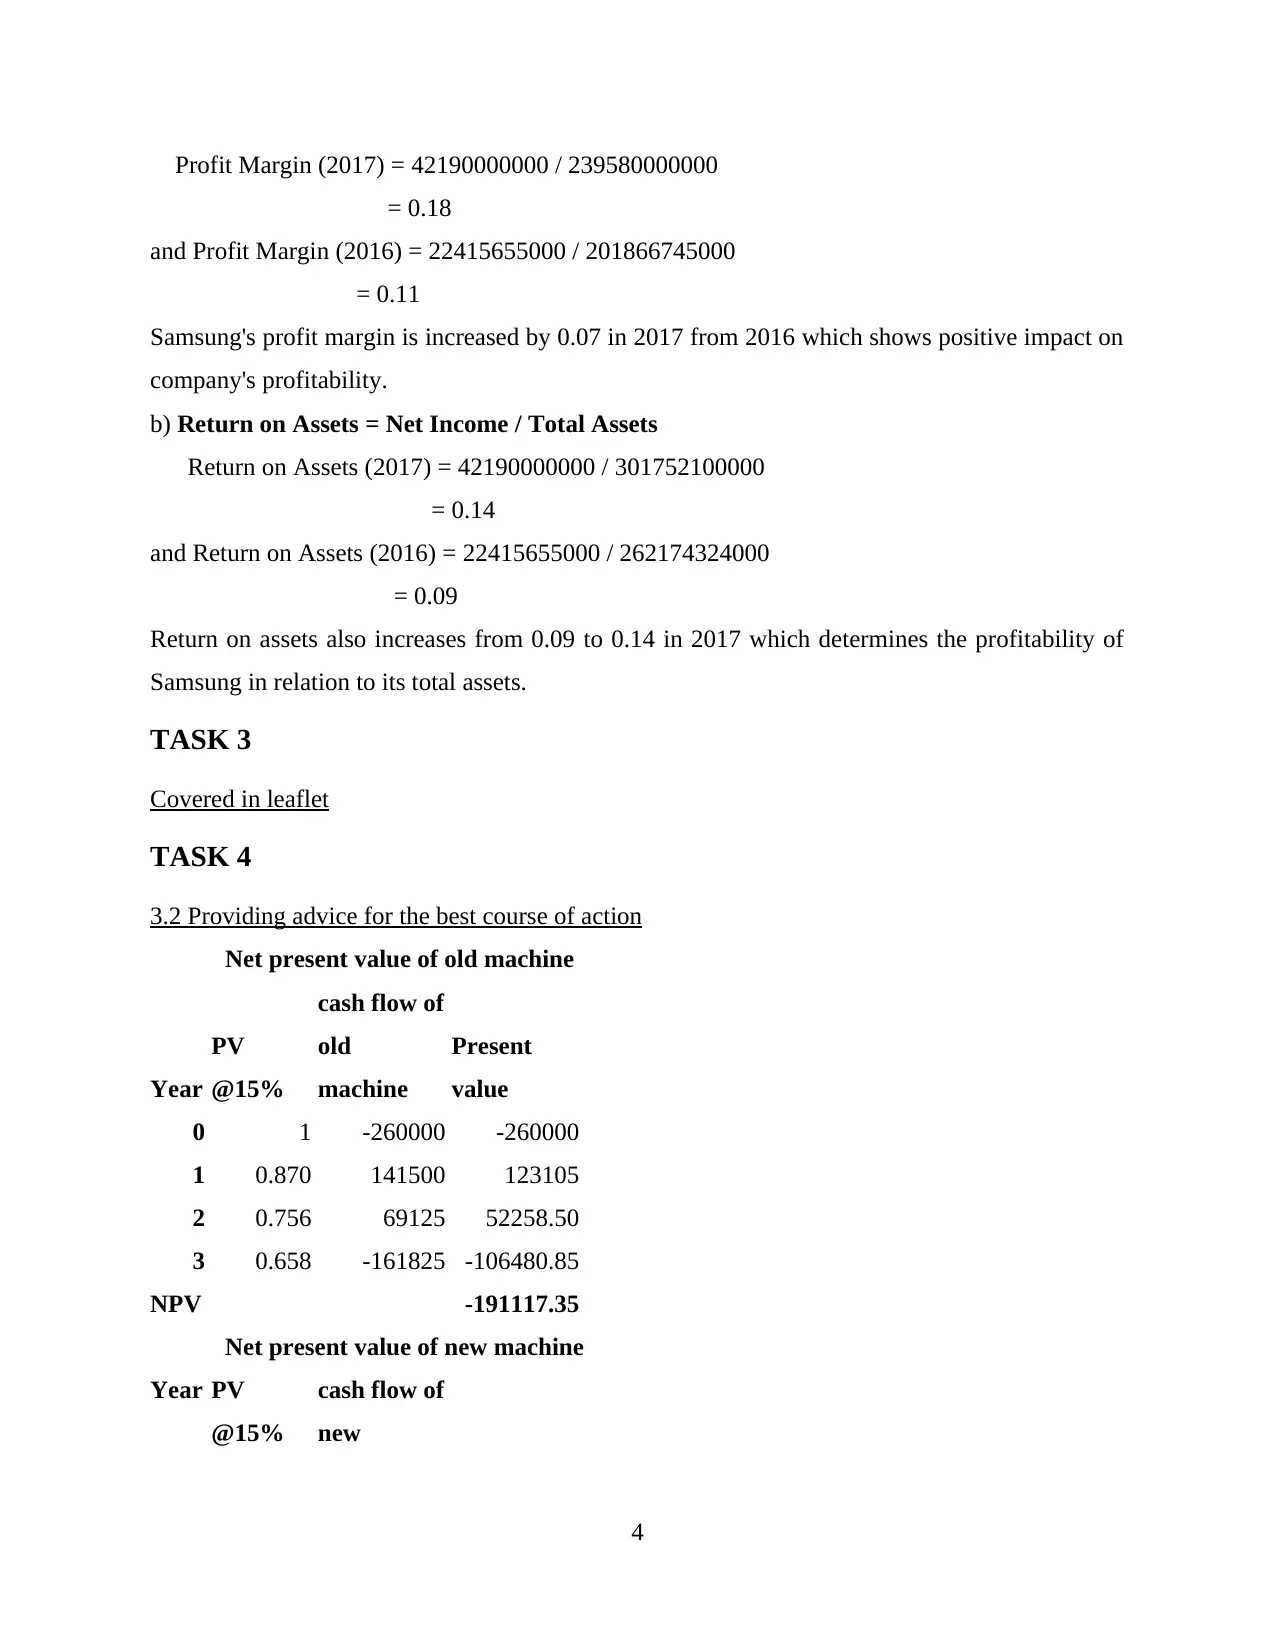
Profit Margin (2017) = 42190000000 / 239580000000
= 0.18
and Profit Margin (2016) = 22415655000 / 201866745000
= 0.11
Samsung's profit margin is increased by 0.07 in 2017 from 2016 which shows positive impact on
company's profitability.
b) Return on Assets = Net Income / Total Assets
Return on Assets (2017) = 42190000000 / 301752100000
= 0.14
and Return on Assets (2016) = 22415655000 / 262174324000
= 0.09
Return on assets also increases from 0.09 to 0.14 in 2017 which determines the profitability of
Samsung in relation to its total assets.
TASK 3
Covered in leaflet
TASK 4
3.2 Providing advice for the best course of action
Net present value of old machine
Year
PV
@15%
cash flow of
old
machine
Present
value
0 1 -260000 -260000
1 0.870 141500 123105
2 0.756 69125 52258.50
3 0.658 -161825 -106480.85
NPV -191117.35
Net present value of new machine
Year PV
@15%
cash flow of
new
4
⊘ This is a preview!⊘
Do you want full access?
Subscribe today to unlock all pages.
Trusted by 1+ million students worldwide
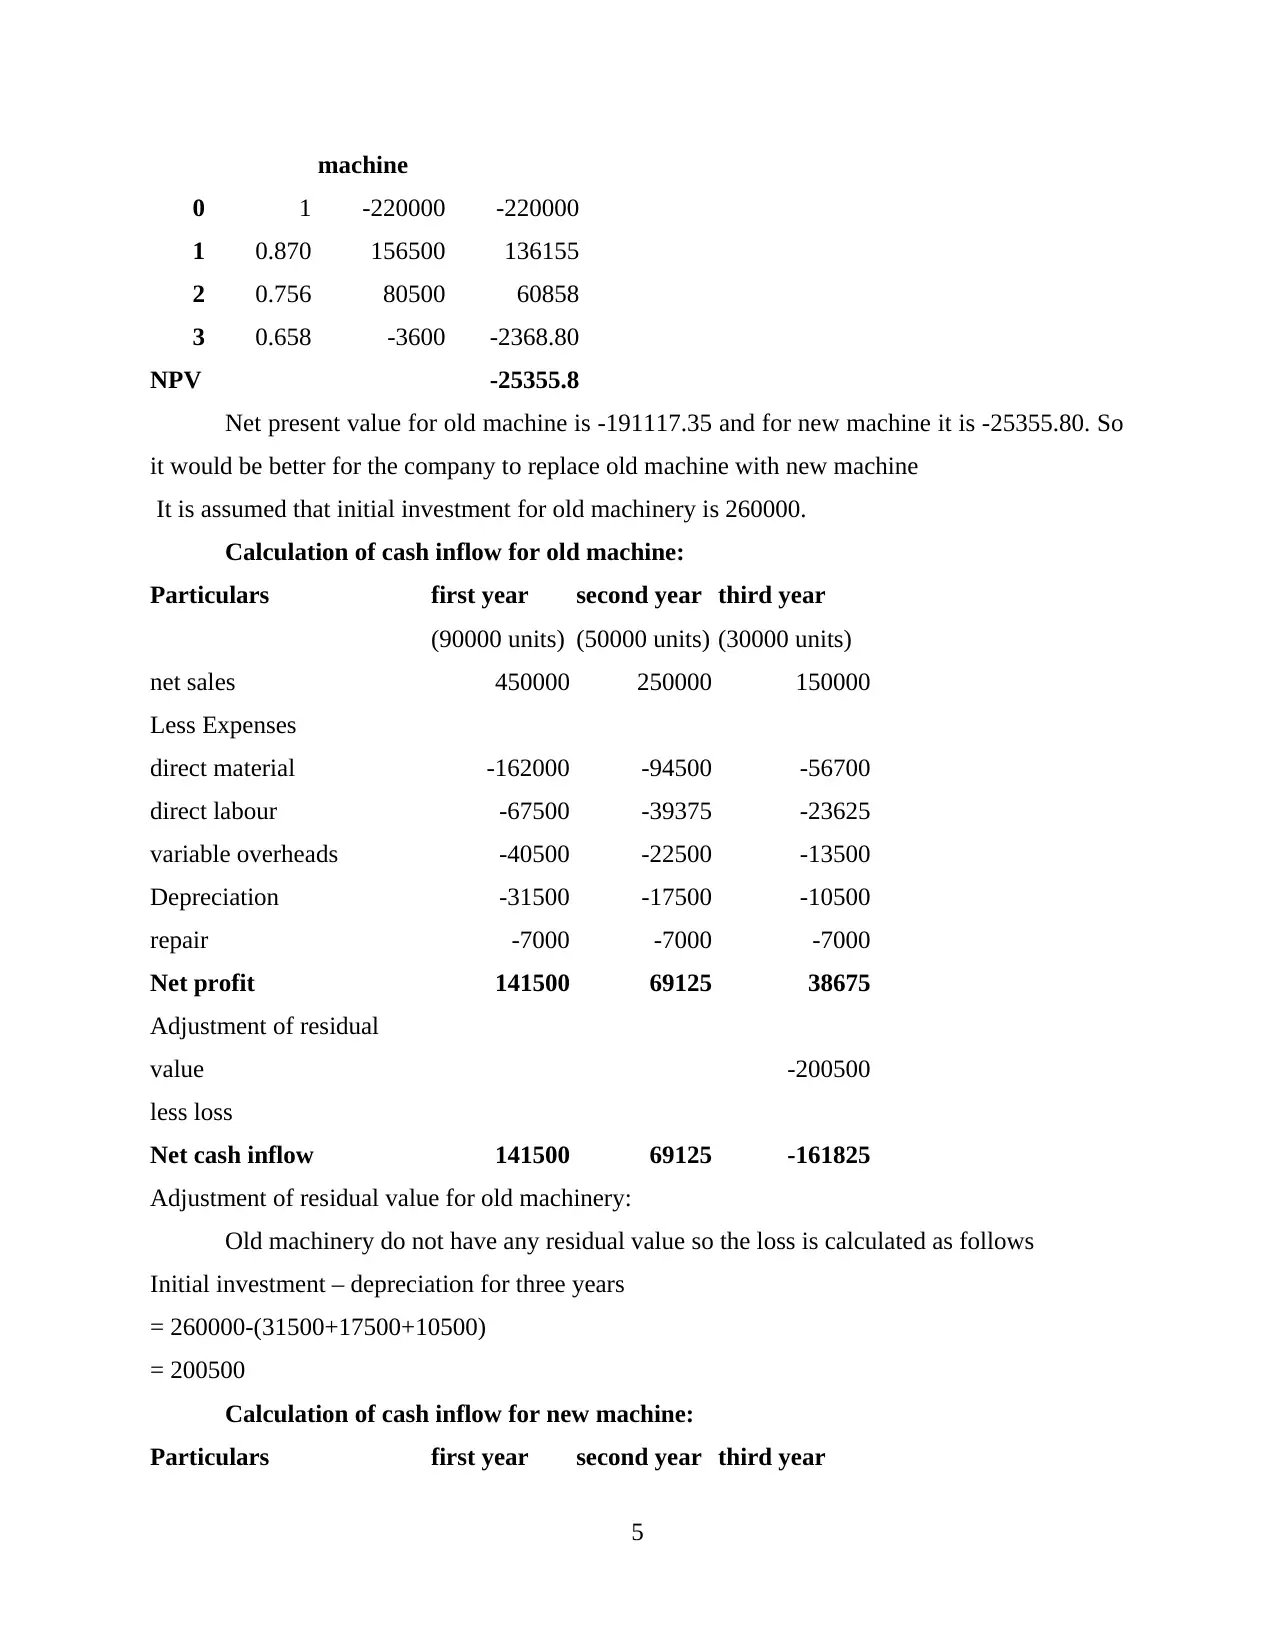
machine
0 1 -220000 -220000
1 0.870 156500 136155
2 0.756 80500 60858
3 0.658 -3600 -2368.80
NPV -25355.8
Net present value for old machine is -191117.35 and for new machine it is -25355.80. So
it would be better for the company to replace old machine with new machine
It is assumed that initial investment for old machinery is 260000.
Calculation of cash inflow for old machine:
Particulars first year second year third year
(90000 units) (50000 units) (30000 units)
net sales 450000 250000 150000
Less Expenses
direct material -162000 -94500 -56700
direct labour -67500 -39375 -23625
variable overheads -40500 -22500 -13500
Depreciation -31500 -17500 -10500
repair -7000 -7000 -7000
Net profit 141500 69125 38675
Adjustment of residual
value -200500
less loss
Net cash inflow 141500 69125 -161825
Adjustment of residual value for old machinery:
Old machinery do not have any residual value so the loss is calculated as follows
Initial investment – depreciation for three years
= 260000-(31500+17500+10500)
= 200500
Calculation of cash inflow for new machine:
Particulars first year second year third year
5
Paraphrase This Document
Need a fresh take? Get an instant paraphrase of this document with our AI Paraphraser
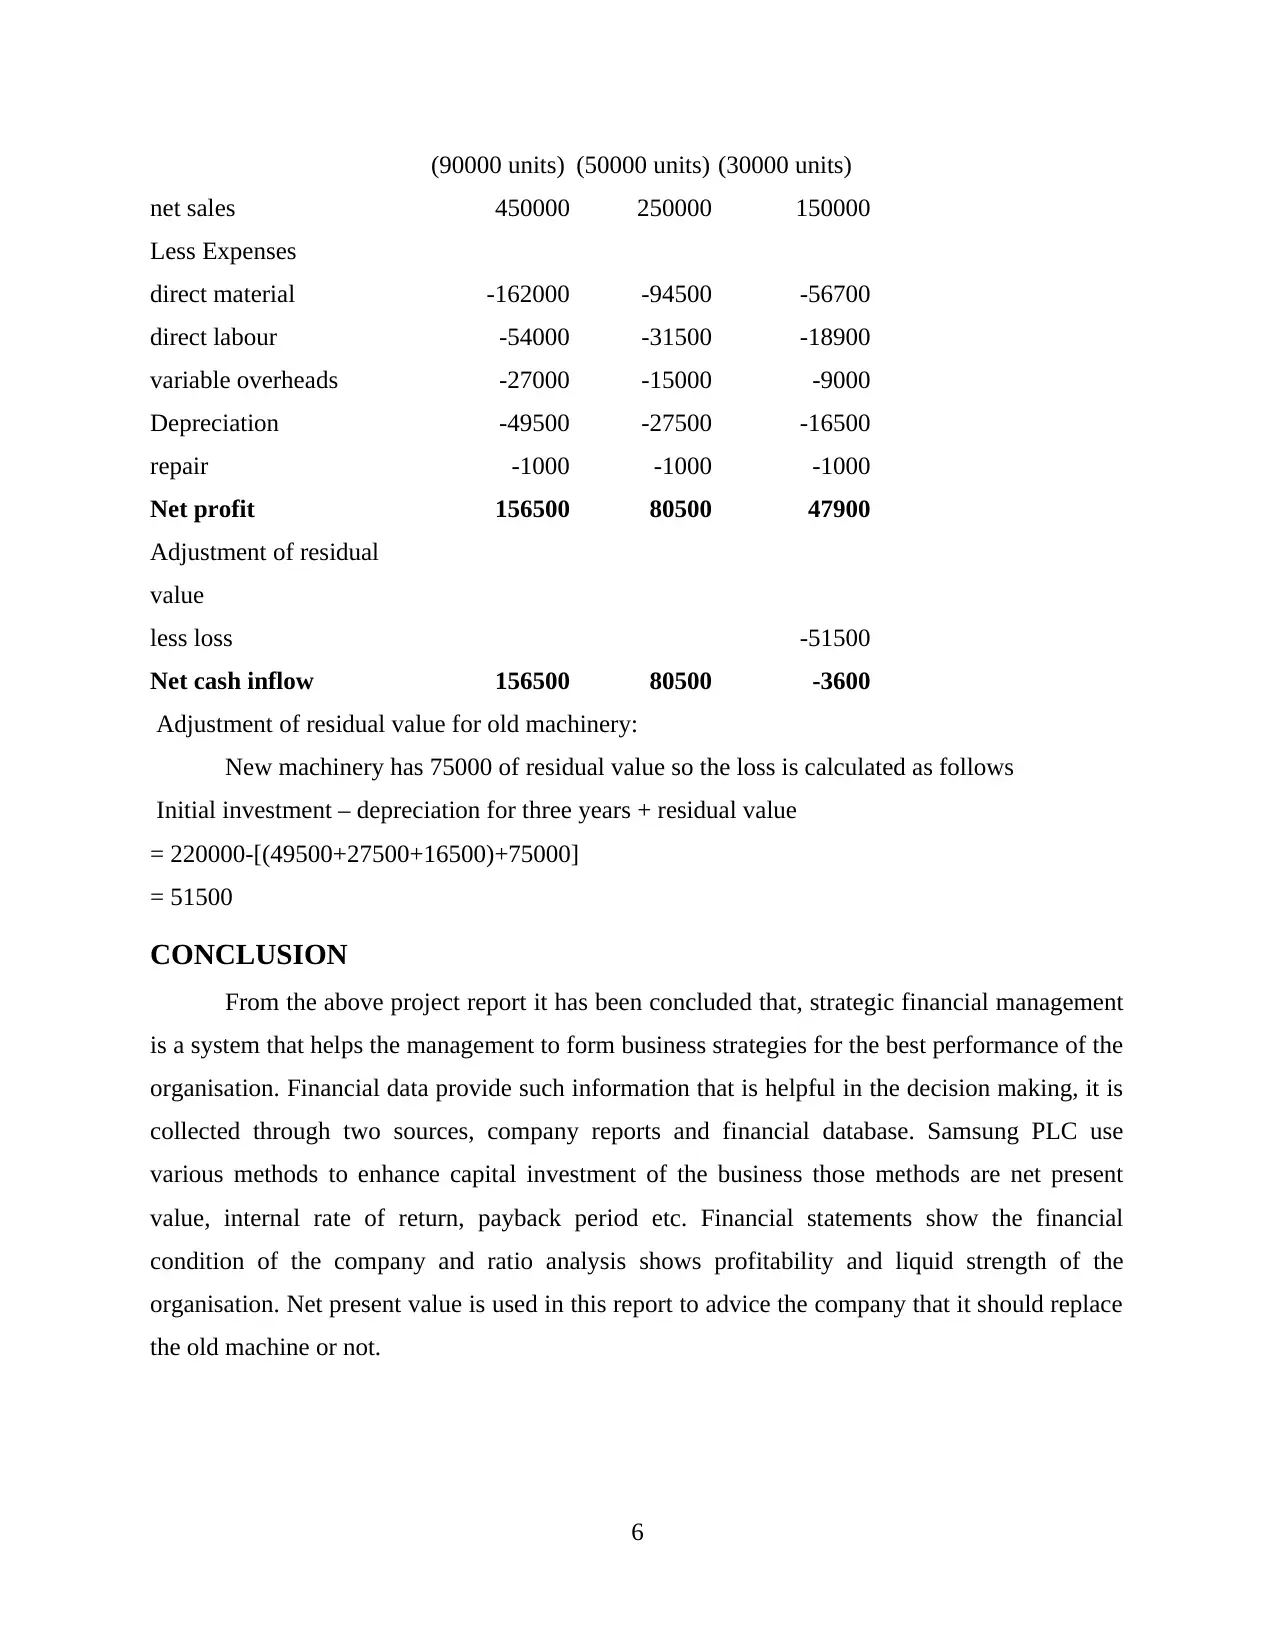
(90000 units) (50000 units) (30000 units)
net sales 450000 250000 150000
Less Expenses
direct material -162000 -94500 -56700
direct labour -54000 -31500 -18900
variable overheads -27000 -15000 -9000
Depreciation -49500 -27500 -16500
repair -1000 -1000 -1000
Net profit 156500 80500 47900
Adjustment of residual
value
less loss -51500
Net cash inflow 156500 80500 -3600
Adjustment of residual value for old machinery:
New machinery has 75000 of residual value so the loss is calculated as follows
Initial investment – depreciation for three years + residual value
= 220000-[(49500+27500+16500)+75000]
= 51500
CONCLUSION
From the above project report it has been concluded that, strategic financial management
is a system that helps the management to form business strategies for the best performance of the
organisation. Financial data provide such information that is helpful in the decision making, it is
collected through two sources, company reports and financial database. Samsung PLC use
various methods to enhance capital investment of the business those methods are net present
value, internal rate of return, payback period etc. Financial statements show the financial
condition of the company and ratio analysis shows profitability and liquid strength of the
organisation. Net present value is used in this report to advice the company that it should replace
the old machine or not.
6
REFERENCES
Books and Journals:
Basak, S. and Makarov, D., 2014. Strategic asset allocation in money management. The Journal
of Finance. 69(1). pp.179-217.
Boonstra, A., 2013. How do top managers support strategic information system projects and why
do they sometimes withhold this support?. International Journal of Project
Management. 31(4). pp.498-512.
Cheng, B., Ioannou, I. and Serafeim, G., 2014. Corporate social responsibility and access to
finance. Strategic management journal. 35(1). pp.1-23.
Cheng, M. M. and Humphreys, K. A., 2012. The differential improvement effects of the strategy
map and scorecard perspectives on managers' strategic judgments. The Accounting
Review. 87(3). pp.899-924.
Dewulf, G., Blanken, A. and Bult-Spiering, M., 2012. Strategic issues in public-private
partnerships. London, England: Wiley-Blackwell.
Gorbenko, A. S. and Malenko, A., 2014. Strategic and financial bidders in takeover auctions. The
Journal of Finance. 69(6). pp.2513-2555.
Smit, H. T. and Trigeorgis, L., 2012. Strategic investment: Real options and games. Princeton
University Press.
Ward, K., 2012. Strategic management accounting. Routledge.
Wheelen, T. L. and Hunger, J. D., 2011. Concepts in strategic management and business policy.
Pearson Education India.
Wuttke, D. A., and et. al., 2013. Managing the innovation adoption of supply chain finance—
Empirical evidence from six European case studies. Journal of Business Logistics.
34(2). pp.148-166.
Online
Ratio Analysis, 2018. [Online]. Available through: <www.accountingtools.com/articles/ratio-
analysis.html>
7
⊘ This is a preview!⊘
Do you want full access?
Subscribe today to unlock all pages.
Trusted by 1+ million students worldwide
APPENDIX
1. financial statements of Samsung PLC
Income Statement
Period ending 12/31/2017 12/31/2016
Total Revenue 239580000000 201866745000
Cost of Revenue 129290000000 120277715000
Gross Profit 110290000000 81589030000
Operating Expenses
Research Development 16360000000 14111381000
Selling General and
Administrative 40280000000 37235161000
Total Operating Expenses 185930000000 172626073000
Operating Income or Loss 53650000000 29240672000
Income from Continuing
Operations
Total Other
Income/Expenses Net 2550000000 1472980000
Earnings Before Interest
and Taxes 53650000000 29240672000
Interest Expense - -587831000
Income Before Tax 56200000000 30713652000
Income Tax Expense 14010000000 7987560000
Minority Interest - 6538705000
Net Income From
Continuing Ops 42190000000 22726092000
Net Income 42190000000 22415655000
Balance Sheet
8
Paraphrase This Document
Need a fresh take? Get an instant paraphrase of this document with our AI Paraphraser
Period Ending 12/31/2017 12/31/2016
Current Assets
Cash And Cash
Equivalents 83604400000 32111442000
Short Term Investments - 56049330000
Net Receivables 27696000000 27800408000
Inventory 24983400000 18353503000
Other Current Assets - 3612938000
Total Current Assets 136283800000 141429704000
Long Term Investments 16644200000 12642160000
Property Plant and
Equipment 111665600000 91473041000
Goodwill - 1343580000
Intangible Assets 14760500000 2819822000
Other Assets 22398000000 12466017000
Deferred Long Term
Asset Charges - 5321450000
Total Assets 301752100000 262174324000
Current Liabilities
Accounts Payable 9083900000 6485039000
Short/Current Long Term
Debt 18814000000 15282386000
Other Current Liabilities 7408300000 21712150000
Total Current Liabilities 16492200000 54704095000
Long Term Debt 18814000000 1237653000
Other Liabilities 51954500000 13204416000
Deferred Long Term
Liability Charges - 1180618000
Minority Interest - 6538705000
9
1 out of 11
Related Documents


Your All-in-One AI-Powered Toolkit for Academic Success.
+13062052269
info@desklib.com
Available 24*7 on WhatsApp / Email
![[object Object]](/_next/static/media/star-bottom.7253800d.svg)
Unlock your academic potential
Copyright © 2020–2026 A2Z Services. All Rights Reserved. Developed and managed by ZUCOL.