Financial Analysis of Samsung Plc: A Strategic Management Report
VerifiedAdded on 2023/01/19
|19
|4931
|50
Report
AI Summary
This report provides a detailed financial analysis of Samsung Plc, focusing on strategic financial management. It begins by evaluating the sources of financial data used to understand Samsung's business strategy, including net cash available, revenue growth, and profitability ratios, and discusses the need for such data in formulating business strategies, such as vision and mission statements, assessing financial requirements, setting targets, managing risk, and reporting to owners. The report then explores risks associated with financial decisions, like market risk, credit risk, and liquidity risk, and reviews techniques for assessing investment proposals, including net present value, payback period, accounting rate of return, and internal rate of return. Finally, the report interprets Samsung Plc's financial statements, including the income statement, through ratio analysis, providing insights into its financial position and profitability, and comparing data from 2017 and 2018.

Finance for Strategic
Managers
Managers
Paraphrase This Document
Need a fresh take? Get an instant paraphrase of this document with our AI Paraphraser
Contents
INTRODUCTION
Strategic financial management is a process by which company manages its finances to
by doing business operations in efficient and effective manner to succeed in enhancing its
profitability. Strategic managers of an business organisation shall required to have full
knowledge related to financial management which is essential for long term survivability of the
company. For better understanding of this topic, a company named Samsung Plc is given for
better understanding which is engaged in providing various electronic innovative products such
as smart phones, television and so on. Evaluation of financial statements of Samsung Plc is also
given in such report to asses the current viability of the company and making recommendations
based on such interpretation.
TASK 1
Evaluation of the sources of financial data that are utilised for knowing the business strategy:
Financial information of an company like Samsung Plc are very useful for it key
stakeholders to measuring the its business strategy which a company has made for its future
business operations. Such information is also help the company in evaluating its business
processes in finding that whether it perform well in achieve its goals and objectives (Gliedt and
Hoicka, 2015). some of the financial data that are helpful in identify its business strategy which
is as follows:
Net cash available: Any company's net cash may gives information about its
financial fitness. More cash in hand in an organisation indicates that company has
utilising its financial resources in efficient and effective manner to generate more
cash for new investments (Ward, 2012).
Revenue Growth: A good growth in company's revenue shall indicate that it has
performed its business operations in good manner and it indicates that company has
good scope in future and company has capability to succeed in the long run.
Profitability ratios: It ratios provides the information about operational efficiency of
an company and provides the areas where company is required to take some
corrective actions. It may be helpful for various key stakeholders in knowing the
various information about the company's business strategy because it takes various
aspects of its operations such sales, profits in the given accounting period.
1
⊘ This is a preview!⊘
Do you want full access?
Subscribe today to unlock all pages.
Trusted by 1+ million students worldwide
Apart from it, there are some other source of finance such as:
Internal source-
Internal accounting system - Internal control, as established in accounting and auditing, is
a process to ensure the achievement of the goals of an entity in terms of organizational
effectiveness and performance, accurate financial reporting, and adherence with laws,
regulations. By use of it information regards to financial transactions can be gathered.
Payroll system - A payroll system covers anything related to worker salary and work tax
filing. It involves recording hours, estimating salaries, paying taxes and other
exemptions, copying and checking, and paying government jobs taxes This can be helpful
in order to assessing key financial information about outflow of funds.
External source-
Suppliers- This can be defined as a group supplying goods or services. A manufacturer
can be differentiated from a contractor or subcontractor which typically provides
technical feedback to deliverables. In the context of providing financial information, the
suppliers play a key role. It is so because they have detailed information regards to
companies' paying efficiency and their revenues.
Budget- It is also a key source of providing financial information. This is so because
under it estimated amount of income and expenditures is included and users can gather
needed monetary informations.
Assessment for need of financial data and information for formulation of business strategy:
In any business organisation, financial data is very beneficial as they provide the valuable
information about the such company to the management and helps the management staff in in
formulation of its key business strategy. Herein, below some financial information is mentioned
that is as follows:
Profitability - Profitability is an ability to use its assets to generate income that covers its
costs In certain words, it is the capacity of an organization to make profits from its
activities. It can be beneficial in order to formulate the business strategies because
managers can assess key information about proportion of total income and costs.
Cash flow- Cash flow is the net spending of cash equivalents to and from a company. The
ability of a corporation to build shareholder value at the most fundamental level is
defined by its ability to produce positive cash flows or, more precisely, optimize lengthy-
2
Paraphrase This Document
Need a fresh take? Get an instant paraphrase of this document with our AI Paraphraser
term free cash flow. It can also be useful for assessing information about cash position
which may contribute in preparation of business strategies.
Cost projection- Cost Projection is a large investment statement for development projects,
implementation and maintenance to set up the venture strategy and render the project
operational. Financial investment includes all acquisition expenses, rentals, all applicable
taxes and equipment acquisitions, technology, learning and tutoring programs, internal /
existing project tools, deployment. It can be useful for preparation of business strategies
because by use of this, managers can analyse future need of funds.
Some of need of financial data in formulation process are as follows:
Vision statement: Creation of this statement of a company requires the information and
data related to its financial data because by assessing the current financial position of an
organisation, it may be able to make its vision statement (Stead and Stead, 2014).
Therefore, it is said that such statement acts as a road map that help the company in
guiding the management staff related to its internal works. But on the other hands,
preparation of such is not so much easy because company has to take a balanced view
that includes both forward looking view along with providing ideal state while creating
vision statement.
Mission statement: This statement may be defined as company's long term plans which it
wants to fulfil in log run. For establishing the mission statements of an company, various
financial information such net cash available in present, its profitability position etc.
(Hill, Jones and Schilling, 2014). In other words, it may be said that it is a statement
which defines about organisation's philosophy, identify and their future plans. This will
assist it in formulating its goals and objectives to provide direction for its day to day
business activities.
Assessing financial requirements- The financial information is useful in order to analyse
need of financial resources. It may become possible because by help of available
informations, managers can make accurate projection of financial resources.
Setting and meeting targets- In addition, financial informations are needed in order to
setting and meeting financial targets. This is so because users can analyse about
efficiency of business and in accordance of that set financial targets.
3
Managing risk- Along with the above mentioned role, the financial informations are
useful for managing overall risks in an effective manner. This is so because, the managers
can prepare effective strategies and operations in order to beat their competitors which
leads to lower volume of risk.
Reporting to owners- As well as the financial information is required for making aware to
business owners regards to actual position. For this purpose there are different kinds of
financial statements such as income statement, balance sheet etc.
Internal and external needs- The financial information is needed for internal and external
purpose. Such as in the internal perspective, this is needed for managers, employees in
order to make effective plans and policies. As well as for external users like suppliers,
customers the financial information is needed.
Analysis of risks related to financial business decision:
These include various type of risks when an organisation its finance related decisions,
some of are as follows:
Market risk: It relates with risk when a company wants to change the conditions related
to market place from where it compete for its business. In other words, market from
where an organisation sells its products plays a significant role, if market is neutral for
its new product then it is said that company has no power to influence such market.
Credit risk: It is risk which is related to its customer when a company decide to change
its credit period. Company shall required to assess all the possible effects of such change
and according take decision. If by decreasing the credit period given to customer,
consumers of such company has starts decreases, then it is said that company has not do
it and this is called credit risk
Liquidity risk: This is related to company's liquidity position, this mean that company
shall required to manage its working capital requirements in such a manner that it does
not effect in adverse manner (Balogun, Bartunek and Do, 2015).
Strategic risk - Strategic risk is the danger that a corporation may be at risk of failing or
intervening in business decisions. Strategic risk is a significant determinant the value of
a company, especially if the company suffers a steep decline in a short time.
4
⊘ This is a preview!⊘
Do you want full access?
Subscribe today to unlock all pages.
Trusted by 1+ million students worldwide
Compliance risk- Compliance risk is the vulnerability of a company to legal fines,
monetary penalties, and material failure if it fails to comply with business rules and
regulations, policies, or recommended best practices.
Operational risk- Operational risk is "the risk of a value change due to the fact which
potential losses, sustained due to inadequate or ineffective internal systems, people and
structures or external events, vary from the potential losses"
Risk modelling - Modelling financial risk is use of structured econometric methods to
assess a financial portfolio's cumulative risk. Risk analysis is one of many sub-goals in
the wider field of financial analysis.
Review of techniques that may be used in assessing investment proposals:
There are various methods available for evaluating the company's several capital
expenditure projects, these are as follows:
Net present value: NPV technique is utilised by the company for measuring
various investment projects of the company by calculating the present cash
inflows and present cash outflows. Thereafter, PV of cash outflows are deducted
from P.V of net cash inflow (Andreu, Ortiz and Sarto, 2014).
Payback period: in simple words, payback period is the period which an
investment projects shall take to recover the cost of its initial investment. If
payback period is less than investment proposal total period, then it is said that the
proposed project is viable.
Accounting rate of return: Another name of such technique is average rate which
is utilised for taking various long term investing decisions. Main unique feature of
this method is that such method uses the expected net operating income but all
other methods gives more more emphasis on the cash flows.
Internal rate of return: Such technique assists the companies in evaluating the
profitability level of potential investments. If such return is more than cost of
capital of proposed investment then it is said that investment proposal is viable
and company shall require to accept such proposal (Davis and Tama‐Sweet,
2012).
5
Paraphrase This Document
Need a fresh take? Get an instant paraphrase of this document with our AI Paraphraser
TASK 2
Interpretation of financial statements of Samsung Plc by ratio analysis:
Financial statements of an organisation shall includes profit and loss account, balance
sheet, CFS and so on which provides the its financial position and profitability position and cash
flow position. Interpretation of these financial statements shall include financial evaluation of
ratios, W.C. evaluation and C.F. evaluation. Ratio measurement of financial statements of
Samsung Plc as follows:
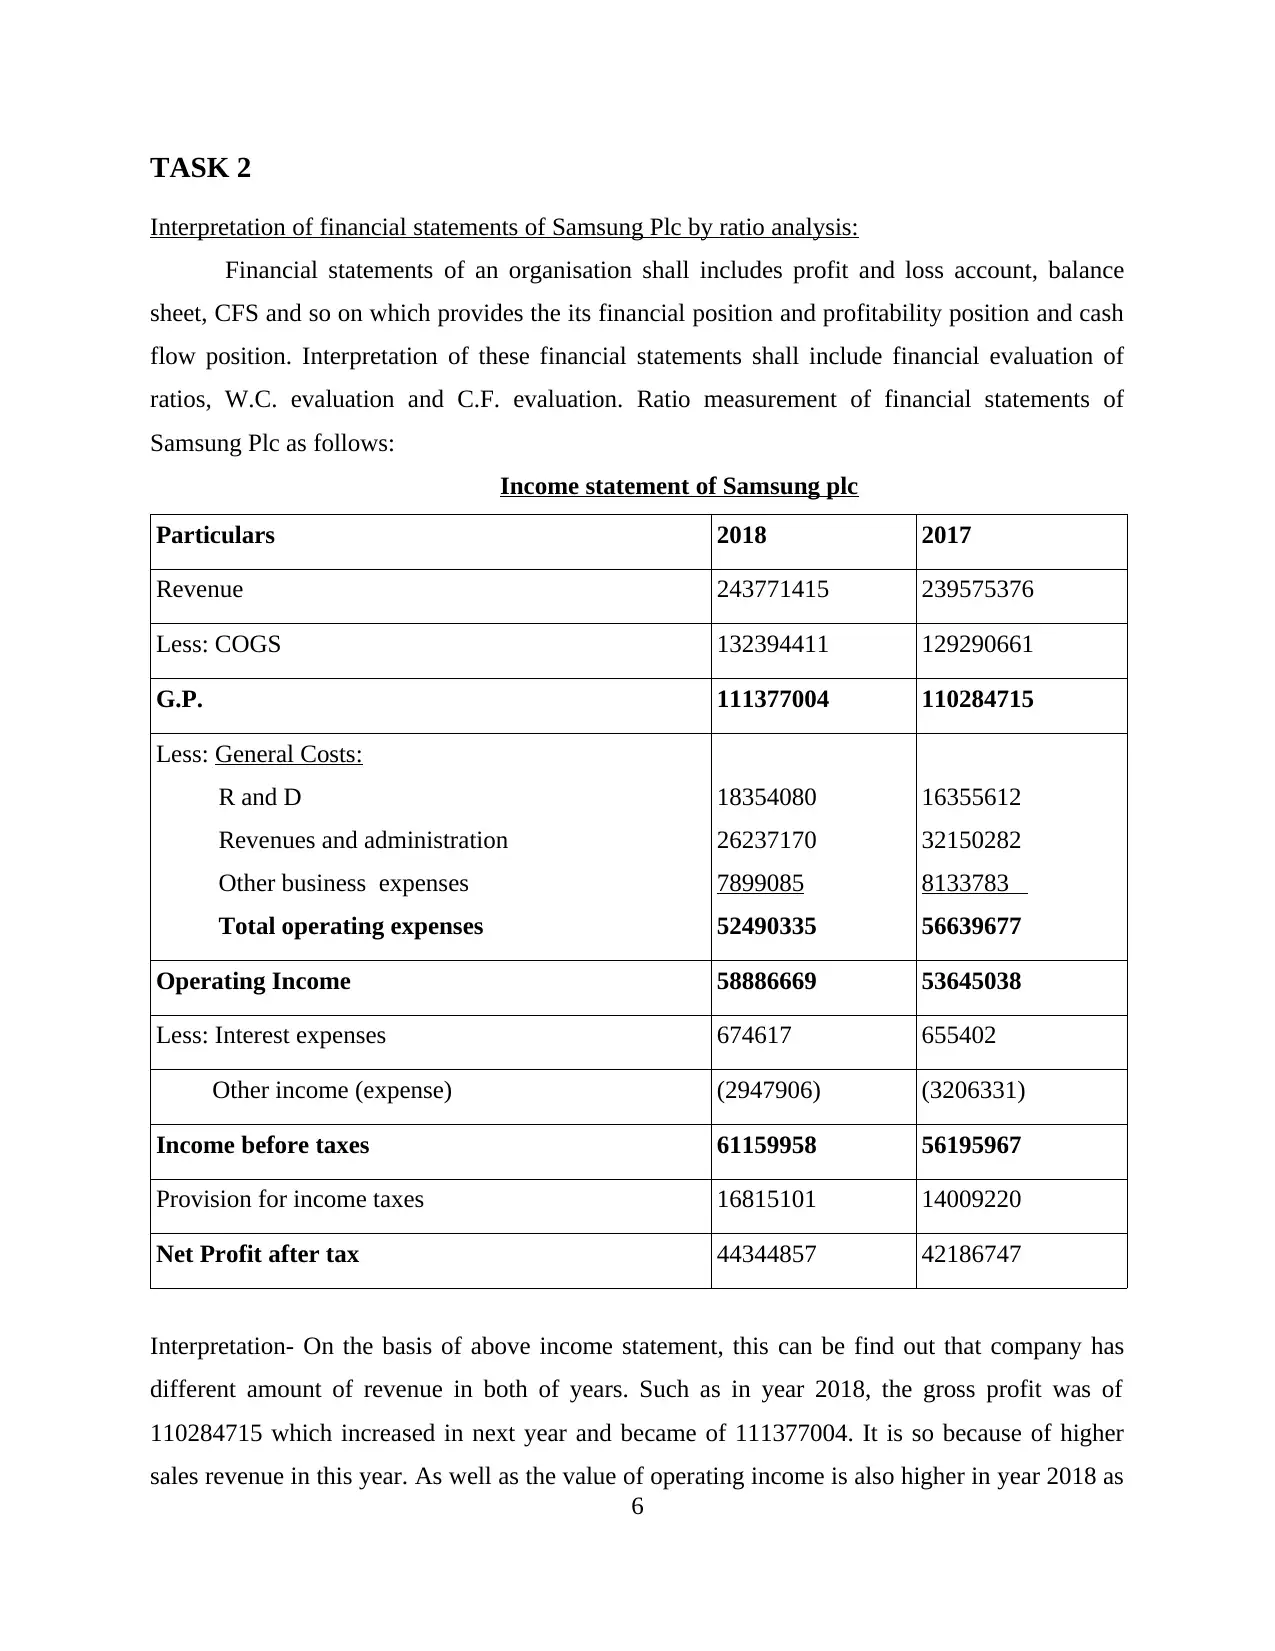
Income statement of Samsung plc
Particulars 2018 2017
Revenue 243771415 239575376
Less: COGS 132394411 129290661
G.P. 111377004 110284715
Less: General Costs:
R and D
Revenues and administration
Other business expenses
Total operating expenses
18354080
26237170
7899085
52490335
16355612
32150282
8133783
56639677
Operating Income 58886669 53645038
Less: Interest expenses 674617 655402
Other income (expense) (2947906) (3206331)
Income before taxes 61159958 56195967
Provision for income taxes 16815101 14009220
Net Profit after tax 44344857 42186747
Interpretation- On the basis of above income statement, this can be find out that company has
different amount of revenue in both of years. Such as in year 2018, the gross profit was of
110284715 which increased in next year and became of 111377004. It is so because of higher
sales revenue in this year. As well as the value of operating income is also higher in year 2018 as
6
Interpretation of financial statements of Samsung Plc by ratio analysis:
Financial statements of an organisation shall includes profit and loss account, balance
sheet, CFS and so on which provides the its financial position and profitability position and cash
flow position. Interpretation of these financial statements shall include financial evaluation of
ratios, W.C. evaluation and C.F. evaluation. Ratio measurement of financial statements of
Samsung Plc as follows:
Income statement of Samsung plc
Particulars 2018 2017
Revenue 243771415 239575376
Less: COGS 132394411 129290661
G.P. 111377004 110284715
Less: General Costs:
R and D
Revenues and administration
Other business expenses
Total operating expenses
18354080
26237170
7899085
52490335
16355612
32150282
8133783
56639677
Operating Income 58886669 53645038
Less: Interest expenses 674617 655402
Other income (expense) (2947906) (3206331)
Income before taxes 61159958 56195967
Provision for income taxes 16815101 14009220
Net Profit after tax 44344857 42186747
Interpretation- On the basis of above income statement, this can be find out that company has
different amount of revenue in both of years. Such as in year 2018, the gross profit was of
110284715 which increased in next year and became of 111377004. It is so because of higher
sales revenue in this year. As well as the value of operating income is also higher in year 2018 as
6
compare to year 2017. So overall, it can be interpreted that above company's performance is
better in year 2018.
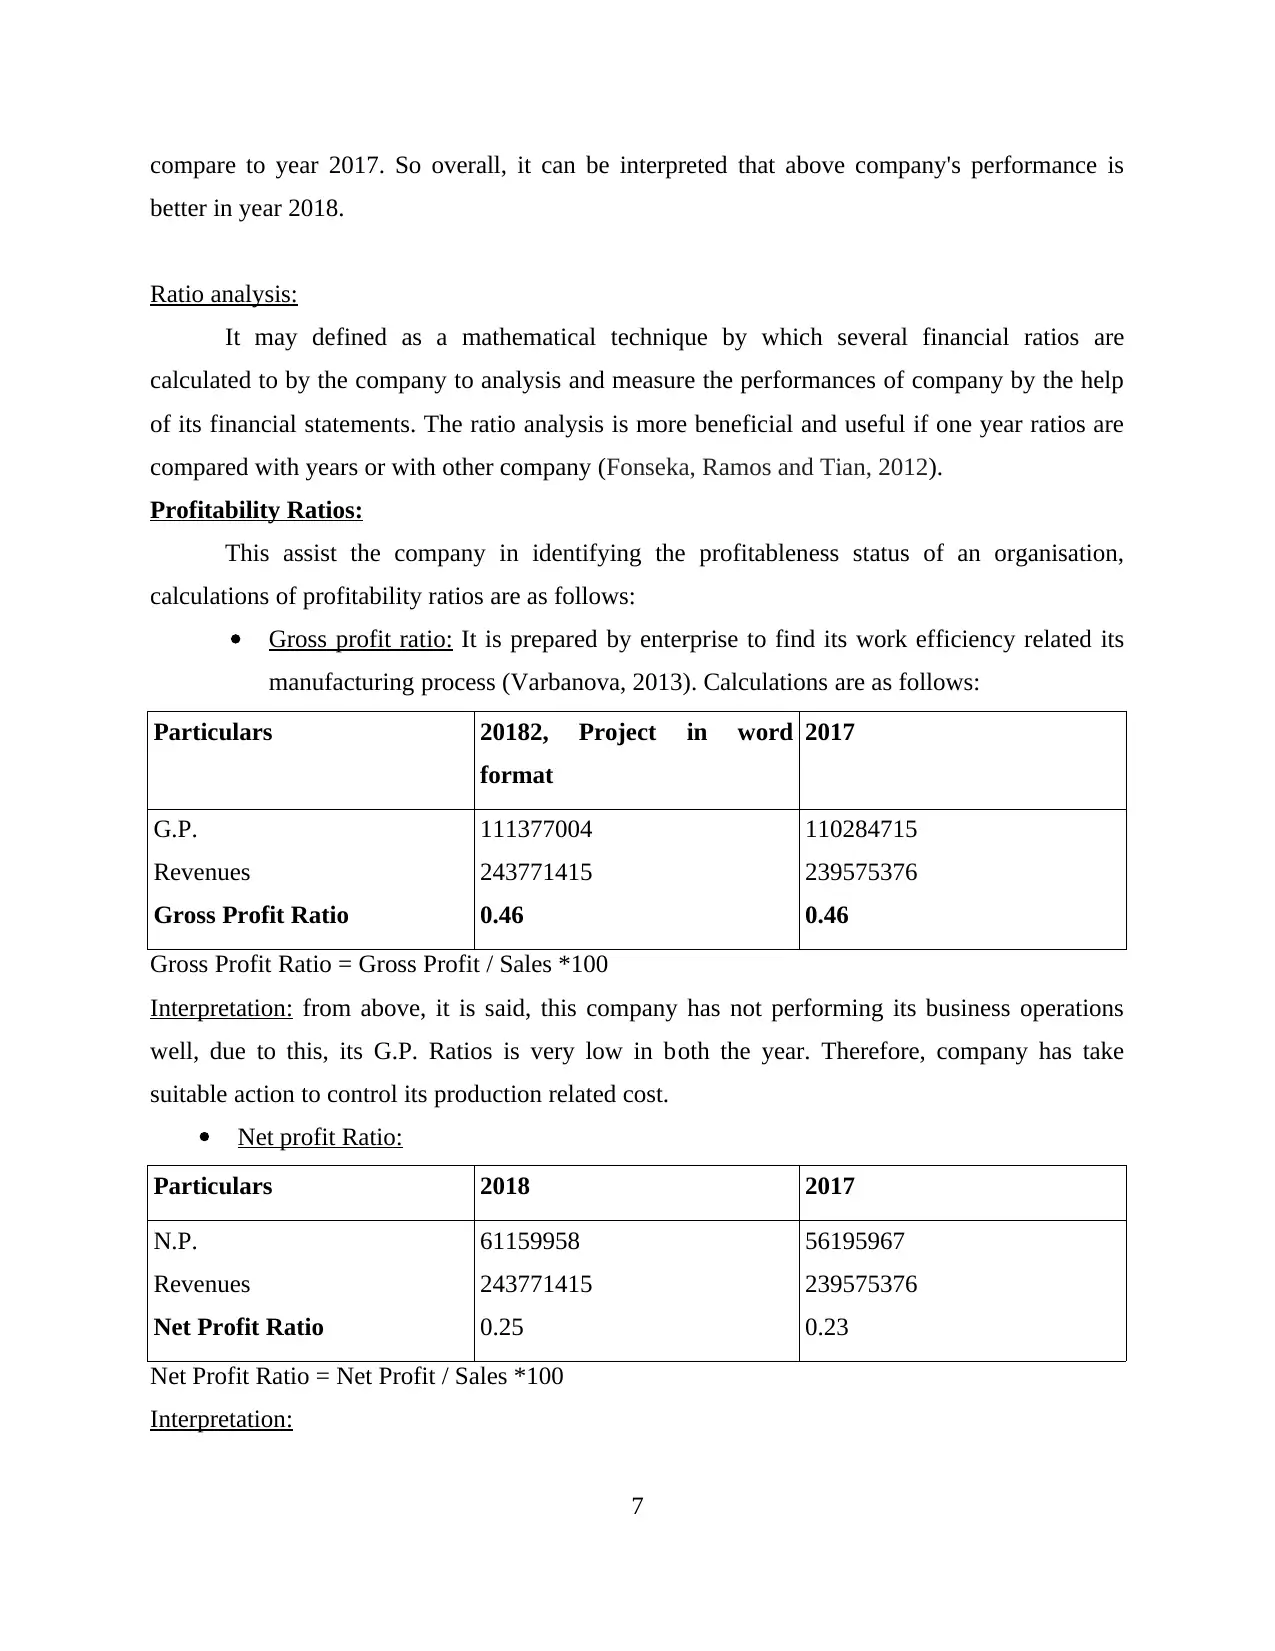
Ratio analysis:
It may defined as a mathematical technique by which several financial ratios are
calculated to by the company to analysis and measure the performances of company by the help
of its financial statements. The ratio analysis is more beneficial and useful if one year ratios are
compared with years or with other company (Fonseka, Ramos and Tian, 2012).
Profitability Ratios:
This assist the company in identifying the profitableness status of an organisation,
calculations of profitability ratios are as follows:
Gross profit ratio: It is prepared by enterprise to find its work efficiency related its
manufacturing process (Varbanova, 2013). Calculations are as follows:
Particulars 20182, Project in word
format
2017
G.P.
Revenues
Gross Profit Ratio
111377004
243771415
0.46
110284715
239575376
0.46
Gross Profit Ratio = Gross Profit / Sales *100
Interpretation: from above, it is said, this company has not performing its business operations
well, due to this, its G.P. Ratios is very low in both the year. Therefore, company has take
suitable action to control its production related cost.
Net profit Ratio:
Particulars 2018 2017
N.P.
Revenues
Net Profit Ratio
61159958
243771415
0.25
56195967
239575376
0.23
Net Profit Ratio = Net Profit / Sales *100
Interpretation:
7
better in year 2018.
Ratio analysis:
It may defined as a mathematical technique by which several financial ratios are
calculated to by the company to analysis and measure the performances of company by the help
of its financial statements. The ratio analysis is more beneficial and useful if one year ratios are
compared with years or with other company (Fonseka, Ramos and Tian, 2012).
Profitability Ratios:
This assist the company in identifying the profitableness status of an organisation,
calculations of profitability ratios are as follows:
Gross profit ratio: It is prepared by enterprise to find its work efficiency related its
manufacturing process (Varbanova, 2013). Calculations are as follows:
Particulars 20182, Project in word
format
2017
G.P.
Revenues
Gross Profit Ratio
111377004
243771415
0.46
110284715
239575376
0.46
Gross Profit Ratio = Gross Profit / Sales *100
Interpretation: from above, it is said, this company has not performing its business operations
well, due to this, its G.P. Ratios is very low in both the year. Therefore, company has take
suitable action to control its production related cost.
Net profit Ratio:
Particulars 2018 2017
N.P.
Revenues
Net Profit Ratio
61159958
243771415
0.25
56195967
239575376
0.23
Net Profit Ratio = Net Profit / Sales *100
Interpretation:
7
⊘ This is a preview!⊘
Do you want full access?
Subscribe today to unlock all pages.
Trusted by 1+ million students worldwide
It has to be evident after seen above calculations that its year 2018 ratios is 0.25% as
compared to year 2017 0.23%. This mean that its net profit ratio has increased but not so much
as in both years it has less than 1% N.P. Ratio. Company shall require to take suitable steps to
control its operating cost to enhance the its profitability.
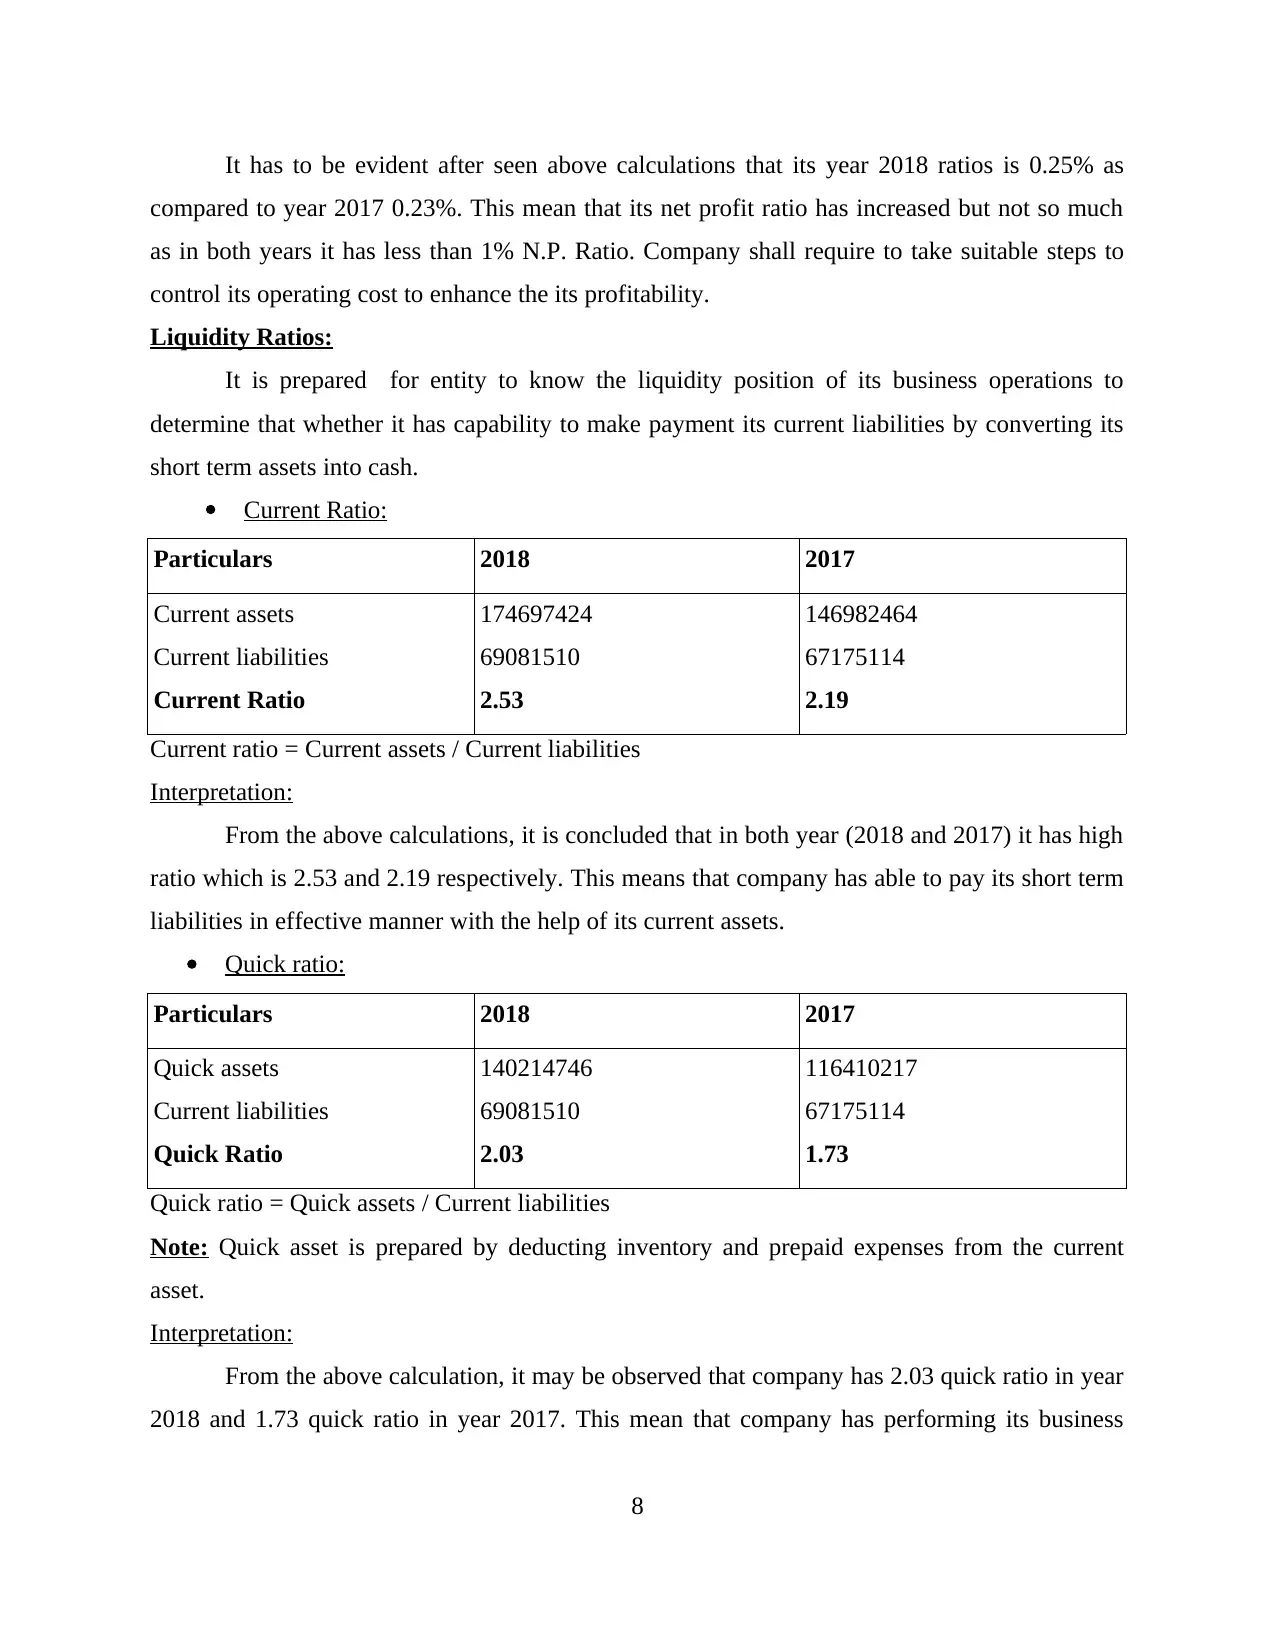
Liquidity Ratios:
It is prepared for entity to know the liquidity position of its business operations to
determine that whether it has capability to make payment its current liabilities by converting its
short term assets into cash.
Current Ratio:
Particulars 2018 2017
Current assets
Current liabilities
Current Ratio
174697424
69081510
2.53
146982464
67175114
2.19
Current ratio = Current assets / Current liabilities
Interpretation:
From the above calculations, it is concluded that in both year (2018 and 2017) it has high
ratio which is 2.53 and 2.19 respectively. This means that company has able to pay its short term
liabilities in effective manner with the help of its current assets.
Quick ratio:
Particulars 2018 2017
Quick assets
Current liabilities
Quick Ratio
140214746
69081510
2.03
116410217
67175114
1.73
Quick ratio = Quick assets / Current liabilities
Note: Quick asset is prepared by deducting inventory and prepaid expenses from the current
asset.
Interpretation:
From the above calculation, it may be observed that company has 2.03 quick ratio in year
2018 and 1.73 quick ratio in year 2017. This mean that company has performing its business
8
compared to year 2017 0.23%. This mean that its net profit ratio has increased but not so much
as in both years it has less than 1% N.P. Ratio. Company shall require to take suitable steps to
control its operating cost to enhance the its profitability.
Liquidity Ratios:
It is prepared for entity to know the liquidity position of its business operations to
determine that whether it has capability to make payment its current liabilities by converting its
short term assets into cash.
Current Ratio:
Particulars 2018 2017
Current assets
Current liabilities
Current Ratio
174697424
69081510
2.53
146982464
67175114
2.19
Current ratio = Current assets / Current liabilities
Interpretation:
From the above calculations, it is concluded that in both year (2018 and 2017) it has high
ratio which is 2.53 and 2.19 respectively. This means that company has able to pay its short term
liabilities in effective manner with the help of its current assets.
Quick ratio:
Particulars 2018 2017
Quick assets
Current liabilities
Quick Ratio
140214746
69081510
2.03
116410217
67175114
1.73
Quick ratio = Quick assets / Current liabilities
Note: Quick asset is prepared by deducting inventory and prepaid expenses from the current
asset.
Interpretation:
From the above calculation, it may be observed that company has 2.03 quick ratio in year
2018 and 1.73 quick ratio in year 2017. This mean that company has performing its business
8
Paraphrase This Document
Need a fresh take? Get an instant paraphrase of this document with our AI Paraphraser
operations very well so that it capacity to pay its current liabilities with the help of its quick
assets by converting them in cash has enhanced.
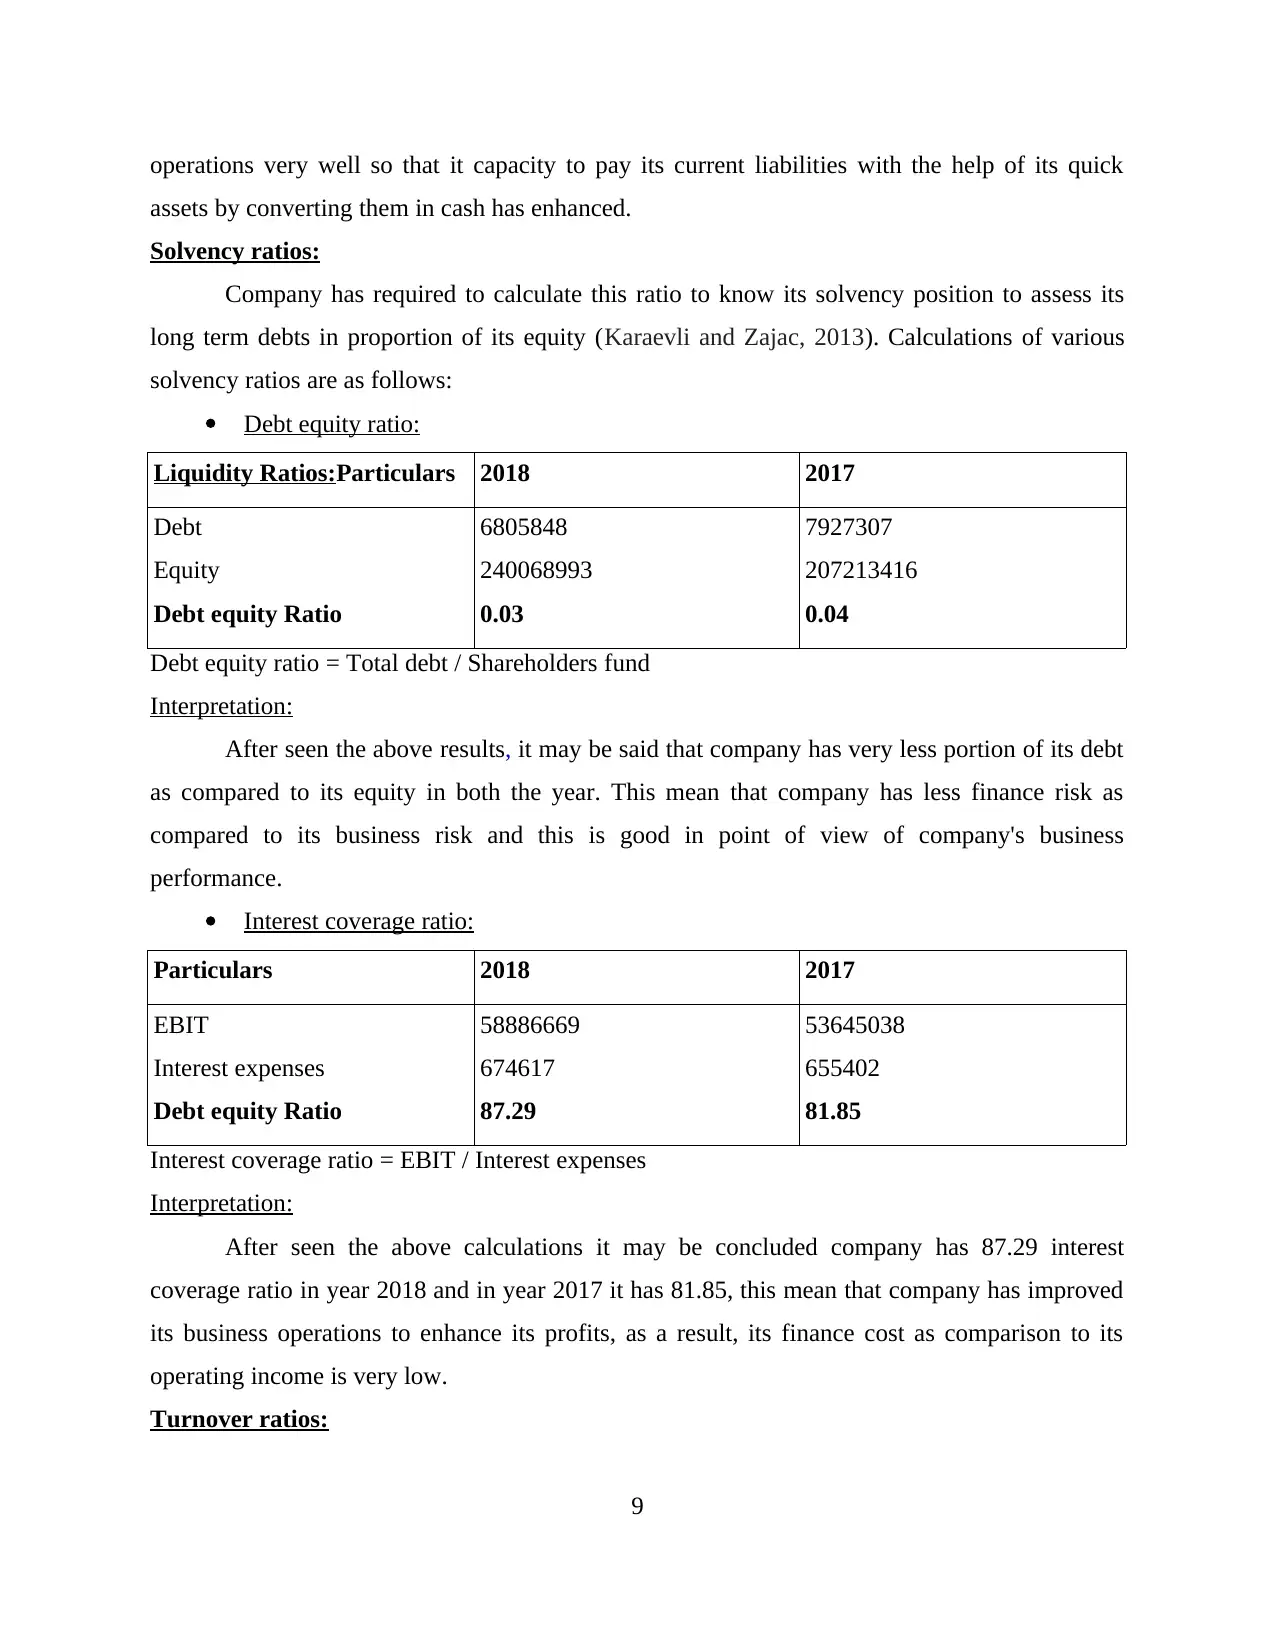
Solvency ratios:
Company has required to calculate this ratio to know its solvency position to assess its
long term debts in proportion of its equity (Karaevli and Zajac, 2013). Calculations of various
solvency ratios are as follows:
Debt equity ratio:
Liquidity Ratios:Particulars 2018 2017
Debt
Equity
Debt equity Ratio
6805848
240068993
0.03
7927307
207213416
0.04
Debt equity ratio = Total debt / Shareholders fund
Interpretation:
After seen the above results, it may be said that company has very less portion of its debt
as compared to its equity in both the year. This mean that company has less finance risk as
compared to its business risk and this is good in point of view of company's business
performance.
Interest coverage ratio:
Particulars 2018 2017
EBIT
Interest expenses
Debt equity Ratio
58886669
674617
87.29
53645038
655402
81.85
Interest coverage ratio = EBIT / Interest expenses
Interpretation:
After seen the above calculations it may be concluded company has 87.29 interest
coverage ratio in year 2018 and in year 2017 it has 81.85, this mean that company has improved
its business operations to enhance its profits, as a result, its finance cost as comparison to its
operating income is very low.
Turnover ratios:
9
assets by converting them in cash has enhanced.
Solvency ratios:
Company has required to calculate this ratio to know its solvency position to assess its
long term debts in proportion of its equity (Karaevli and Zajac, 2013). Calculations of various
solvency ratios are as follows:
Debt equity ratio:
Liquidity Ratios:Particulars 2018 2017
Debt
Equity
Debt equity Ratio
6805848
240068993
0.03
7927307
207213416
0.04
Debt equity ratio = Total debt / Shareholders fund
Interpretation:
After seen the above results, it may be said that company has very less portion of its debt
as compared to its equity in both the year. This mean that company has less finance risk as
compared to its business risk and this is good in point of view of company's business
performance.
Interest coverage ratio:
Particulars 2018 2017
EBIT
Interest expenses
Debt equity Ratio
58886669
674617
87.29
53645038
655402
81.85
Interest coverage ratio = EBIT / Interest expenses
Interpretation:
After seen the above calculations it may be concluded company has 87.29 interest
coverage ratio in year 2018 and in year 2017 it has 81.85, this mean that company has improved
its business operations to enhance its profits, as a result, its finance cost as comparison to its
operating income is very low.
Turnover ratios:
9
These ratios are calculated by the company to measure the companies various
performances in terms of its turnover. In other words, it may be said that company takes its
revenue as base for other business activities if turnover is more as compared to other other
business activities then it may be said that it is good for the company (Naz, Shah and Kutan,
2017).
Fixed assets turnover ratio:
Particulars 2018 2017
Net sales
Average fixed assets
Fixed assets turnover ratio
243771415
154449878.5
1.58
239575376
134947734
1.78
Fixed Assets Turnover Ratio Formula = Net Sales / Average Fixed Assets
Interpretation:
From the above calculations, It is clearly evident that company has almost same ratios in
both given years. This mean that company has consistent in performing its business operations
and such ratio of both the years are more than one, this indicates that company has performing
well in utilising its fixed assets in terms of its revenue.
Inventory turnover ratio:
Particulars 2018 2017
Net sales
Average inventories
Inventory turnover ratio:
243771415
26984029.5
9.03
239575376
21668429
11.06
Inventory Turnover Ratio Formula = Cost of Goods Sold/Average Inventories
Interpretation:
From the above report, it may be said that company has 9.03 in year 2018 and 11.06 in
year 2017. This mean that company has not utilising its inventories in well manner, due to this,
its inventory turnover ratio has decreased. Although, company still utilise its inventories very
well in terms of its revenue in current year.
Suggestions to Samsung Plc on the basis of evaluation and interpretation of financial position:
After observing financial statements (F.S.) and ratio analysis of such F.S., it may said that
the financial performance of Samsung Plc is very stable. All its turnover related ratios shows that
10
⊘ This is a preview!⊘
Do you want full access?
Subscribe today to unlock all pages.
Trusted by 1+ million students worldwide
1 out of 19
Related Documents


Your All-in-One AI-Powered Toolkit for Academic Success.
+13062052269
info@desklib.com
Available 24*7 on WhatsApp / Email
![[object Object]](/_next/static/media/star-bottom.7253800d.svg)
Unlock your academic potential
Copyright © 2020–2026 A2Z Services. All Rights Reserved. Developed and managed by ZUCOL.