Financial Analysis of Booker Group PLC and Tate & Lyle PLC
VerifiedAdded on 2020/12/29
|46
|10766
|192
Report
AI Summary
This report provides a strategic financial analysis of Booker Group PLC and Tate & Lyle PLC, two companies in the food industry. It begins with an introduction to strategic financial analysis, its significance, and the objectives of the project. The report then delves into a detailed calculation and interpretation of various financial ratios, including profitability, liquidity, efficiency, leverage, cash flow, and investor ratios, comparing the performance of both companies over a five-year period. Common-size and DuPont analyses are also conducted. Furthermore, the report discusses the advantages and disadvantages of the employed analytical methods, and briefly touches upon contemporary methods like EMH, EVA, and CAPM. The analysis reveals insights into the companies' financial health, highlighting strengths and weaknesses, and offering a comparative assessment of their performance. The report concludes with a summary of the findings and a list of references.

STRATEGIC FINANCIAL ANALYSIS
Paraphrase This Document
Need a fresh take? Get an instant paraphrase of this document with our AI Paraphraser
Table of Contents
1.0 INTRODUCTION....................................................................................................................................................1
1.1 Defining Strategic financial analysis and significance of financial analysis......................................................1
1.2 Objective of project.............................................................................................................................................1
1.3 Introducing two companies.................................................................................................................................1
1.4 Introducing methods of analysis..........................................................................................................................1
2.0 Calculation of Ratios.................................................................................................................................................1
2.1 Profitability..........................................................................................................................................................1
2.2 Liquidity..............................................................................................................................................................4
2.3 Efficiency............................................................................................................................................................5
2.4 Leverage..............................................................................................................................................................7
2.5 Cash flow ratios...................................................................................................................................................8
2.6 Investor’s ratios.................................................................................................................................................10
2.7 Common-size.....................................................................................................................................................11
Horizontal Analysis.......................................................................................................................................................14
2.8 DuPont analysis.................................................................................................................................................16
2.9 Segmental analysis............................................................................................................................................18
.......................................................................................................................................................................................20
.......................................................................................................................................................................................20
3.0 Advantages and disadvantages of analysis.............................................................................................................20
3.1 Financial Ratios Analysis..................................................................................................................................20
3.2 Common-size Analysis......................................................................................................................................21
3.3 DuPont Analysis................................................................................................................................................21
4.0 Contemporary Methods...........................................................................................................................................22
4.1 EMH..................................................................................................................................................................22
4.2 EVA...................................................................................................................................................................22
4.3 CAPM................................................................................................................................................................22
5.0 CONCLUSION.......................................................................................................................................................22
6.0 LIST OF REFERENCES........................................................................................................................................24
APPENDIXES..............................................................................................................................................................26
Figure Index
Figure 1: Gross profit margin..........................................................................................................................................2
Figure 2: OPM................................................................................................................................................................2
Figure 3: Net Profit Margin............................................................................................................................................3
Figure 4: ROCE..............................................................................................................................................................4
Figure 5: Current Ratio...................................................................................................................................................4
Figure 6: Quick Ratio......................................................................................................................................................5
Figure 7: Days of Sales Outstanding...............................................................................................................................5
Figure 8: Days of Inventory on Hand.............................................................................................................................6
Figure 9: Days of Payables.............................................................................................................................................6
Figure 10: Cash Conversion Cycle.................................................................................................................................7
Figure 11: Debt-to-equity ratio.......................................................................................................................................7
Figure 12: Gearing..........................................................................................................................................................8
Figure 13: Operating cash flow to sales..........................................................................................................................8
Figure 14: Operating cash flow to net profit...................................................................................................................9
Figure 15: Cash flow to debt.........................................................................................................................................10
Figure 16: Earnings Per Share......................................................................................................................................10
Figure 17: Dividend Payout Ratio................................................................................................................................11
Figure 18: Price Earnings Ratio....................................................................................................................................11
Figure 19: Vertical SOPL.............................................................................................................................................12
Figure 20: Vertical SOFP..............................................................................................................................................13
Figure 21: Vertical Cash flow statement.......................................................................................................................13
Figure 22: Horizontal SOPL.........................................................................................................................................14
Figure 23: Horizontal SOFP.........................................................................................................................................15
Figure 24: Horizontal Cash flow statement..................................................................................................................15
Figure 25: 2 FACTORS ROA.......................................................................................................................................17
Figure 26: 2 FACTORS ROE.......................................................................................................................................17
Figure 27: UK Segment................................................................................................................................................19
Figure 28: USA Segment..............................................................................................................................................20
Figure 29: Other European Countries Segment............................................................................................................20
Figure 30: Rest of the world Segment..........................................................................................................................21
⊘ This is a preview!⊘
Do you want full access?
Subscribe today to unlock all pages.
Trusted by 1+ million students worldwide
1.0 INTRODUCTION
1.1 Defining Strategic financial analysis and significance of financial analysis
The term strategic financial analysis is used for integrating data, analysing and then form decisions by
incorporating accounting regulations. The strategic plan and financial objectives can be enhanced by getting into
account risk assessment metrics with ease (Cumming and Johan, 2017). The financial planning can be made and
decision-making can be done properly with main of increasing overall profitability position of company in effectual
manner.
1.2 Objective of project
Main objective of present project is to assess business performance of companies like Booker Group PLC
and Tate & Lyle PLC for past five years and making comparison of financial health of companies. Furthermore,
project will be made for describing, critically assess and evaluate the principal methods of accounts to firm’s
outsider. Indicating shortcomings in process and proposing contemporary analysis methods for eradicating
shortcomings. Moreover, dynamic analysis of two companies will be made (Vanhegan and et.al., 2012).
1.3 Introducing two companies
Booker Group PLC and Tate & Lyle PLC are being taken which are under same segment of food industry
and are bigger firms in terms of market capitalisation and consumer’s base (Laudon and Traver, 2013). Booker
Group PLC is British food wholesaler organisation based in UK. It was founded by George and Richard Booker in
1835. It has various subsidiaries such as Makro, Booker Direct, Chef Direct, Family Shopper and many others. It
serves more than 1.5 million customers and has 13000 employees.
Tate & Lyle PLC is British MNC started and run as agribusiness. In 1921, merger was formed by Henry
Tate & Sons and Abraham Lyle & Sons. It has employees strength of 4326 and provides food commodities to
customers.
1.4 Introducing methods of analysis
The financial methods used in present project are ratio analysis, common size method and DuPont analysis are
being conducted.
Ratio analysis is one of important technique for analysing health of company.
Common size method analysis help to compare performances of firm with the help of base year quite
effectually (Liang and et.al., 2016). DuPont analysis will also carried out for investors to under capital
structure, asset efficiency and profit efficiency of two reputed firms.
2.0 Calculation of Ratios
Ratio analysis is one of the widely used method for analysing financial performance of company in effectual
manner (Sheikhi, Ranjbar and Oraee, 2012). It can be analysed that financial ratios are computed for company
which provide firm’s stakeholders with better decisions to be taken.
1
Paraphrase This Document
Need a fresh take? Get an instant paraphrase of this document with our AI Paraphraser
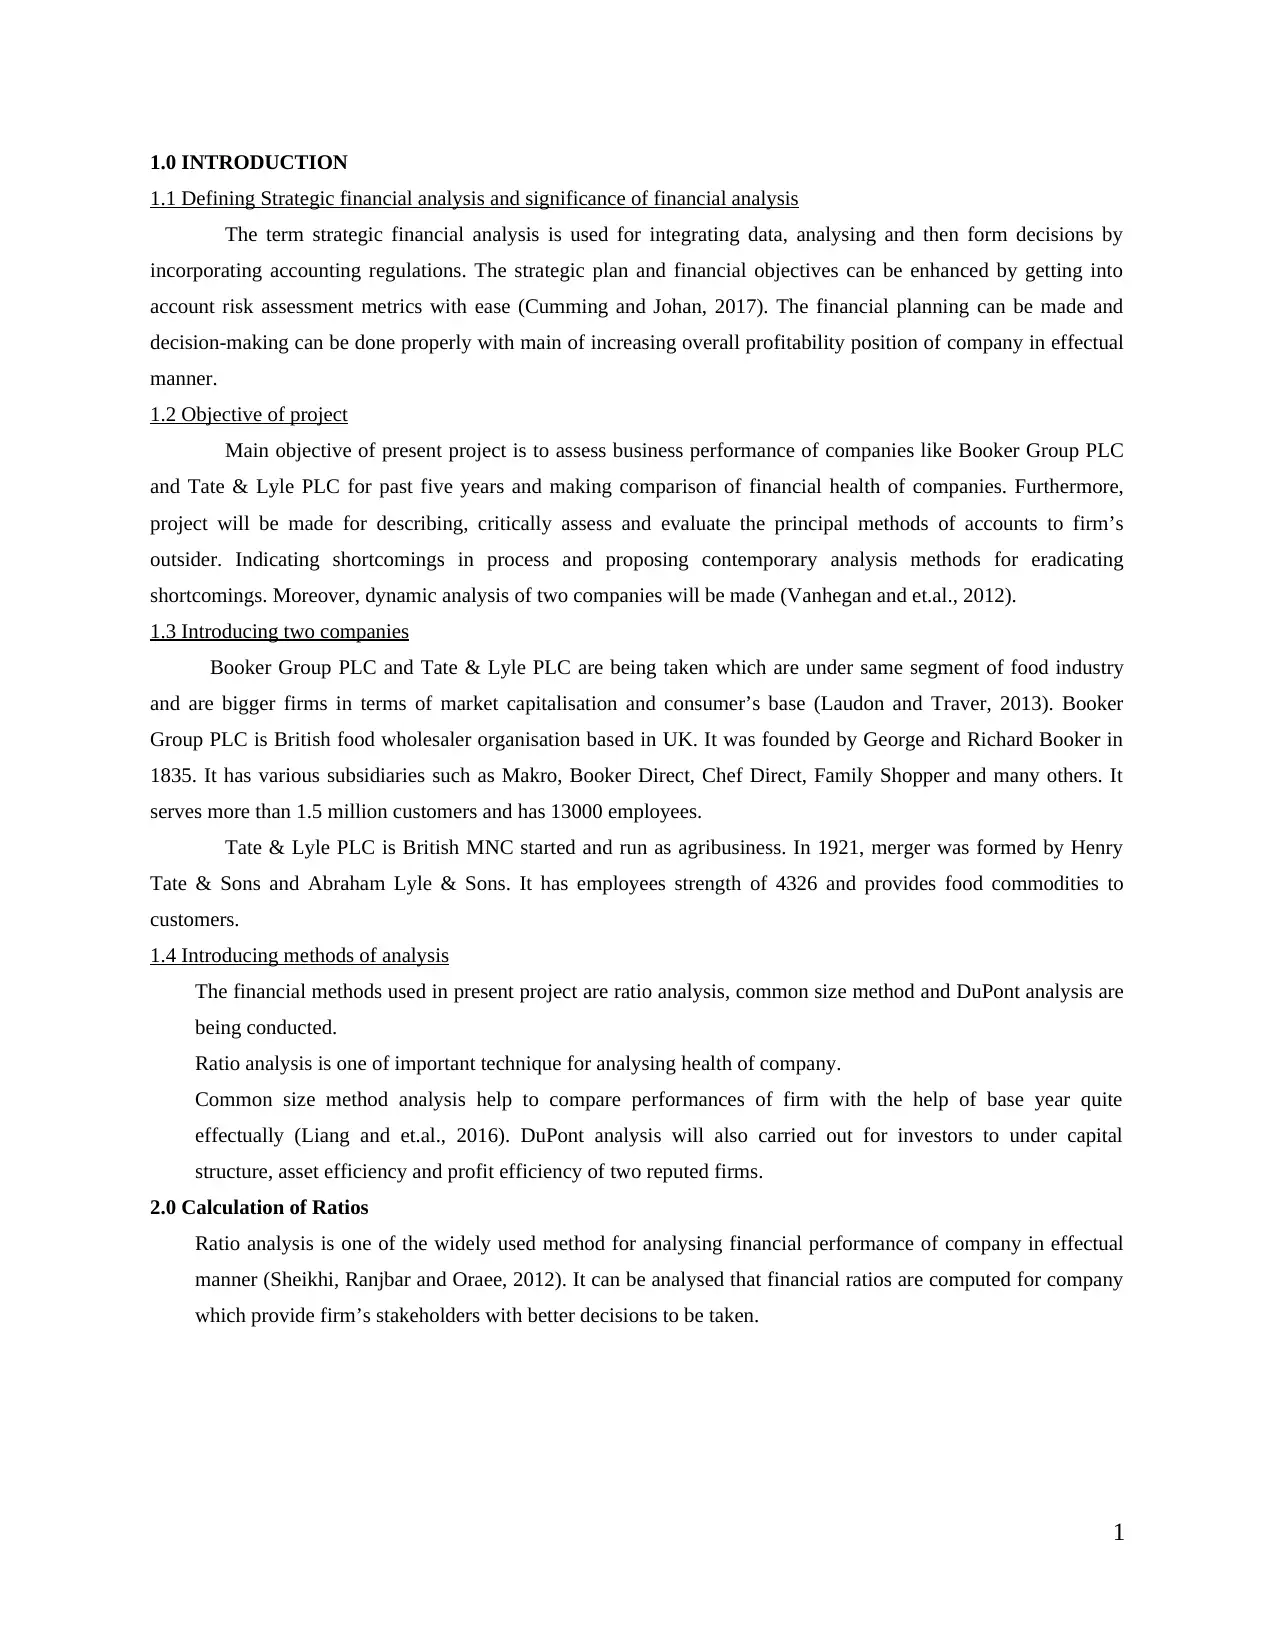
2.1 Profitability
Gross Profit Margin
Figure 1: Gross profit margin
Gross profit means profit left after deducting cost of goods sold from revenue and should be higher. It can
be analysed from the chart that gross profit of both companies is increased up to a high extent. The GPM of Booker
Group PLC was 3.78 % in 2012 which maximised to 3.99 % in 2013 and 4.40 % in 2014. Furthermore, ratio of
company was further increased to 4.80 % in 2015 and reached 5.08 % in next year (Annual Report of Booker Group
PLC. 2016). While, Tate & Lyle PLC has also shown steady growth over the profits. The figure was 30.21 % in
2012 which reached 37.54 % in 2016. Thus, both companies have good performance.
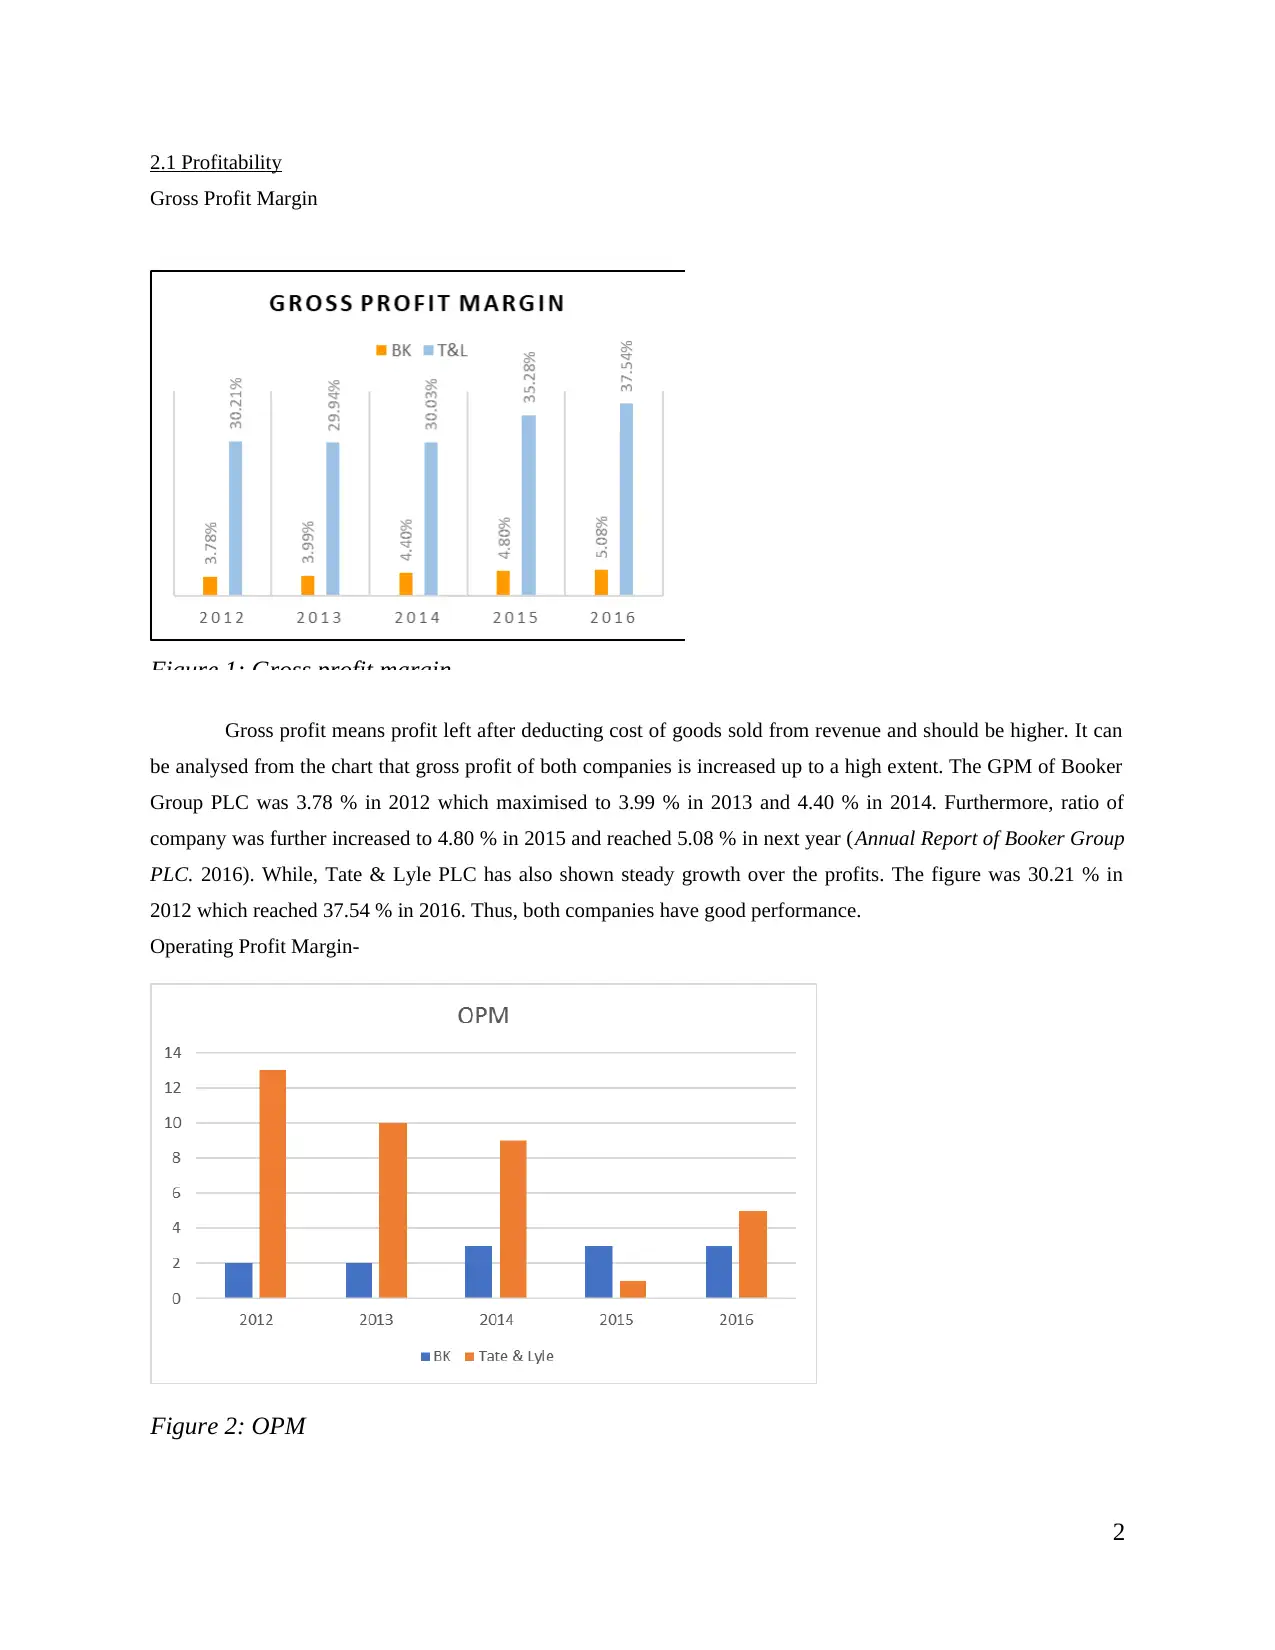
Operating Profit Margin-
Figure 2: OPM
2
Gross Profit Margin
Figure 1: Gross profit margin
Gross profit means profit left after deducting cost of goods sold from revenue and should be higher. It can
be analysed from the chart that gross profit of both companies is increased up to a high extent. The GPM of Booker
Group PLC was 3.78 % in 2012 which maximised to 3.99 % in 2013 and 4.40 % in 2014. Furthermore, ratio of
company was further increased to 4.80 % in 2015 and reached 5.08 % in next year (Annual Report of Booker Group
PLC. 2016). While, Tate & Lyle PLC has also shown steady growth over the profits. The figure was 30.21 % in
2012 which reached 37.54 % in 2016. Thus, both companies have good performance.
Operating Profit Margin-
Figure 2: OPM
2
Operating profit means profit left after deducting operational expenses of firm. The OPM is calculated for
both companies. Booker Group PLC had OPM in 2.3 % in 2012 which increased to 2.4 % in next year. Moreover, it
reached 2.6 % and 3 % in next two years respectively. The figure reached to 3.1 % in 2016. On the other hand, it can
be analysed that OPM of Tate & Lyle PLC has considerably gone down up to a high extent (Tian and Yu, 2017). It
was 13.1 % in 2012 and reached 5.4 % in 2016 which means that company has incurred lot of operating expenses
causing fall down.
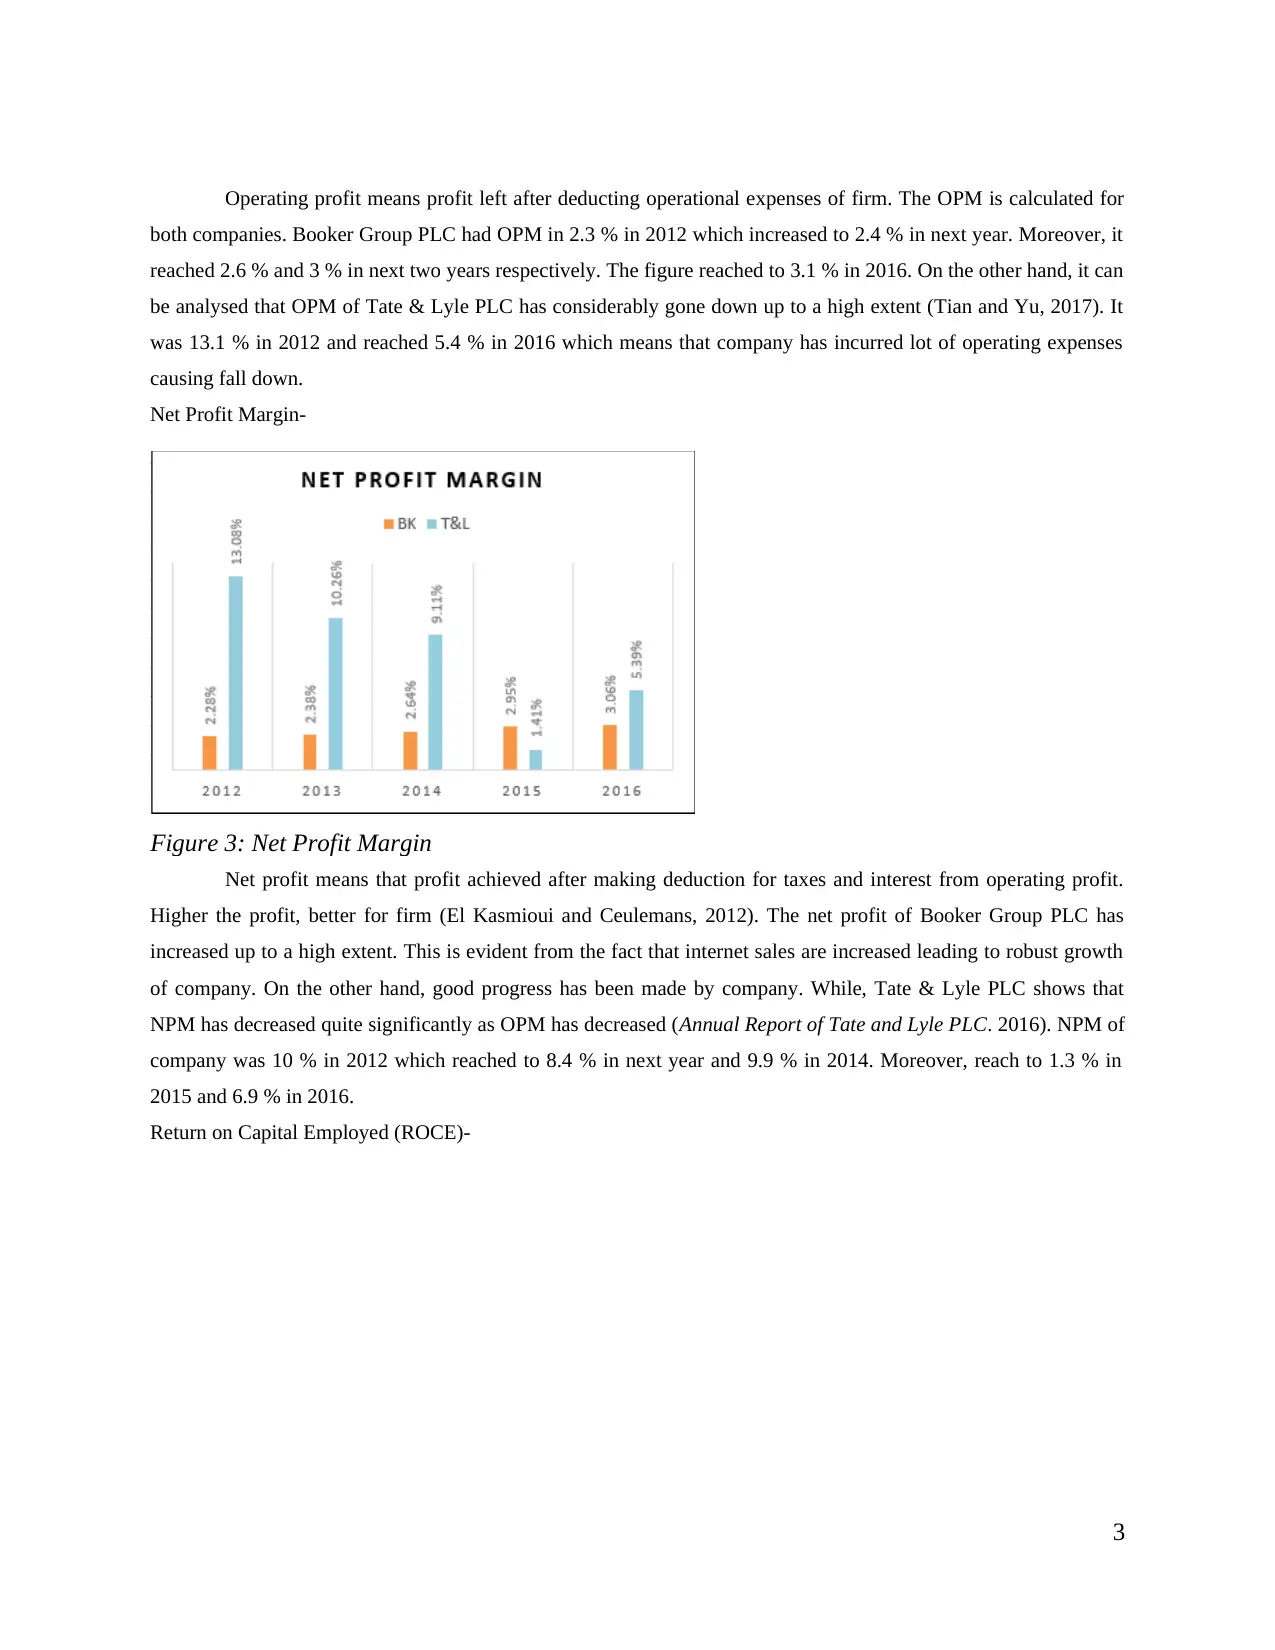
Net Profit Margin-
Figure 3: Net Profit Margin
Net profit means that profit achieved after making deduction for taxes and interest from operating profit.
Higher the profit, better for firm (El Kasmioui and Ceulemans, 2012). The net profit of Booker Group PLC has
increased up to a high extent. This is evident from the fact that internet sales are increased leading to robust growth
of company. On the other hand, good progress has been made by company. While, Tate & Lyle PLC shows that
NPM has decreased quite significantly as OPM has decreased (Annual Report of Tate and Lyle PLC. 2016). NPM of
company was 10 % in 2012 which reached to 8.4 % in next year and 9.9 % in 2014. Moreover, reach to 1.3 % in
2015 and 6.9 % in 2016.
Return on Capital Employed (ROCE)-
3
both companies. Booker Group PLC had OPM in 2.3 % in 2012 which increased to 2.4 % in next year. Moreover, it
reached 2.6 % and 3 % in next two years respectively. The figure reached to 3.1 % in 2016. On the other hand, it can
be analysed that OPM of Tate & Lyle PLC has considerably gone down up to a high extent (Tian and Yu, 2017). It
was 13.1 % in 2012 and reached 5.4 % in 2016 which means that company has incurred lot of operating expenses
causing fall down.
Net Profit Margin-
Figure 3: Net Profit Margin
Net profit means that profit achieved after making deduction for taxes and interest from operating profit.
Higher the profit, better for firm (El Kasmioui and Ceulemans, 2012). The net profit of Booker Group PLC has
increased up to a high extent. This is evident from the fact that internet sales are increased leading to robust growth
of company. On the other hand, good progress has been made by company. While, Tate & Lyle PLC shows that
NPM has decreased quite significantly as OPM has decreased (Annual Report of Tate and Lyle PLC. 2016). NPM of
company was 10 % in 2012 which reached to 8.4 % in next year and 9.9 % in 2014. Moreover, reach to 1.3 % in
2015 and 6.9 % in 2016.
Return on Capital Employed (ROCE)-
3
⊘ This is a preview!⊘
Do you want full access?
Subscribe today to unlock all pages.
Trusted by 1+ million students worldwide
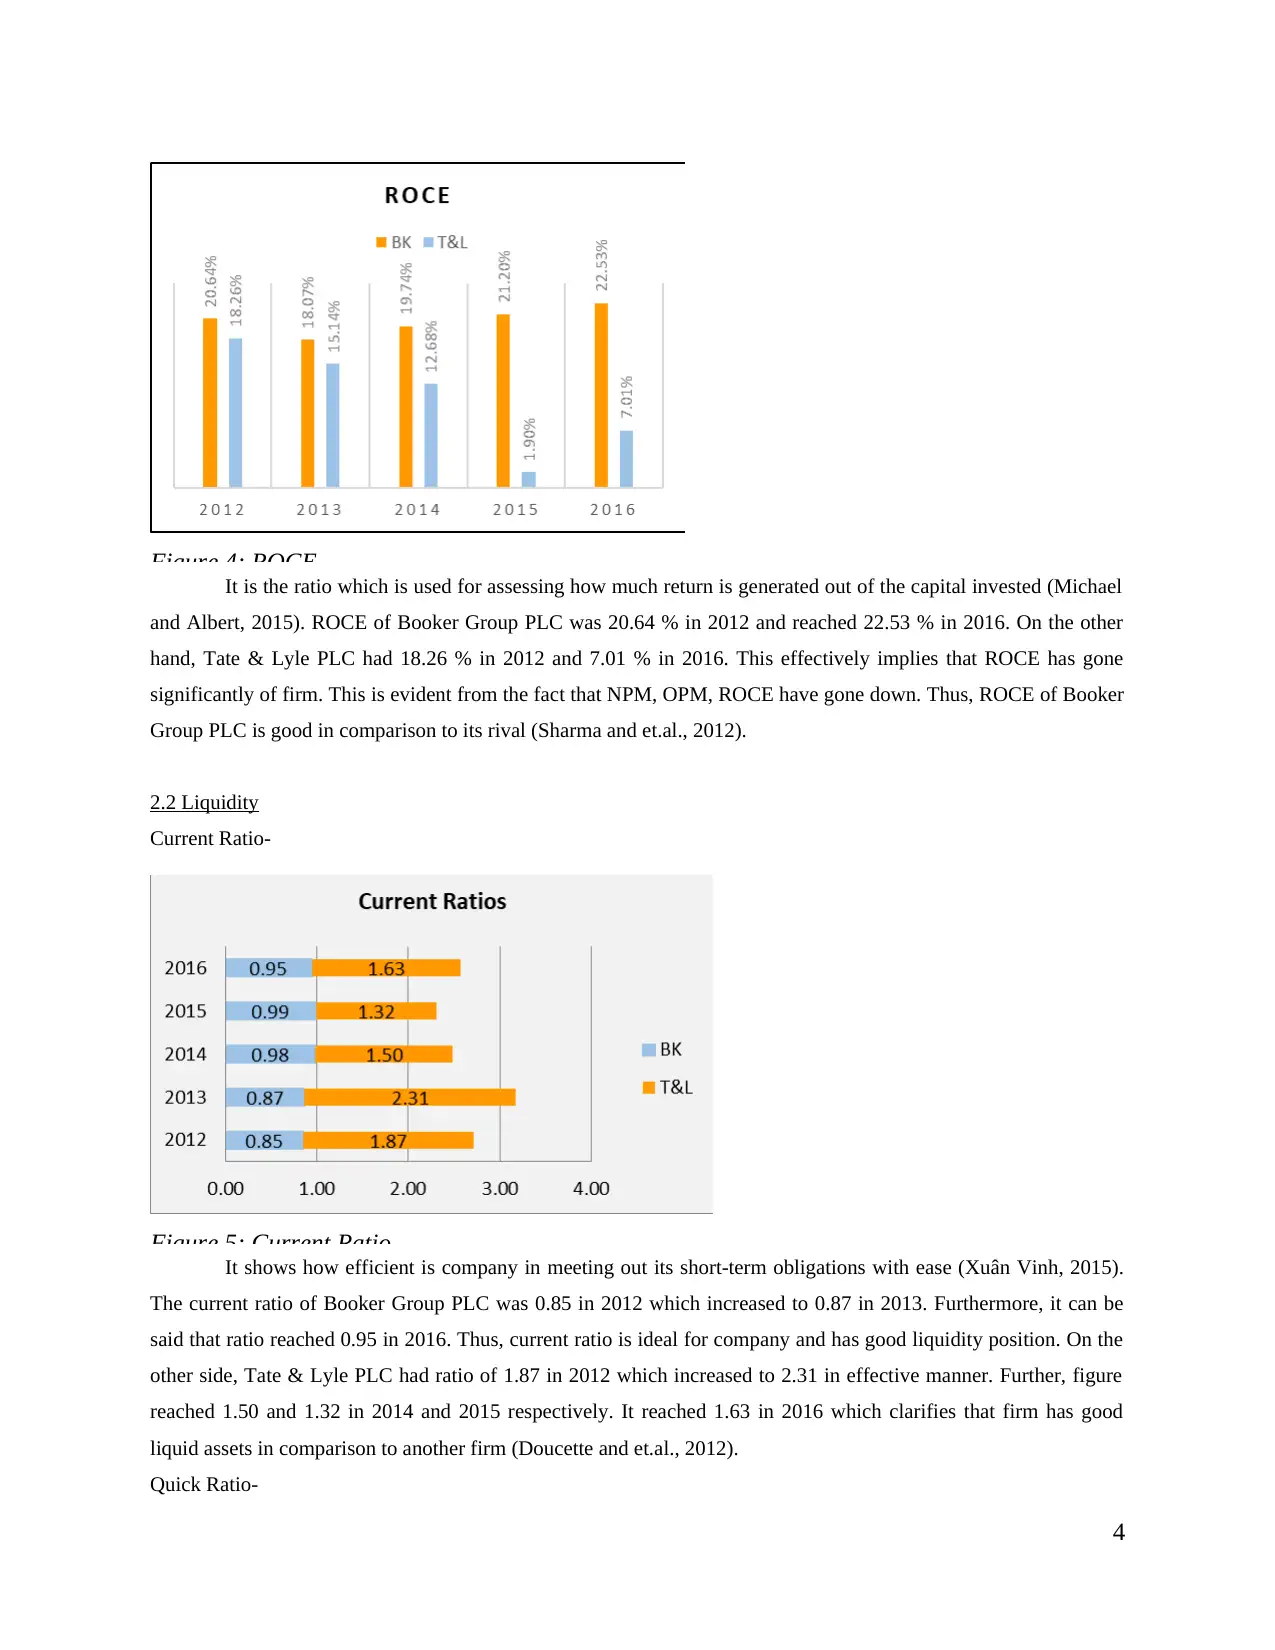
Figure 4: ROCE
It is the ratio which is used for assessing how much return is generated out of the capital invested (Michael
and Albert, 2015). ROCE of Booker Group PLC was 20.64 % in 2012 and reached 22.53 % in 2016. On the other
hand, Tate & Lyle PLC had 18.26 % in 2012 and 7.01 % in 2016. This effectively implies that ROCE has gone
significantly of firm. This is evident from the fact that NPM, OPM, ROCE have gone down. Thus, ROCE of Booker
Group PLC is good in comparison to its rival (Sharma and et.al., 2012).
2.2 Liquidity
Current Ratio-
Figure 5: Current Ratio
It shows how efficient is company in meeting out its short-term obligations with ease (Xuân Vinh, 2015).
The current ratio of Booker Group PLC was 0.85 in 2012 which increased to 0.87 in 2013. Furthermore, it can be
said that ratio reached 0.95 in 2016. Thus, current ratio is ideal for company and has good liquidity position. On the
other side, Tate & Lyle PLC had ratio of 1.87 in 2012 which increased to 2.31 in effective manner. Further, figure
reached 1.50 and 1.32 in 2014 and 2015 respectively. It reached 1.63 in 2016 which clarifies that firm has good
liquid assets in comparison to another firm (Doucette and et.al., 2012).
Quick Ratio-
4
Paraphrase This Document
Need a fresh take? Get an instant paraphrase of this document with our AI Paraphraser
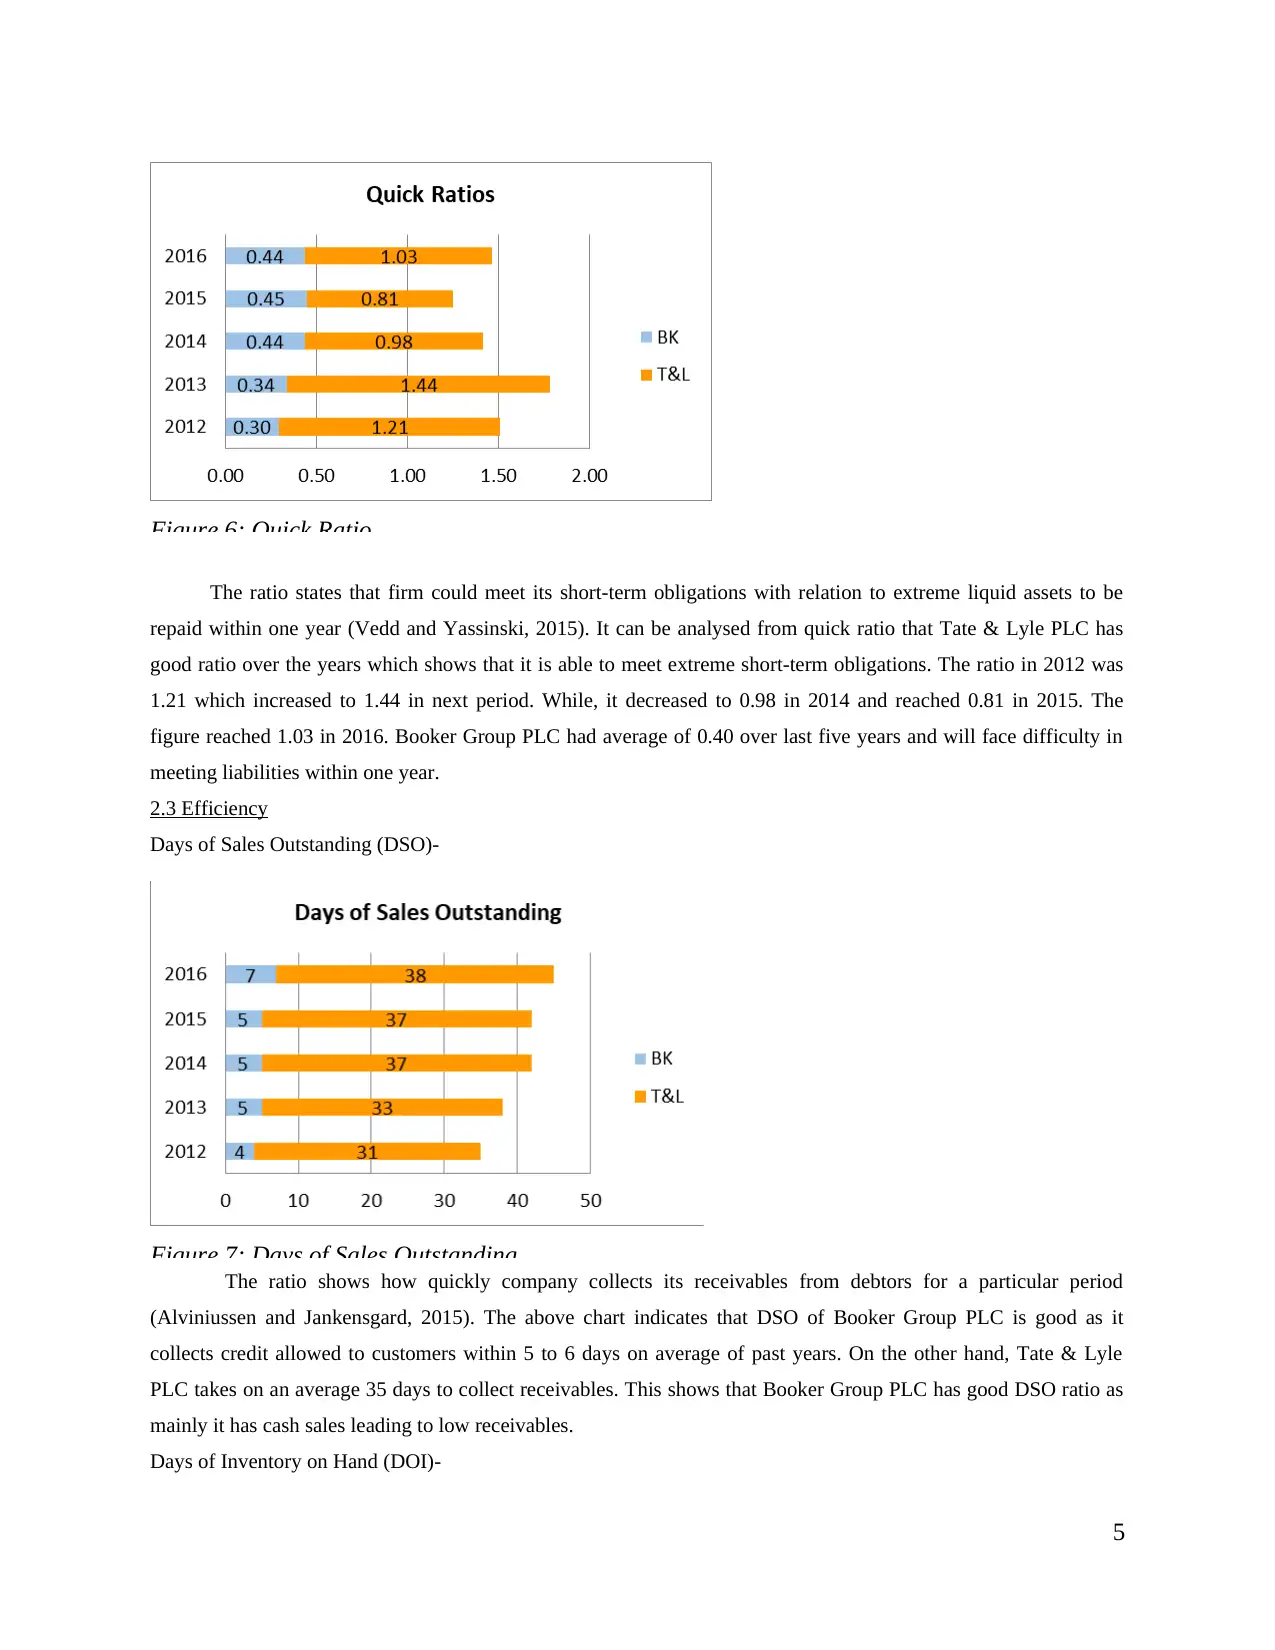
Figure 6: Quick Ratio
The ratio states that firm could meet its short-term obligations with relation to extreme liquid assets to be
repaid within one year (Vedd and Yassinski, 2015). It can be analysed from quick ratio that Tate & Lyle PLC has
good ratio over the years which shows that it is able to meet extreme short-term obligations. The ratio in 2012 was
1.21 which increased to 1.44 in next period. While, it decreased to 0.98 in 2014 and reached 0.81 in 2015. The
figure reached 1.03 in 2016. Booker Group PLC had average of 0.40 over last five years and will face difficulty in
meeting liabilities within one year.
2.3 Efficiency
Days of Sales Outstanding (DSO)-
Figure 7: Days of Sales Outstanding
The ratio shows how quickly company collects its receivables from debtors for a particular period
(Alviniussen and Jankensgard, 2015). The above chart indicates that DSO of Booker Group PLC is good as it
collects credit allowed to customers within 5 to 6 days on average of past years. On the other hand, Tate & Lyle
PLC takes on an average 35 days to collect receivables. This shows that Booker Group PLC has good DSO ratio as
mainly it has cash sales leading to low receivables.
Days of Inventory on Hand (DOI)-
5
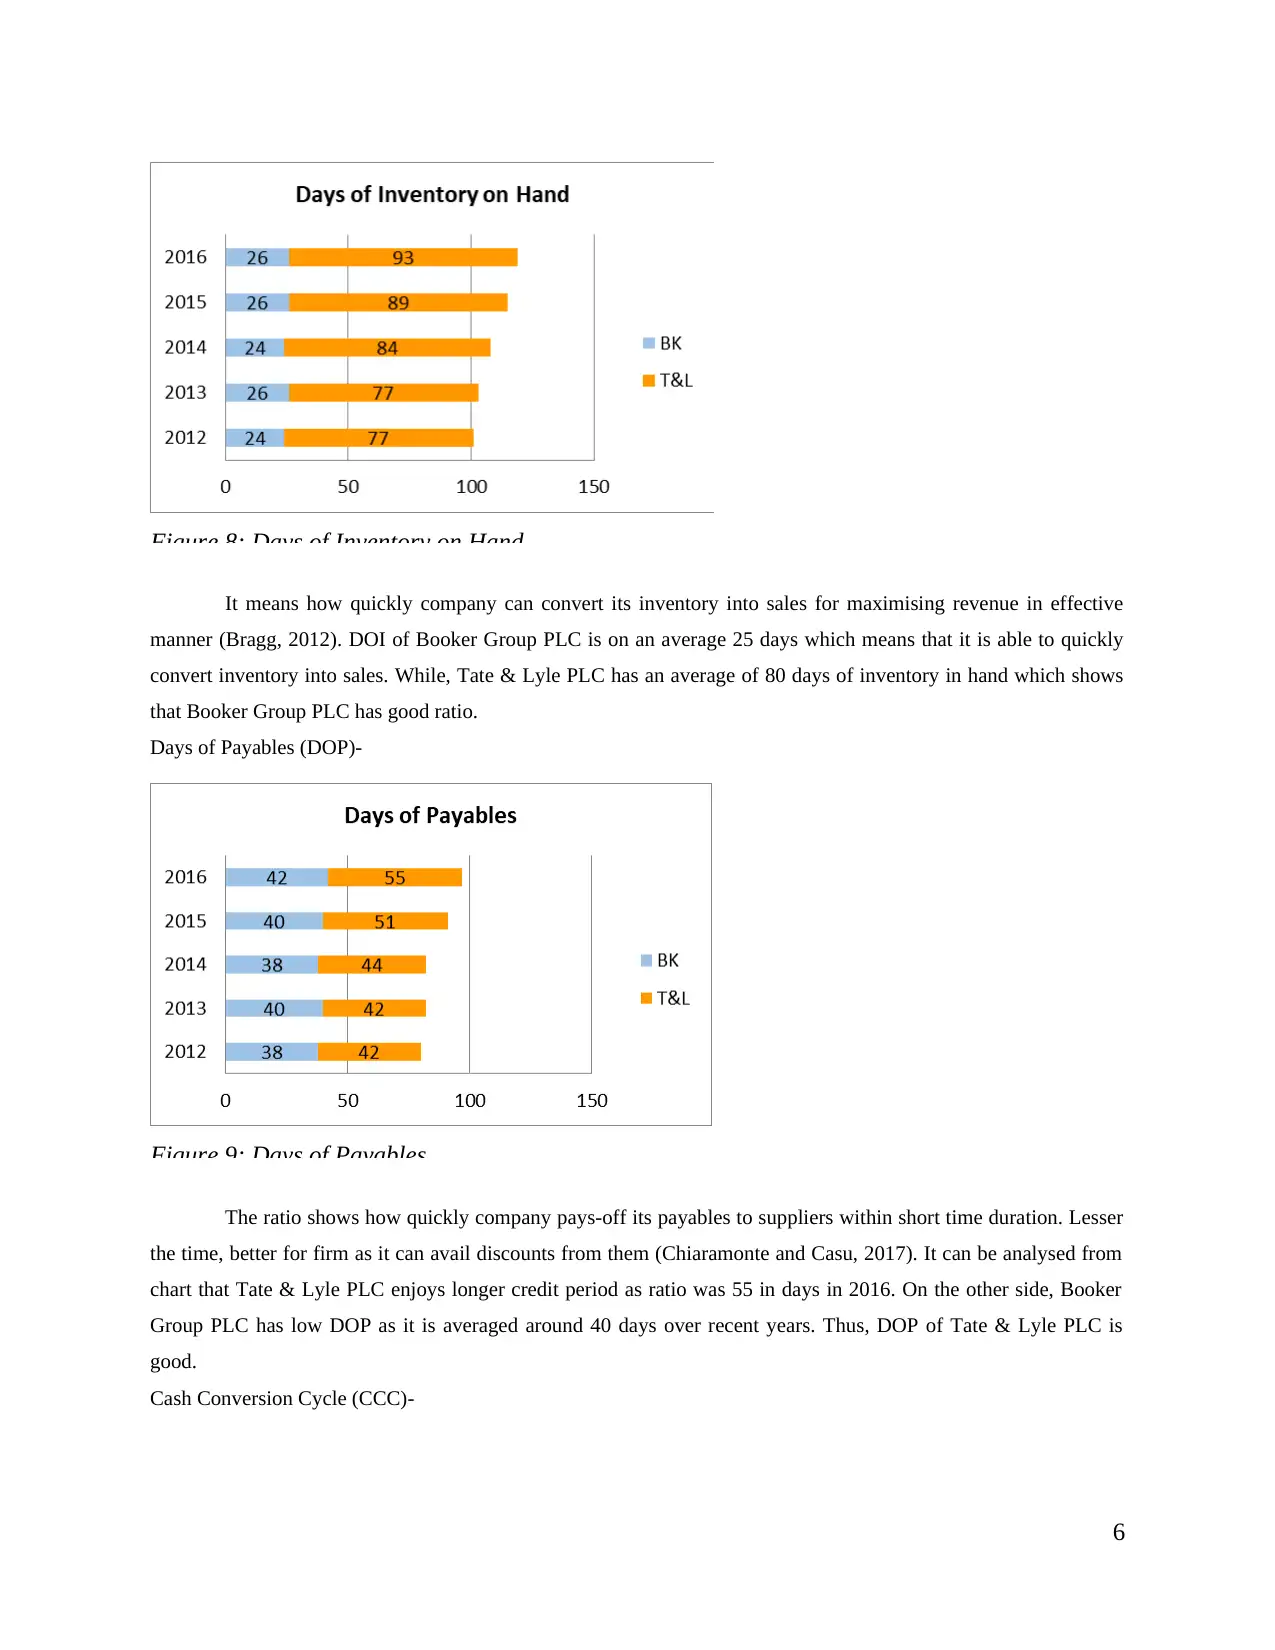
Figure 8: Days of Inventory on Hand
It means how quickly company can convert its inventory into sales for maximising revenue in effective
manner (Bragg, 2012). DOI of Booker Group PLC is on an average 25 days which means that it is able to quickly
convert inventory into sales. While, Tate & Lyle PLC has an average of 80 days of inventory in hand which shows
that Booker Group PLC has good ratio.
Days of Payables (DOP)-
Figure 9: Days of Payables
The ratio shows how quickly company pays-off its payables to suppliers within short time duration. Lesser
the time, better for firm as it can avail discounts from them (Chiaramonte and Casu, 2017). It can be analysed from
chart that Tate & Lyle PLC enjoys longer credit period as ratio was 55 in days in 2016. On the other side, Booker
Group PLC has low DOP as it is averaged around 40 days over recent years. Thus, DOP of Tate & Lyle PLC is
good.
Cash Conversion Cycle (CCC)-
6
⊘ This is a preview!⊘
Do you want full access?
Subscribe today to unlock all pages.
Trusted by 1+ million students worldwide
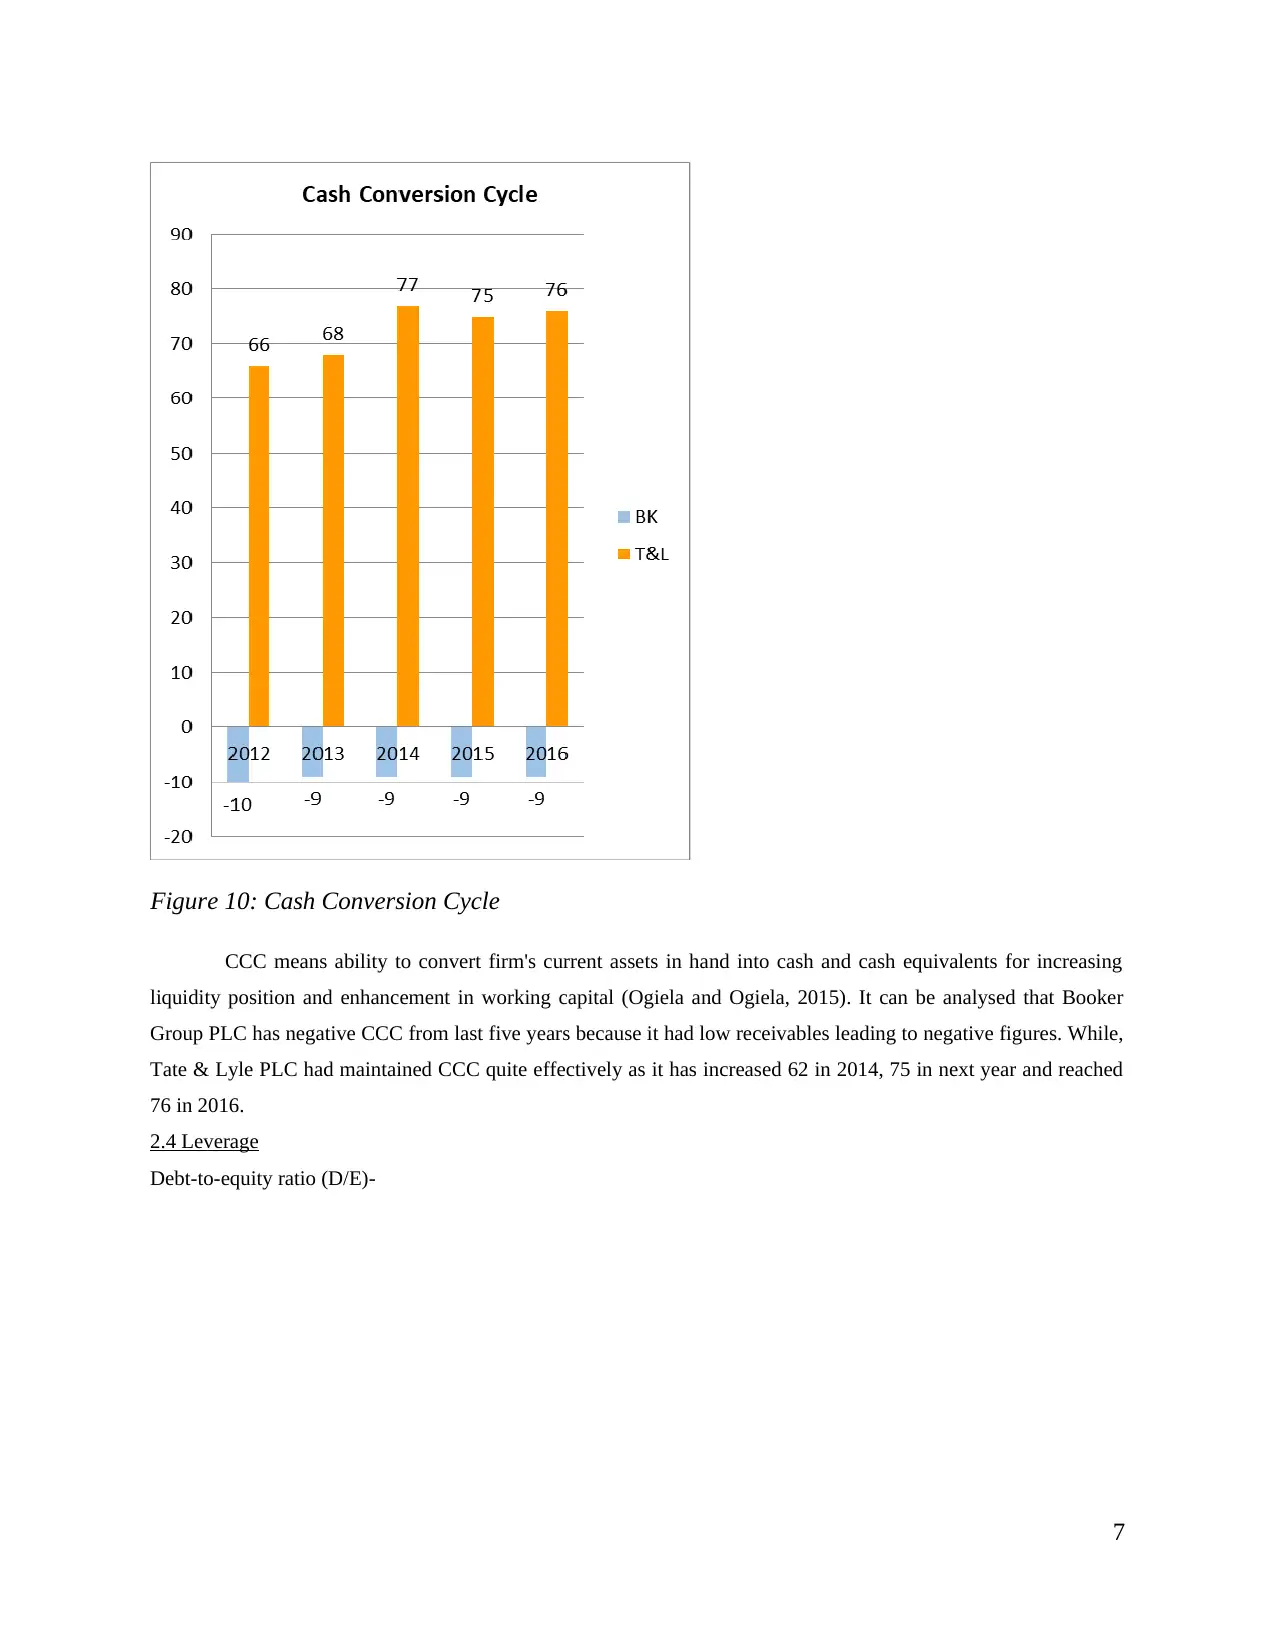
Figure 10: Cash Conversion Cycle
CCC means ability to convert firm's current assets in hand into cash and cash equivalents for increasing
liquidity position and enhancement in working capital (Ogiela and Ogiela, 2015). It can be analysed that Booker
Group PLC has negative CCC from last five years because it had low receivables leading to negative figures. While,
Tate & Lyle PLC had maintained CCC quite effectively as it has increased 62 in 2014, 75 in next year and reached
76 in 2016.
2.4 Leverage
Debt-to-equity ratio (D/E)-
7
Paraphrase This Document
Need a fresh take? Get an instant paraphrase of this document with our AI Paraphraser
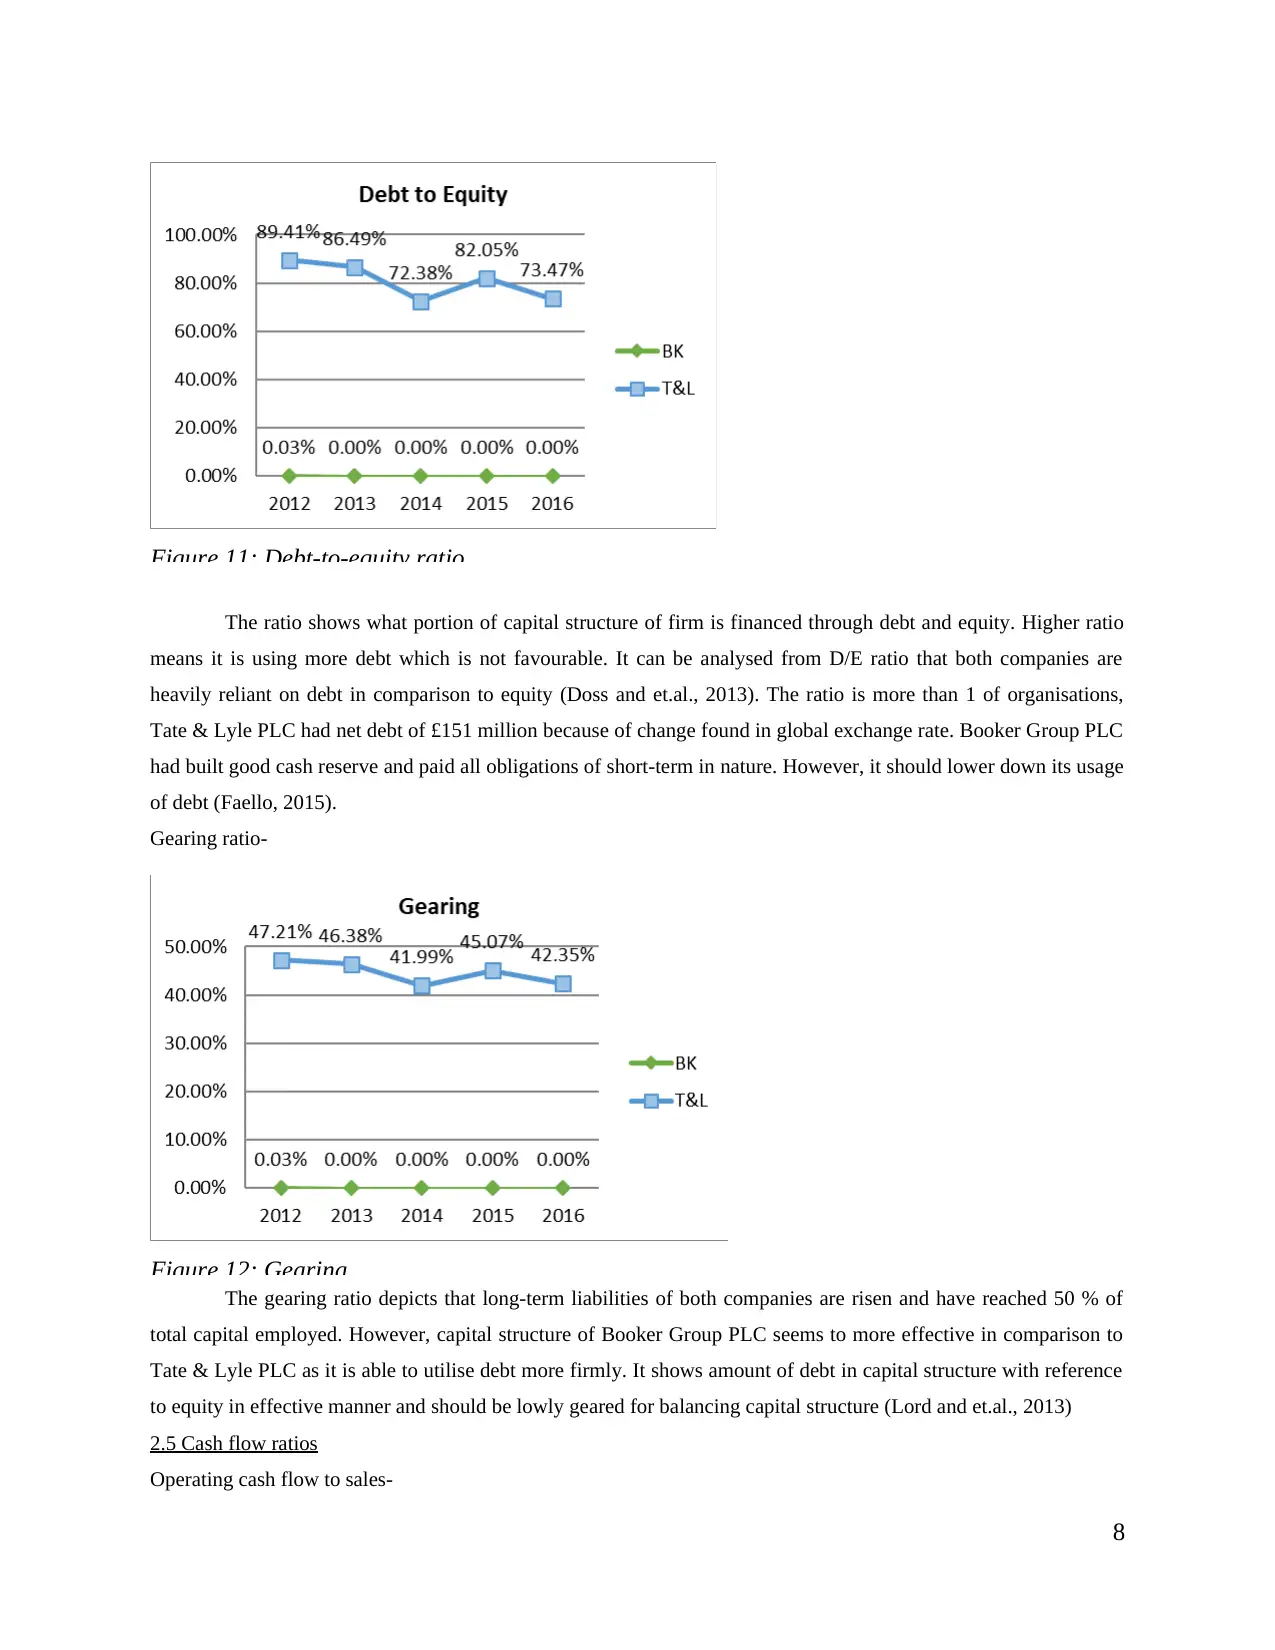
Figure 11: Debt-to-equity ratio
The ratio shows what portion of capital structure of firm is financed through debt and equity. Higher ratio
means it is using more debt which is not favourable. It can be analysed from D/E ratio that both companies are
heavily reliant on debt in comparison to equity (Doss and et.al., 2013). The ratio is more than 1 of organisations,
Tate & Lyle PLC had net debt of £151 million because of change found in global exchange rate. Booker Group PLC
had built good cash reserve and paid all obligations of short-term in nature. However, it should lower down its usage
of debt (Faello, 2015).
Gearing ratio-
Figure 12: Gearing
The gearing ratio depicts that long-term liabilities of both companies are risen and have reached 50 % of
total capital employed. However, capital structure of Booker Group PLC seems to more effective in comparison to
Tate & Lyle PLC as it is able to utilise debt more firmly. It shows amount of debt in capital structure with reference
to equity in effective manner and should be lowly geared for balancing capital structure (Lord and et.al., 2013)
2.5 Cash flow ratios
Operating cash flow to sales-
8
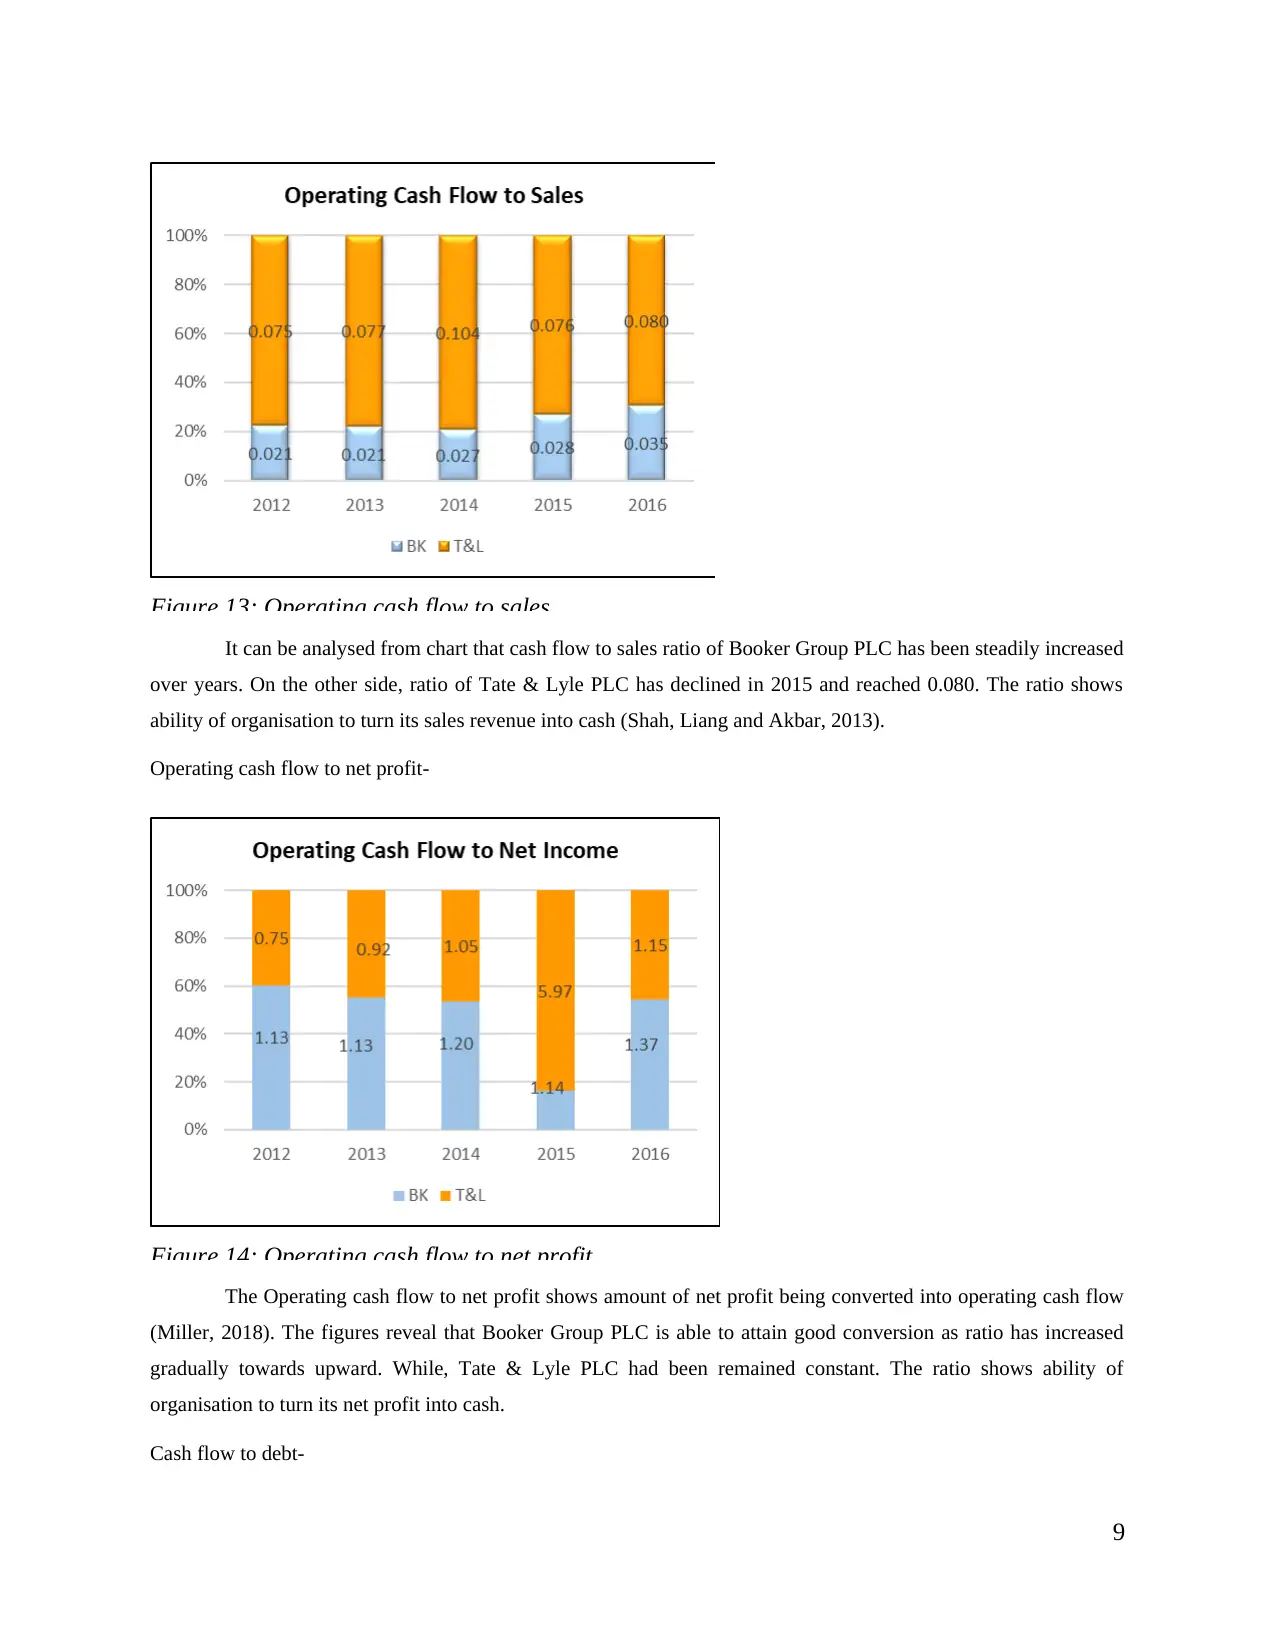
Figure 13: Operating cash flow to sales
It can be analysed from chart that cash flow to sales ratio of Booker Group PLC has been steadily increased
over years. On the other side, ratio of Tate & Lyle PLC has declined in 2015 and reached 0.080. The ratio shows
ability of organisation to turn its sales revenue into cash (Shah, Liang and Akbar, 2013).
Operating cash flow to net profit-
Figure 14: Operating cash flow to net profit
The Operating cash flow to net profit shows amount of net profit being converted into operating cash flow
(Miller, 2018). The figures reveal that Booker Group PLC is able to attain good conversion as ratio has increased
gradually towards upward. While, Tate & Lyle PLC had been remained constant. The ratio shows ability of
organisation to turn its net profit into cash.
Cash flow to debt-
9
⊘ This is a preview!⊘
Do you want full access?
Subscribe today to unlock all pages.
Trusted by 1+ million students worldwide
1 out of 46
Related Documents


Your All-in-One AI-Powered Toolkit for Academic Success.
+13062052269
info@desklib.com
Available 24*7 on WhatsApp / Email
![[object Object]](/_next/static/media/star-bottom.7253800d.svg)
Unlock your academic potential
Copyright © 2020–2026 A2Z Services. All Rights Reserved. Developed and managed by ZUCOL.