Strategic Financial Analysis Report: Booker and Tate & Lyle Comparison
VerifiedAdded on 2020/02/03
|22
|5476
|180
Report
AI Summary
This report presents a strategic financial analysis (SFA) of Booker and Tate & Lyle, two companies in the food and beverage sector. The analysis employs various financial techniques, including ratio analysis (profitability, liquidity, efficiency, and leverage), common size analysis (vertical and horizontal), and Du Pont analysis, to assess their financial performance over a five-year period (2012-2016). The report delves into the companies' backgrounds, the techniques used, and the merits and demerits of each analytical method. The core of the report involves calculating and interpreting key financial ratios to evaluate profitability, liquidity, efficiency, and leverage. It also includes an overview of contemporary methods like CAPM, EMH, and EVA. The report concludes with recommendations based on the findings, offering insights into the financial strengths and weaknesses of each company, and highlighting areas for improvement. The goal is to clarify the role of strategic financial analysis by determining their importance in the current business.
STRATEGIC FINANCIAL
ANALYSIS
ANALYSIS
Paraphrase This Document
Need a fresh take? Get an instant paraphrase of this document with our AI Paraphraser
Table of Contents
1. INTRODUCTION.......................................................................................................................4
1.1 Define SFA and importance of financial analysis............................................................4
1.2 Assignment objectives......................................................................................................4
1.3 Background of selected companies..................................................................................4
1.4 Techniques used throughout the report............................................................................5
2. RATIO ANALYSIS.....................................................................................................................5
2.1 Profitability.......................................................................................................................5
2.2 Liquidity...........................................................................................................................6
2.3 Efficiency.........................................................................................................................8
2.4 Leverage...........................................................................................................................9
2.5 Investors.........................................................................................................................10
3.0 Common size analysis..............................................................................................................11
3.1 Vertical analysis.............................................................................................................11
3.2 Horizontal analysis.........................................................................................................11
3.3 Du Pont analysis.............................................................................................................11
3.4 Segment analysis............................................................................................................11
4.0 MERITS AND DEMERITS....................................................................................................12
4.1 Ratio analysis..................................................................................................................12
4.2 Common size..................................................................................................................12
4.3 Du Pont...........................................................................................................................13
4.4 Segment analysis............................................................................................................13
5.0 CONCLUSIONS AND RECOMMENDATIONS..................................................................13
5.1 Conclusions....................................................................................................................13
5.2 Recommendations..........................................................................................................14
6.0 CONTEMPORARY METHODS ANALYSIS.......................................................................14
6.1 CAPM.............................................................................................................................14
6.2 EMH...............................................................................................................................14
6.3 EVA................................................................................................................................15
REFERENCES..............................................................................................................................16
APPENDICES.................................................................................................................................1
1. INTRODUCTION
1.1 Define SFA and importance of financial analysis
Strategic financial analysis is that approach commonly used by an entity which consists
of setting end goals and then analysing all the ways of completing the goals. It is that analysis in
which different tools and techniques are used as personnel of this entity will use specific tactics
to reach their specific goals (Braveman, 2016). There are some importance of this analysis which
will assists an enterprise in uplifting their existing situations. It is helpful for an entity in
preparing budgets which is basic form of financial analysis in SFA. The future upcoming cash
flows are forecasted by ascertaining the present the facts and figures. This analysis is also
responsible for conducting price analysis in which external market forces are identified in order
to determine price of an enterprise. In the price analysis the main aim of the owner is to generate
high sales volume at higher prices by determining the external elasticity of demand in the overall
market. The primary objective of this assignment is to clarify the role of strategic financial
analysis by determining their importance in the current business.
1.2 Assignment objectives
Two companies has been selected for this project report such as Booker and Tate&Lyle
among which financial comparison has been done by applying various techniques of strategic
financial analysis. Financial ratios has been calculated by commenting upon the business
efficiency of 5 years in order to take further step in the business in order to select or reject the
current project or expanding with another business.
1.3 Background of selected companies
Booker is one of the company selected for assessing its internal business functioning for
the given project (Agarwal and Green, 2016). It is one of the famous food and beverage entity
operated their business in the United Kingdom which provides their products or services as a
wholesaler. It deals in variety of products such as macro, booker direct, classic drinks, Ritter
courivaud, chef direct, premier, family shopper in order to cater the needs of customers. It is the
biggest strengths is that current it is serving about 1.5 million customers. It is regarded as the
largest cash and carry operator in the UK which are privileged to served around 18000 product
lines ranging from different price and brand ranges according to the budget of an individual. It
⊘ This is a preview!⊘
Do you want full access?
Subscribe today to unlock all pages.
Trusted by 1+ million students worldwide
also works as retailer business but major sales and the revenue comes from the wholesaling
business.
Tate&Lyle is multinational business entity which is based in the British agribusiness
which deals in the food and beverage sectors. This enterprise has also listed in the London stock
exchange with a constituent of FTSE 250 indexes. This enterprise specialises in the innovative
technology which is applied in providing all kinds of products (Hasan and Kobeissi, 2016). The
technology has used to transform different raw materials into finished products without affecting
their nutrients. These materials whose nutritional level will enhance by using these methods such
as corn, tapioca and oats. The main emphasises of this entity is on using all kinds of organic
materials by avoiding chemicals and artificial in the food as health is the key to keep fit and
health is the basic motto of this firm It operated with round 25 manufacture facilities and good
network of research and development centres all across the world. The income and financial
conditions has raised due to several good decisions taken by this enterprise such as
diversification approach in which entering into another markets will be beneficial for an entity.
1.4 Techniques used throughout the report
This assignment gives greater importance to all the techniques used by an entity by using
different methods of analysis in assessing the business efficiency of both the selected entities.
The profitability of this entity will be ascertained by applying profitability ratios. The liquidity
has been ascertained by calculating current ratios which will determine available cash balance
held with an enterprise (Braveman, 2016). The business efficiency are determined by calculating
asset turnover and inventory turnover. Leverage can be found out which reflects financial health
of both the enterprise. These ratios will be helpful for all the investors in order accept or reject
the decision of investing in the business. Du-pont analysis which will break ROCE in three
different parts. Cash flow analysis has been used to know the movement of cash flow and cash
outflow from the business. Common size balance sheet are prepared which is a comparative
analysis of a previous year.
2. RATIO ANALYSIS
2.1 Profitability
Table 1: Profitability ratios of Booker
Ratios Formula 2012 2013 2014 2015 2016
Paraphrase This Document
Need a fresh take? Get an instant paraphrase of this document with our AI Paraphraser
Profitabilit
y
GP ratios GP/Net
sales*100
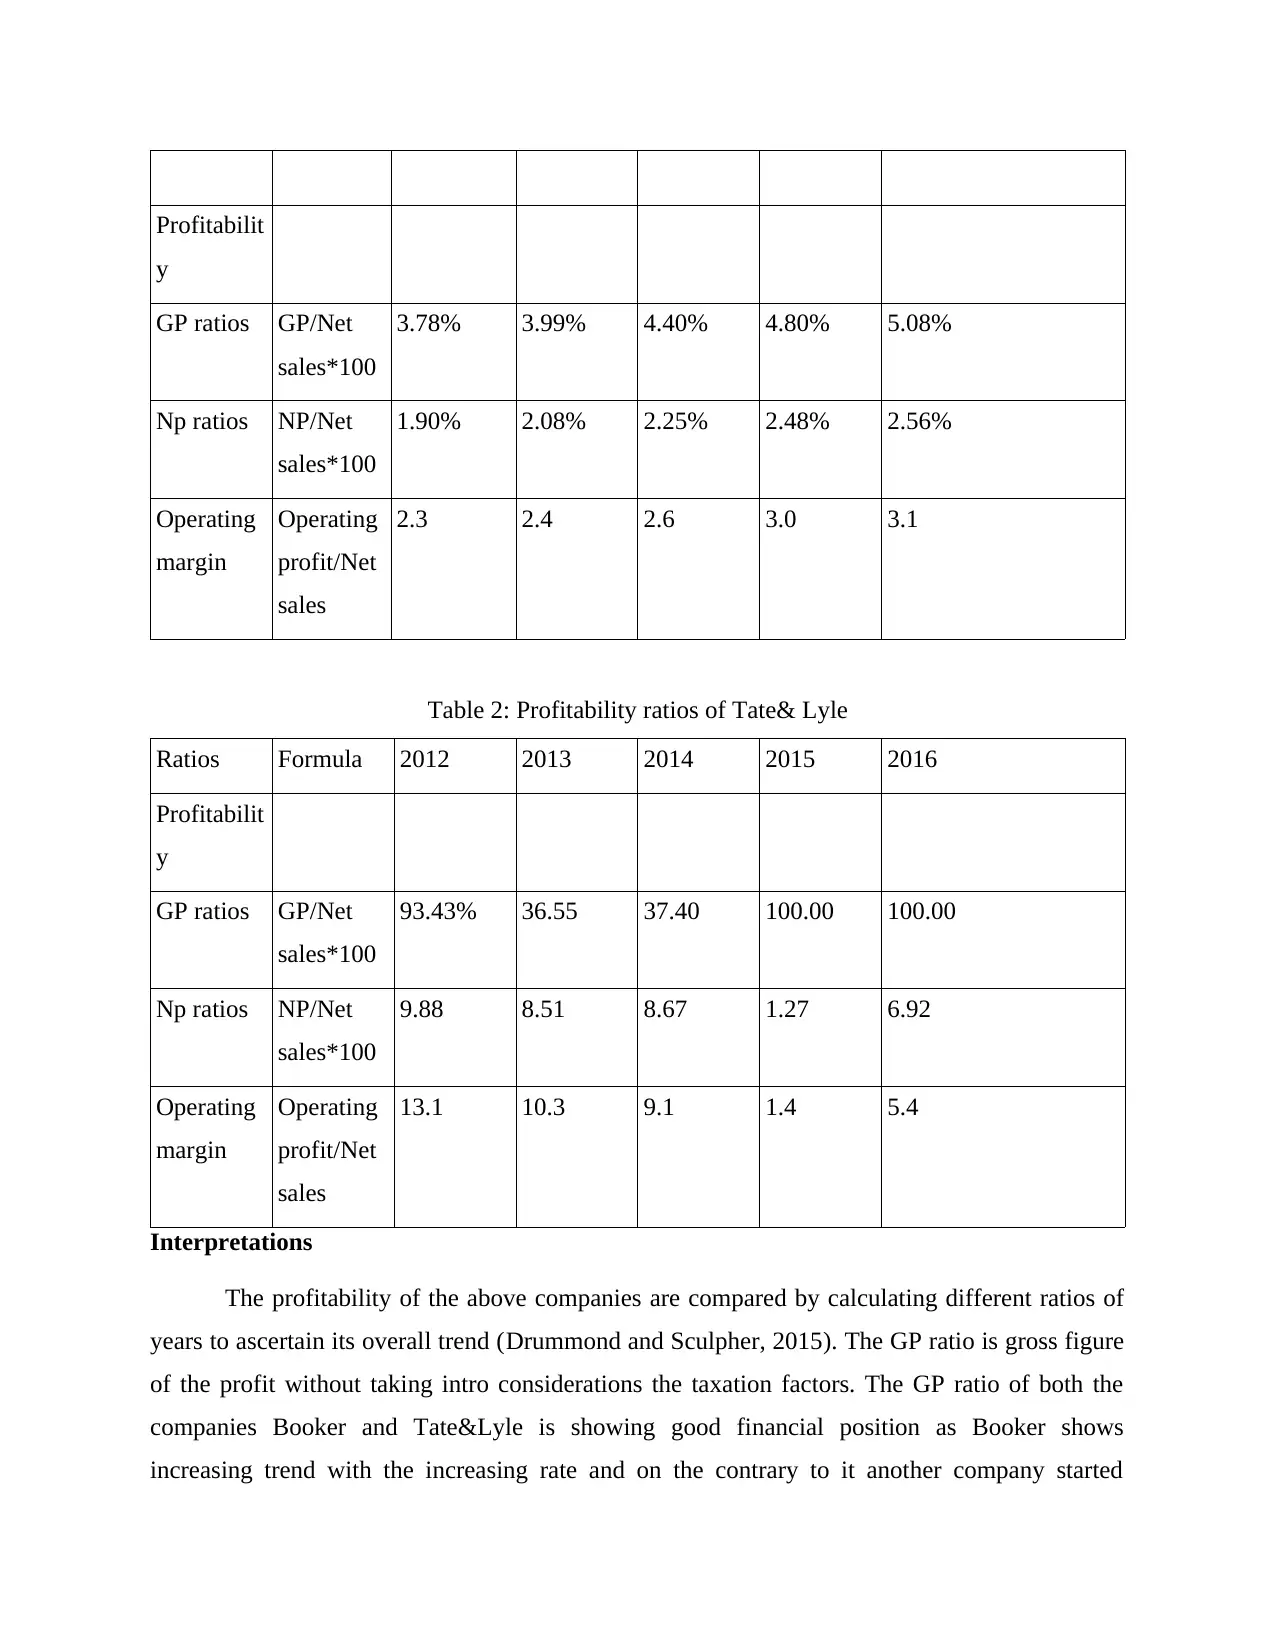
3.78% 3.99% 4.40% 4.80% 5.08%
Np ratios NP/Net
sales*100
1.90% 2.08% 2.25% 2.48% 2.56%
Operating
margin
Operating
profit/Net
sales
2.3 2.4 2.6 3.0 3.1
Table 2: Profitability ratios of Tate& Lyle
Ratios Formula 2012 2013 2014 2015 2016
Profitabilit
y
GP ratios GP/Net
sales*100
93.43% 36.55 37.40 100.00 100.00
Np ratios NP/Net
sales*100
9.88 8.51 8.67 1.27 6.92
Operating
margin
Operating
profit/Net
sales
13.1 10.3 9.1 1.4 5.4
Interpretations
The profitability of the above companies are compared by calculating different ratios of
years to ascertain its overall trend (Drummond and Sculpher, 2015). The GP ratio is gross figure
of the profit without taking intro considerations the taxation factors. The GP ratio of both the
companies Booker and Tate&Lyle is showing good financial position as Booker shows
increasing trend with the increasing rate and on the contrary to it another company started
y
GP ratios GP/Net
sales*100
3.78% 3.99% 4.40% 4.80% 5.08%
Np ratios NP/Net
sales*100
1.90% 2.08% 2.25% 2.48% 2.56%
Operating
margin
Operating
profit/Net
sales
2.3 2.4 2.6 3.0 3.1
Table 2: Profitability ratios of Tate& Lyle
Ratios Formula 2012 2013 2014 2015 2016
Profitabilit
y
GP ratios GP/Net
sales*100
93.43% 36.55 37.40 100.00 100.00
Np ratios NP/Net
sales*100
9.88 8.51 8.67 1.27 6.92
Operating
margin
Operating
profit/Net
sales
13.1 10.3 9.1 1.4 5.4
Interpretations
The profitability of the above companies are compared by calculating different ratios of
years to ascertain its overall trend (Drummond and Sculpher, 2015). The GP ratio is gross figure
of the profit without taking intro considerations the taxation factors. The GP ratio of both the
companies Booker and Tate&Lyle is showing good financial position as Booker shows
increasing trend with the increasing rate and on the contrary to it another company started
initially with higher and in end two years shows 100% efficiency and in middle shows lack of
progress. Again the NP ratios are increasing again and Tate&Lyle shows fewer efforts. The slow
steady approach again proves to be beneficial as their operating profit are shown good profit
trends as compared to the other companies.
2.2 Liquidity
Table 3: Liquidity ratio of Booker
Ratios Formula 2012 2013 2014 2015 2016
Liquidity
Current
ratios
Current
asset/Curr
ent
liabilities
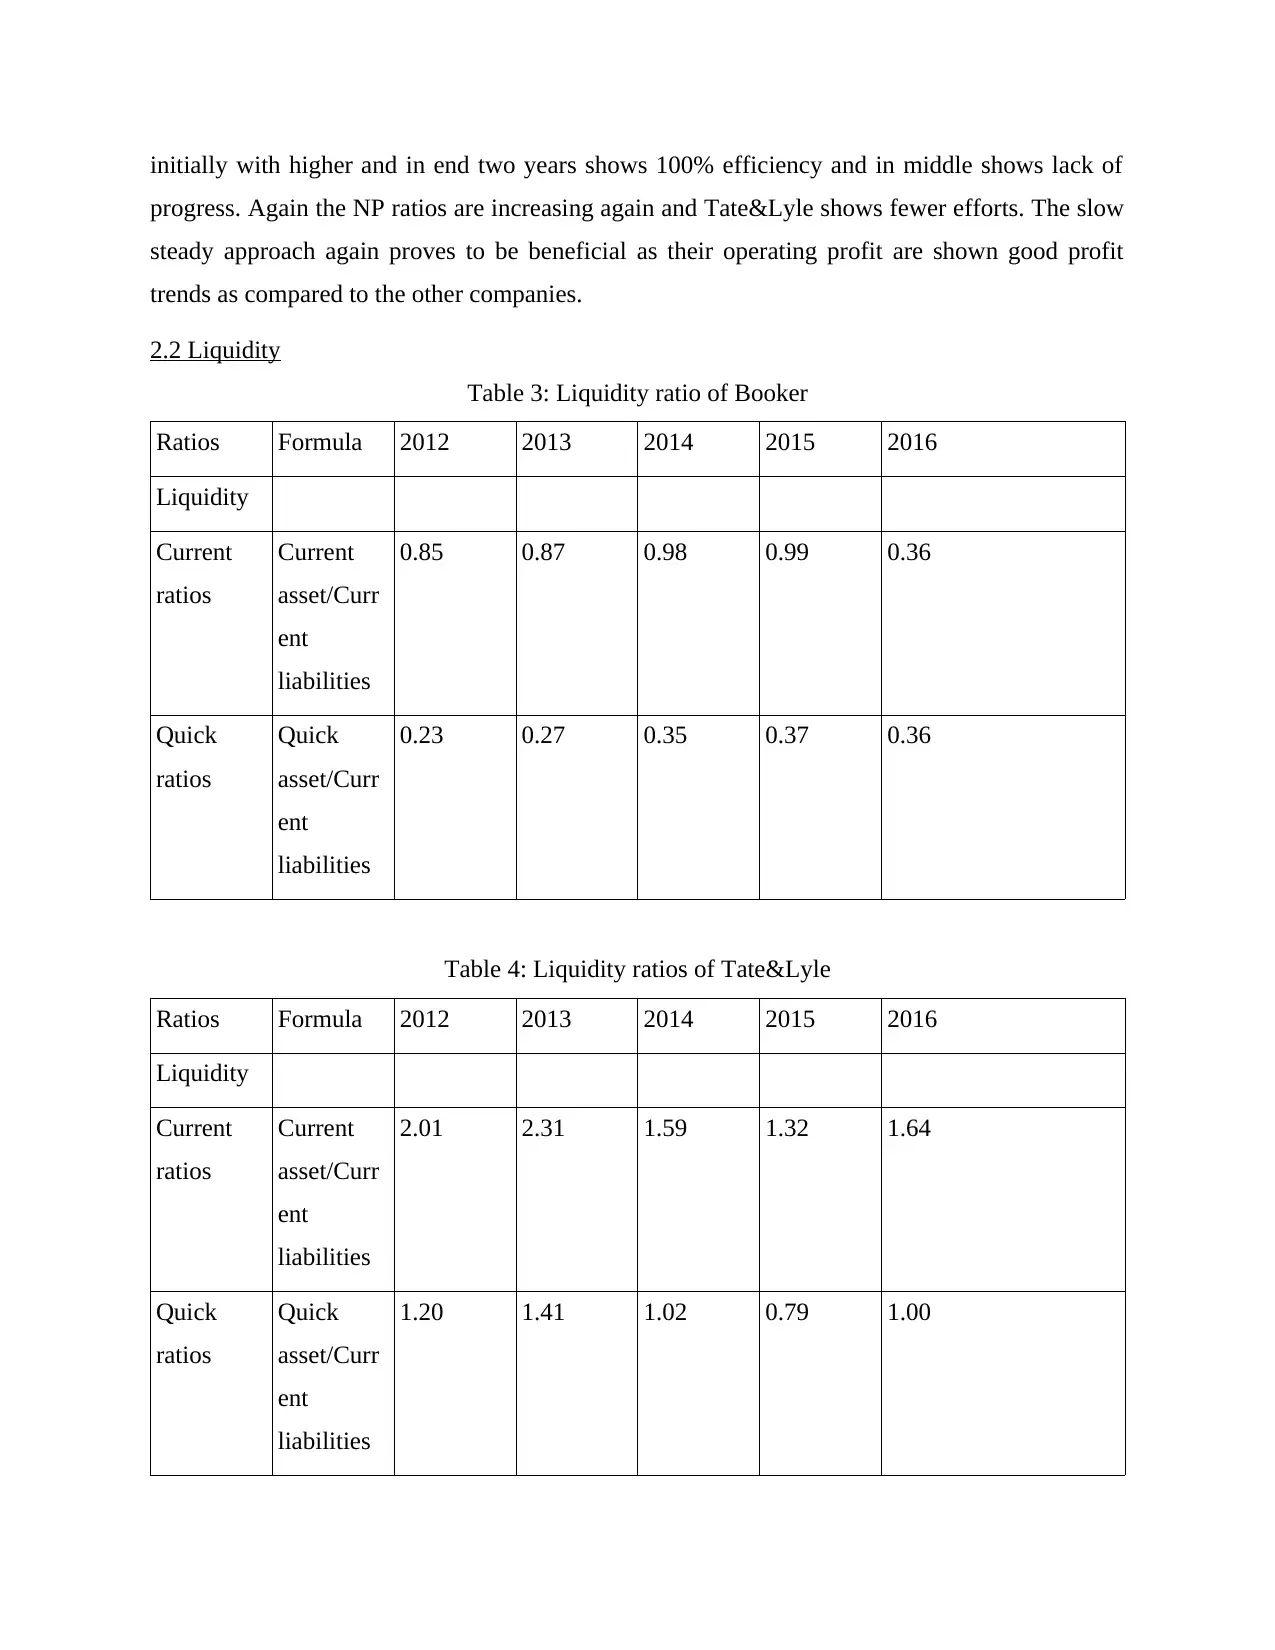
0.85 0.87 0.98 0.99 0.36
Quick
ratios
Quick
asset/Curr
ent
liabilities
0.23 0.27 0.35 0.37 0.36
Table 4: Liquidity ratios of Tate&Lyle
Ratios Formula 2012 2013 2014 2015 2016
Liquidity
Current
ratios
Current
asset/Curr
ent
liabilities
2.01 2.31 1.59 1.32 1.64
Quick
ratios
Quick
asset/Curr
ent
liabilities
1.20 1.41 1.02 0.79 1.00
progress. Again the NP ratios are increasing again and Tate&Lyle shows fewer efforts. The slow
steady approach again proves to be beneficial as their operating profit are shown good profit
trends as compared to the other companies.
2.2 Liquidity
Table 3: Liquidity ratio of Booker
Ratios Formula 2012 2013 2014 2015 2016
Liquidity
Current
ratios
Current
asset/Curr
ent
liabilities
0.85 0.87 0.98 0.99 0.36
Quick
ratios
Quick
asset/Curr
ent
liabilities
0.23 0.27 0.35 0.37 0.36
Table 4: Liquidity ratios of Tate&Lyle
Ratios Formula 2012 2013 2014 2015 2016
Liquidity
Current
ratios
Current
asset/Curr
ent
liabilities
2.01 2.31 1.59 1.32 1.64
Quick
ratios
Quick
asset/Curr
ent
liabilities
1.20 1.41 1.02 0.79 1.00
⊘ This is a preview!⊘
Do you want full access?
Subscribe today to unlock all pages.
Trusted by 1+ million students worldwide
Interpretations
Liquidity ratios of the business enterprise will show available cash balance held with an
enterprise in order to meet their short term obligations (Agarwal and Green, 2016). When the
current ratios are constant trend has been identified then in that situation Booker has generated
good ratios but less than one. On the other hand, another entity has higher ratio greater than one
but not in a systematic way. Other ratio is quick assets which ascertained the business efficiency
by excluding the inventory from the current assets. Booker shows upward with increasing rate
and Tate&Lyle generates lower ratios towards the downward position.
2.3 Efficiency
Table 5: Efficiency ratios of Booker
Ratios Formula 2012 2013 2014 2015 2016
Efficiency
Asset
turnover
Total
assets/Net
sales4.37
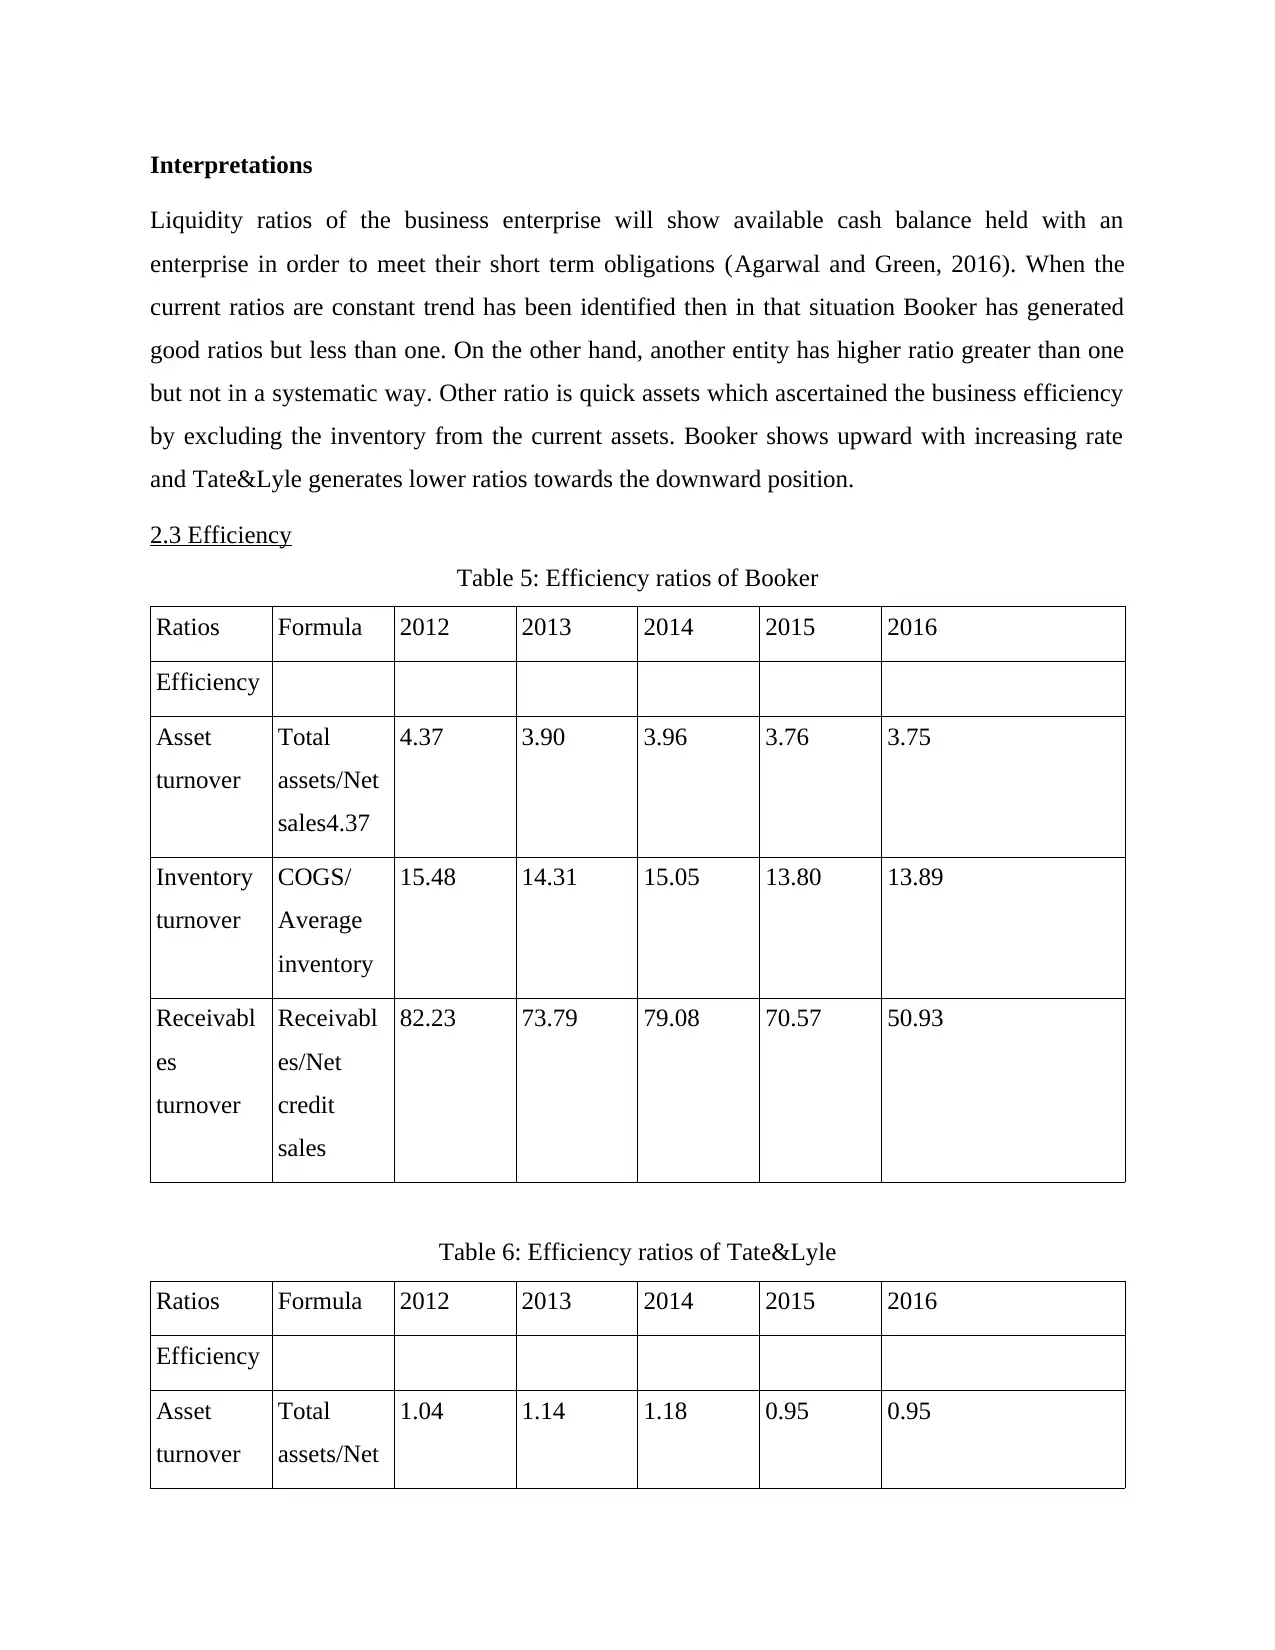
4.37 3.90 3.96 3.76 3.75
Inventory
turnover
COGS/
Average
inventory
15.48 14.31 15.05 13.80 13.89
Receivabl
es
turnover
Receivabl
es/Net
credit
sales
82.23 73.79 79.08 70.57 50.93
Table 6: Efficiency ratios of Tate&Lyle
Ratios Formula 2012 2013 2014 2015 2016
Efficiency
Asset
turnover
Total
assets/Net
1.04 1.14 1.18 0.95 0.95
Liquidity ratios of the business enterprise will show available cash balance held with an
enterprise in order to meet their short term obligations (Agarwal and Green, 2016). When the
current ratios are constant trend has been identified then in that situation Booker has generated
good ratios but less than one. On the other hand, another entity has higher ratio greater than one
but not in a systematic way. Other ratio is quick assets which ascertained the business efficiency
by excluding the inventory from the current assets. Booker shows upward with increasing rate
and Tate&Lyle generates lower ratios towards the downward position.
2.3 Efficiency
Table 5: Efficiency ratios of Booker
Ratios Formula 2012 2013 2014 2015 2016
Efficiency
Asset
turnover
Total
assets/Net
sales4.37
4.37 3.90 3.96 3.76 3.75
Inventory
turnover
COGS/
Average
inventory
15.48 14.31 15.05 13.80 13.89
Receivabl
es
turnover
Receivabl
es/Net
credit
sales
82.23 73.79 79.08 70.57 50.93
Table 6: Efficiency ratios of Tate&Lyle
Ratios Formula 2012 2013 2014 2015 2016
Efficiency
Asset
turnover
Total
assets/Net
1.04 1.14 1.18 0.95 0.95
Paraphrase This Document
Need a fresh take? Get an instant paraphrase of this document with our AI Paraphraser
sales
Inventory
turnover
COGS/
Average
inventory
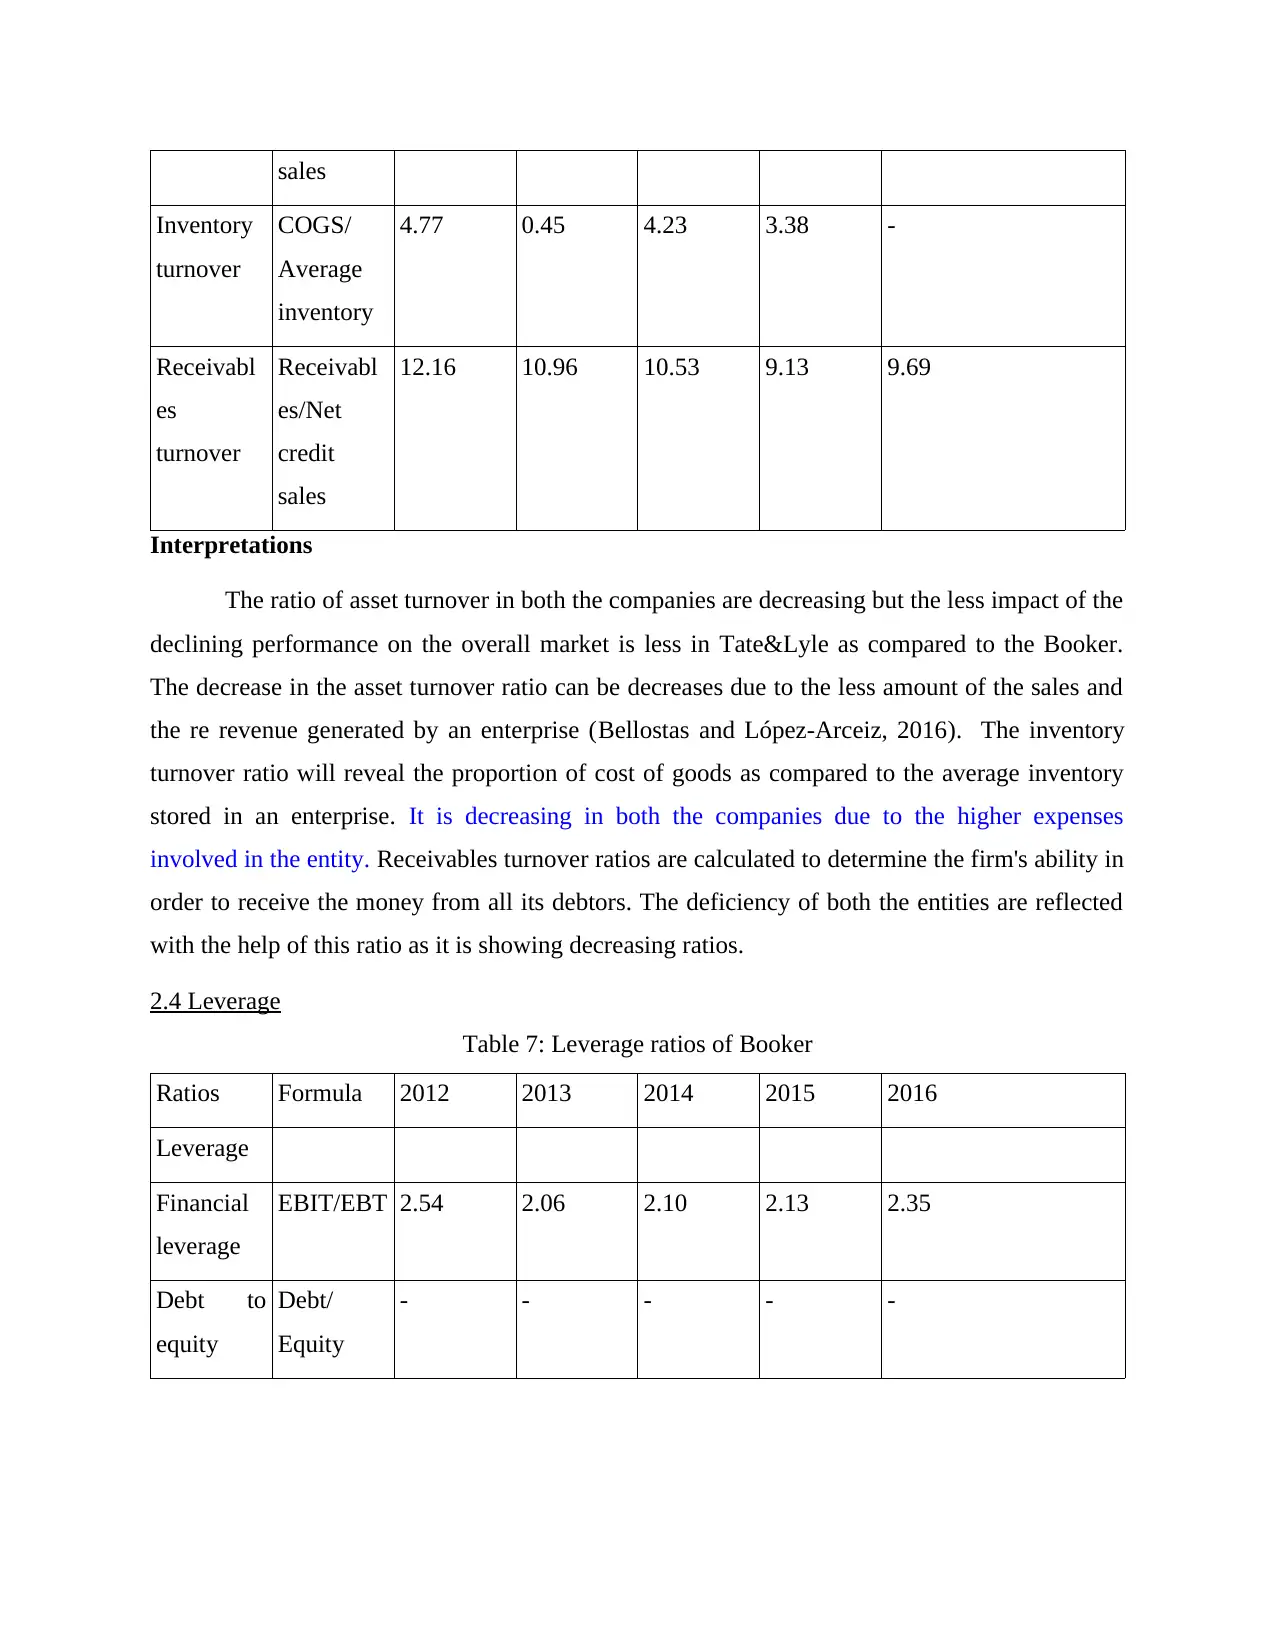
4.77 0.45 4.23 3.38 -
Receivabl
es
turnover
Receivabl
es/Net
credit
sales
12.16 10.96 10.53 9.13 9.69
Interpretations
The ratio of asset turnover in both the companies are decreasing but the less impact of the
declining performance on the overall market is less in Tate&Lyle as compared to the Booker.
The decrease in the asset turnover ratio can be decreases due to the less amount of the sales and
the re revenue generated by an enterprise (Bellostas and López-Arceiz, 2016). The inventory
turnover ratio will reveal the proportion of cost of goods as compared to the average inventory
stored in an enterprise. It is decreasing in both the companies due to the higher expenses
involved in the entity. Receivables turnover ratios are calculated to determine the firm's ability in
order to receive the money from all its debtors. The deficiency of both the entities are reflected
with the help of this ratio as it is showing decreasing ratios.
2.4 Leverage
Table 7: Leverage ratios of Booker
Ratios Formula 2012 2013 2014 2015 2016
Leverage
Financial
leverage
EBIT/EBT 2.54 2.06 2.10 2.13 2.35
Debt to
equity
Debt/
Equity
- - - - -
Inventory
turnover
COGS/
Average
inventory
4.77 0.45 4.23 3.38 -
Receivabl
es
turnover
Receivabl
es/Net
credit
sales
12.16 10.96 10.53 9.13 9.69
Interpretations
The ratio of asset turnover in both the companies are decreasing but the less impact of the
declining performance on the overall market is less in Tate&Lyle as compared to the Booker.
The decrease in the asset turnover ratio can be decreases due to the less amount of the sales and
the re revenue generated by an enterprise (Bellostas and López-Arceiz, 2016). The inventory
turnover ratio will reveal the proportion of cost of goods as compared to the average inventory
stored in an enterprise. It is decreasing in both the companies due to the higher expenses
involved in the entity. Receivables turnover ratios are calculated to determine the firm's ability in
order to receive the money from all its debtors. The deficiency of both the entities are reflected
with the help of this ratio as it is showing decreasing ratios.
2.4 Leverage
Table 7: Leverage ratios of Booker
Ratios Formula 2012 2013 2014 2015 2016
Leverage
Financial
leverage
EBIT/EBT 2.54 2.06 2.10 2.13 2.35
Debt to
equity
Debt/
Equity
- - - - -
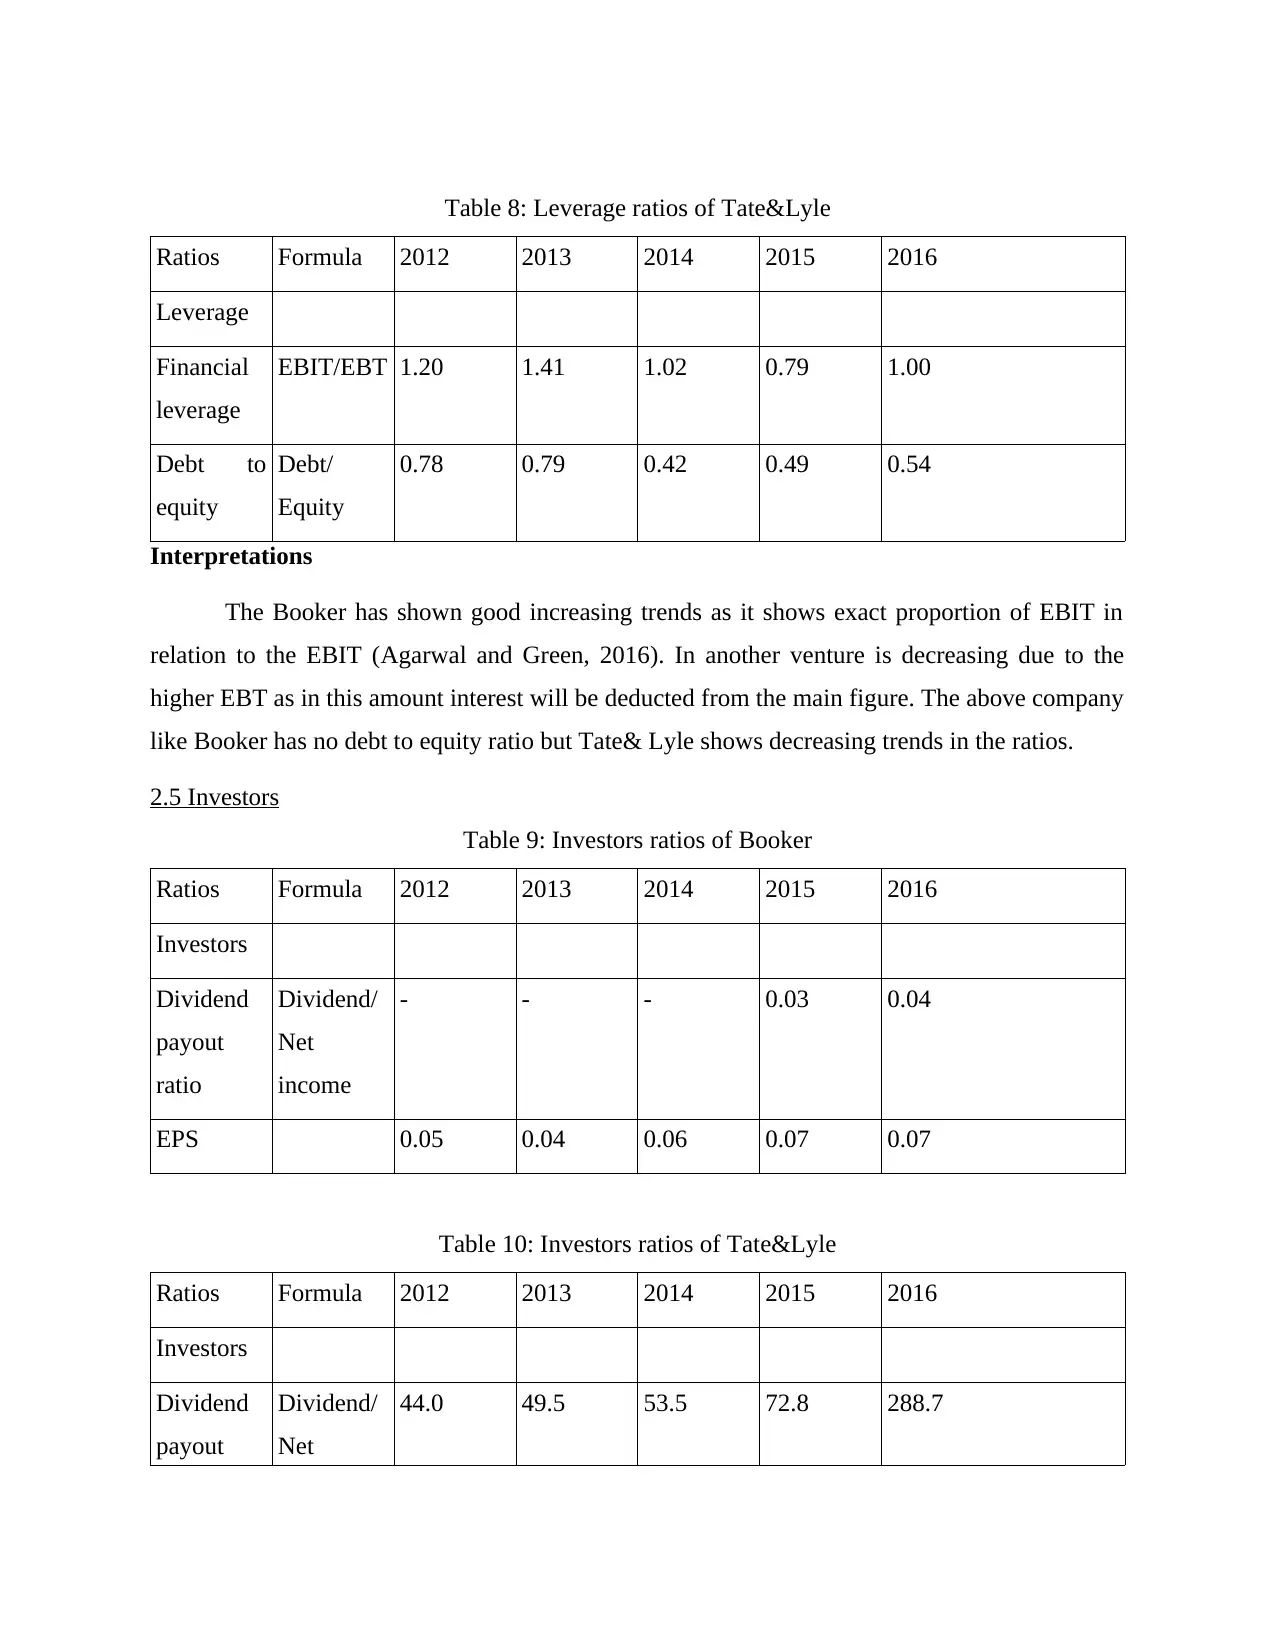
Table 8: Leverage ratios of Tate&Lyle
Ratios Formula 2012 2013 2014 2015 2016
Leverage
Financial
leverage
EBIT/EBT 1.20 1.41 1.02 0.79 1.00
Debt to
equity
Debt/
Equity
0.78 0.79 0.42 0.49 0.54
Interpretations
The Booker has shown good increasing trends as it shows exact proportion of EBIT in
relation to the EBIT (Agarwal and Green, 2016). In another venture is decreasing due to the
higher EBT as in this amount interest will be deducted from the main figure. The above company
like Booker has no debt to equity ratio but Tate& Lyle shows decreasing trends in the ratios.
2.5 Investors
Table 9: Investors ratios of Booker
Ratios Formula 2012 2013 2014 2015 2016
Investors
Dividend
payout
ratio
Dividend/
Net
income
- - - 0.03 0.04
EPS 0.05 0.04 0.06 0.07 0.07
Table 10: Investors ratios of Tate&Lyle
Ratios Formula 2012 2013 2014 2015 2016
Investors
Dividend
payout
Dividend/
Net
44.0 49.5 53.5 72.8 288.7
Ratios Formula 2012 2013 2014 2015 2016
Leverage
Financial
leverage
EBIT/EBT 1.20 1.41 1.02 0.79 1.00
Debt to
equity
Debt/
Equity
0.78 0.79 0.42 0.49 0.54
Interpretations
The Booker has shown good increasing trends as it shows exact proportion of EBIT in
relation to the EBIT (Agarwal and Green, 2016). In another venture is decreasing due to the
higher EBT as in this amount interest will be deducted from the main figure. The above company
like Booker has no debt to equity ratio but Tate& Lyle shows decreasing trends in the ratios.
2.5 Investors
Table 9: Investors ratios of Booker
Ratios Formula 2012 2013 2014 2015 2016
Investors
Dividend
payout
ratio
Dividend/
Net
income
- - - 0.03 0.04
EPS 0.05 0.04 0.06 0.07 0.07
Table 10: Investors ratios of Tate&Lyle
Ratios Formula 2012 2013 2014 2015 2016
Investors
Dividend
payout
Dividend/
Net
44.0 49.5 53.5 72.8 288.7
⊘ This is a preview!⊘
Do you want full access?
Subscribe today to unlock all pages.
Trusted by 1+ million students worldwide
ratio income
EPS Income for
equity
holders/N
umber of
shares
0.64 0.57 0.58 0.07 0.34
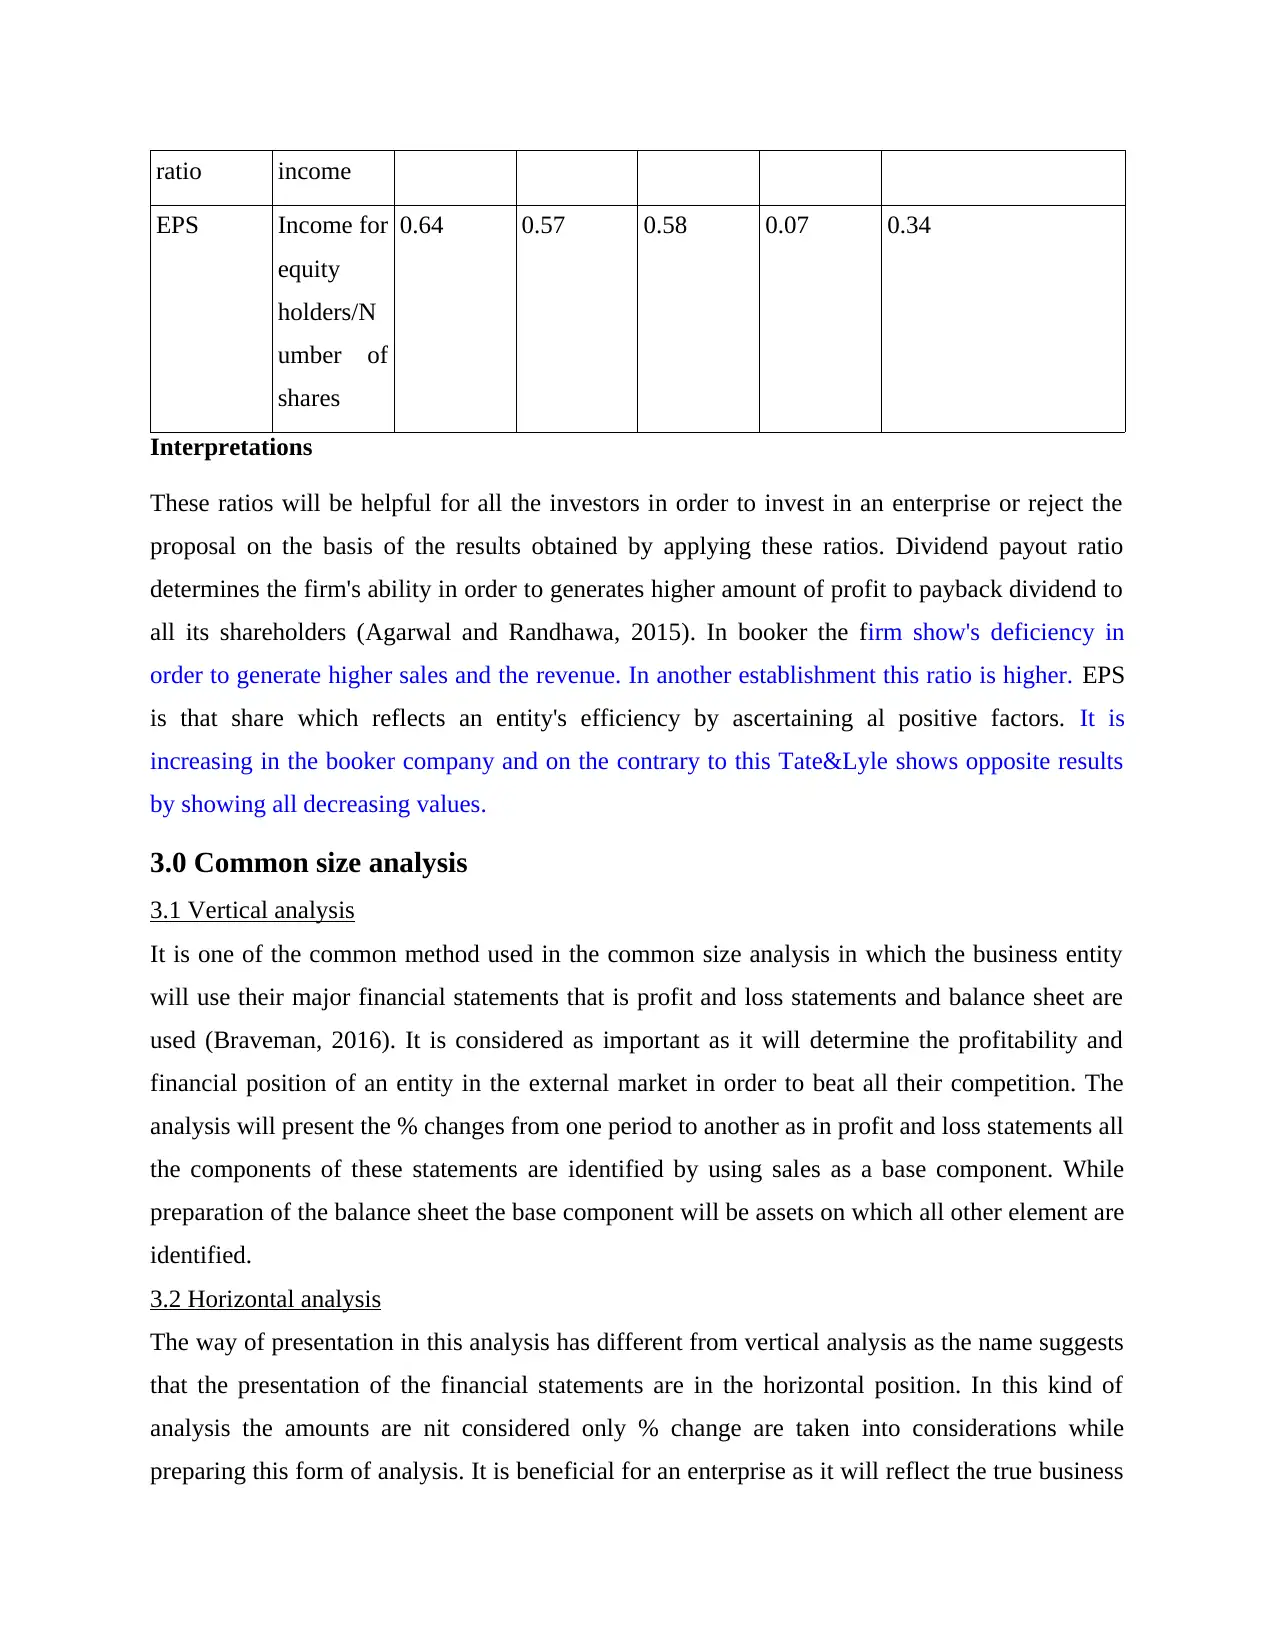
Interpretations
These ratios will be helpful for all the investors in order to invest in an enterprise or reject the
proposal on the basis of the results obtained by applying these ratios. Dividend payout ratio
determines the firm's ability in order to generates higher amount of profit to payback dividend to
all its shareholders (Agarwal and Randhawa, 2015). In booker the firm show's deficiency in
order to generate higher sales and the revenue. In another establishment this ratio is higher. EPS
is that share which reflects an entity's efficiency by ascertaining al positive factors. It is
increasing in the booker company and on the contrary to this Tate&Lyle shows opposite results
by showing all decreasing values.
3.0 Common size analysis
3.1 Vertical analysis
It is one of the common method used in the common size analysis in which the business entity
will use their major financial statements that is profit and loss statements and balance sheet are
used (Braveman, 2016). It is considered as important as it will determine the profitability and
financial position of an entity in the external market in order to beat all their competition. The
analysis will present the % changes from one period to another as in profit and loss statements all
the components of these statements are identified by using sales as a base component. While
preparation of the balance sheet the base component will be assets on which all other element are
identified.
3.2 Horizontal analysis
The way of presentation in this analysis has different from vertical analysis as the name suggests
that the presentation of the financial statements are in the horizontal position. In this kind of
analysis the amounts are nit considered only % change are taken into considerations while
preparing this form of analysis. It is beneficial for an enterprise as it will reflect the true business
EPS Income for
equity
holders/N
umber of
shares
0.64 0.57 0.58 0.07 0.34
Interpretations
These ratios will be helpful for all the investors in order to invest in an enterprise or reject the
proposal on the basis of the results obtained by applying these ratios. Dividend payout ratio
determines the firm's ability in order to generates higher amount of profit to payback dividend to
all its shareholders (Agarwal and Randhawa, 2015). In booker the firm show's deficiency in
order to generate higher sales and the revenue. In another establishment this ratio is higher. EPS
is that share which reflects an entity's efficiency by ascertaining al positive factors. It is
increasing in the booker company and on the contrary to this Tate&Lyle shows opposite results
by showing all decreasing values.
3.0 Common size analysis
3.1 Vertical analysis
It is one of the common method used in the common size analysis in which the business entity
will use their major financial statements that is profit and loss statements and balance sheet are
used (Braveman, 2016). It is considered as important as it will determine the profitability and
financial position of an entity in the external market in order to beat all their competition. The
analysis will present the % changes from one period to another as in profit and loss statements all
the components of these statements are identified by using sales as a base component. While
preparation of the balance sheet the base component will be assets on which all other element are
identified.
3.2 Horizontal analysis
The way of presentation in this analysis has different from vertical analysis as the name suggests
that the presentation of the financial statements are in the horizontal position. In this kind of
analysis the amounts are nit considered only % change are taken into considerations while
preparing this form of analysis. It is beneficial for an enterprise as it will reflect the true business
Paraphrase This Document
Need a fresh take? Get an instant paraphrase of this document with our AI Paraphraser
performance of an entity in which internal performance are compared in order to make corrective
actions in order to remove their internal weaknesses.
3.3 Du Pont analysis
Return on Equity= Total assets/Shareholder's equity*Return on assets
Return on equity= Total assets/Shareholder's equity*Net income/Total assets
Return on equity= Total assets/shareholder's equity*Revenues/total assets*Net income/Revenues
Return on Equity= Total assets/shareholder's equity*Revenues/total assets* Operating
income/Revenues* EBIT/operating income*(1-tax/EBIT)
3.4 Segment analysis
The segments are integral part of an enterprise whose main motive is to complete the overall
work on time by allotting all work into different departments (Drummond and Sculpher 2015).
The segmentation in the above food and beverage industries includes groceries, shelf space
allocation, monitoring of all the items, drinks, raw groceries, food processing, finished product's
cell. These standard segmentation will be same in the both organisation as both falls in the same
industry. The variations in the segments may due to the changes in the needs and expectations of
an enterprise.
4.0 MERITS AND DEMERITS
4.1 Ratio analysis
It refers to comparative analysis of the business performance of two organisations among which
this comparison has been established by categorising all the variables of the business into
different categories.
Advantages
It helps in forecasting and plaining as it will reveal the costs involved in the business of
Booker and tate& lyle which helps them in order to determine their sales level.
Comparison of the current figures of both the company in relation to their previous years
The operational efficiency has been measured by calculating different kinds of ratios
Disadvantages
Ratios will be provide wrong results due to errors in the financial statements
The ratios based on the financial information will only provides historical information
and no real information.
4.2 Common size
Advantages
The simplified structure of common size statements is easy to understanding in order to
interpret the results of booker and tate& lyle.
The booker and tate&lyle can predict their future cash flows by using time series analysis
over one period to another period.
The different components which is to be covered in the different financial statements are
compared easily.
Disadvantages
The information may get misleading to the users of the business as external changes like
inflationary rate will change the prices level.
These statements failed to reveal true positions of sales and all other components covered
in the business due to widow dressing of financial statements.
4.3 Du Pont
Advantages
It will assist all the investors in order to make business decisions equally by taking into
considerations all the external factors
This will reveal the complete picture regarding financial health of an enterprise and their
business performance.
It uses financial and leverage resources in order to remove the minute deficiency remains
in the factors.
Disadvantages
It heavily relies on the accounting data from the company's financial statements which is
not good as slight changes in the data may lead to complete transformation.
This analysis is based on other ratios so in case of lack fop information it is not proved to
be beneficial for an enterprise.
4.4 Segment analysis
Advantages
Advantages
The simplified structure of common size statements is easy to understanding in order to
interpret the results of booker and tate& lyle.
The booker and tate&lyle can predict their future cash flows by using time series analysis
over one period to another period.
The different components which is to be covered in the different financial statements are
compared easily.
Disadvantages
The information may get misleading to the users of the business as external changes like
inflationary rate will change the prices level.
These statements failed to reveal true positions of sales and all other components covered
in the business due to widow dressing of financial statements.
4.3 Du Pont
Advantages
It will assist all the investors in order to make business decisions equally by taking into
considerations all the external factors
This will reveal the complete picture regarding financial health of an enterprise and their
business performance.
It uses financial and leverage resources in order to remove the minute deficiency remains
in the factors.
Disadvantages
It heavily relies on the accounting data from the company's financial statements which is
not good as slight changes in the data may lead to complete transformation.
This analysis is based on other ratios so in case of lack fop information it is not proved to
be beneficial for an enterprise.
4.4 Segment analysis
Advantages
⊘ This is a preview!⊘
Do you want full access?
Subscribe today to unlock all pages.
Trusted by 1+ million students worldwide
1 out of 22
Related Documents


Your All-in-One AI-Powered Toolkit for Academic Success.
+13062052269
info@desklib.com
Available 24*7 on WhatsApp / Email
![[object Object]](/_next/static/media/star-bottom.7253800d.svg)
Unlock your academic potential
Copyright © 2020–2026 A2Z Services. All Rights Reserved. Developed and managed by ZUCOL.