Strategic Financial Analysis Report: Booker and Tate & Lyle
VerifiedAdded on 2022/10/18
|35
|8266
|26
Report
AI Summary
This report provides a comprehensive strategic financial analysis of Booker and Tate & Lyle, focusing on the principal methods of analyzing company accounts from an external perspective. It begins with an introduction to financial analysis, explaining how financial statements like the Balance Sheet, Income Statement, and Cash flow statements are used to assess a company's financial position, profitability, efficiency, liquidity, and leverage. The report then delves into ratio calculation, covering profitability ratios (Gross Profit Margin, Net Profit Margin, Return on Capital Employed), liquidity ratios (Current Ratio, Quick Ratio), efficiency ratios (Days of Sales Outstanding, Days of Inventory on Hand, Days of Payables, Cash Conversion Cycle), leverage ratios (Debt-to-Equity Ratio, Gearing), cash flow ratios (Operating Cash Flow to Sales, Operating Cash Flow to Net Income, Cash Flow to Total Debt), and investor ratios (Earnings per Share, Dividend Pay-out, Price-Earnings Ratio). Furthermore, it includes common size analysis (vertical and horizontal analysis), DuPont analysis, and segmental analysis. The report evaluates the financial performance of Booker and Tate & Lyle using these techniques, highlighting trends and providing insights into their financial health, while also critically assessing the shortcomings of these methods and proposing contemporary analysis methods to limit those shortcomings.
Running Head: Strategic Financial Analysis
Strategic Financial Analysis
Strategic Financial Analysis
Paraphrase This Document
Need a fresh take? Get an instant paraphrase of this document with our AI Paraphraser
Strategic Financial Analysis
Contents
2.0 Ratio Calculation.......................................................................................................................1
2.0 Introduction to Financial Analysis...............................................................................................1
2.1 Profitability..................................................................................................................................1
2.1.1 Gross Profit Margin (GPM)..................................................................................................4
2.1.2 Net Profit Margin..................................................................................................................5
2.1.3 Return on Capital Employed (ROCE)...................................................................................6
2.2 Liquidity......................................................................................................................................7
2.2.1 Current Ratio........................................................................................................................7
2.2.2 Quick Ratio...........................................................................................................................8
2.3 Efficiency....................................................................................................................................8
2.3.1 Days of Sales Outstanding (DSO).........................................................................................9
2.3.2 Days of Inventory on Hand (DOI)........................................................................................9
2.3.3 Days of Payables (DOP).....................................................................................................10
2.3.4 Cash Conversion Cycle (CCC)...........................................................................................10
2.4 Leverage....................................................................................................................................11
2.4.1 Debt-to-Equity Ratio...........................................................................................................11
2.4.2 Gearing...............................................................................................................................12
2.5 Cash Flow Ratios.......................................................................................................................12
2.5.1 Operating Cash Flow to Sales.............................................................................................13
2.5.2 Operating Cash Flow to Net Income...................................................................................13
2.5.3 Cash Flow to Total Debt.....................................................................................................14
2.6 Investor’s Ratio.........................................................................................................................14
2.6.1 Earnings per Share (EPS)....................................................................................................15
2.6.2 Dividend Pay-out................................................................................................................15
2.6.3 Price- Earnings Ratio (P/E Ratio).......................................................................................16
2.7 Common Size............................................................................................................................16
2.7.1 Vertical Analysis................................................................................................................17
2.7.2 Horizontal Analysis............................................................................................................21
2.8 DuPont Analysis........................................................................................................................25
2.8.1 DuPont - 3 factor ROE........................................................................................................25
2.8.1 DuPont - 2 factor ROA.......................................................................................................26
2.9 Segmental Analysis...................................................................................................................27
1
Strategic Financial Analysis
References...........................................................................................................................................28
2.0 Ratio Calculation
2.0 Introduction to Financial Analysis
Financial analyses are done for measuring the companies’ performance over a specific time
period. It is the process through which financial position are assessed by doing analysis on
stability, profitability and viability of the companies. Various financial statements like
Balance Sheet, Income Statement and Cash flow statements are used for the purpose of
analysis. Income statement of the company talks about its operational efficiency and balance
sheet talks about its net worth (Sultan, 2014).
The measures like financial ratios give the idea about the organisation’s profitability,
efficiency, liquidity, leverage etc. There are other analysis like vertical analysis and
horizontal analysis which are done over financial statements of the company.
We would study the financial performance and position of Booker and Tate and Lyle using
ratio analysis, horizontal analysis, vertical analysis, DuPont analysis and segmental analysis.
2.1 Profitability
2
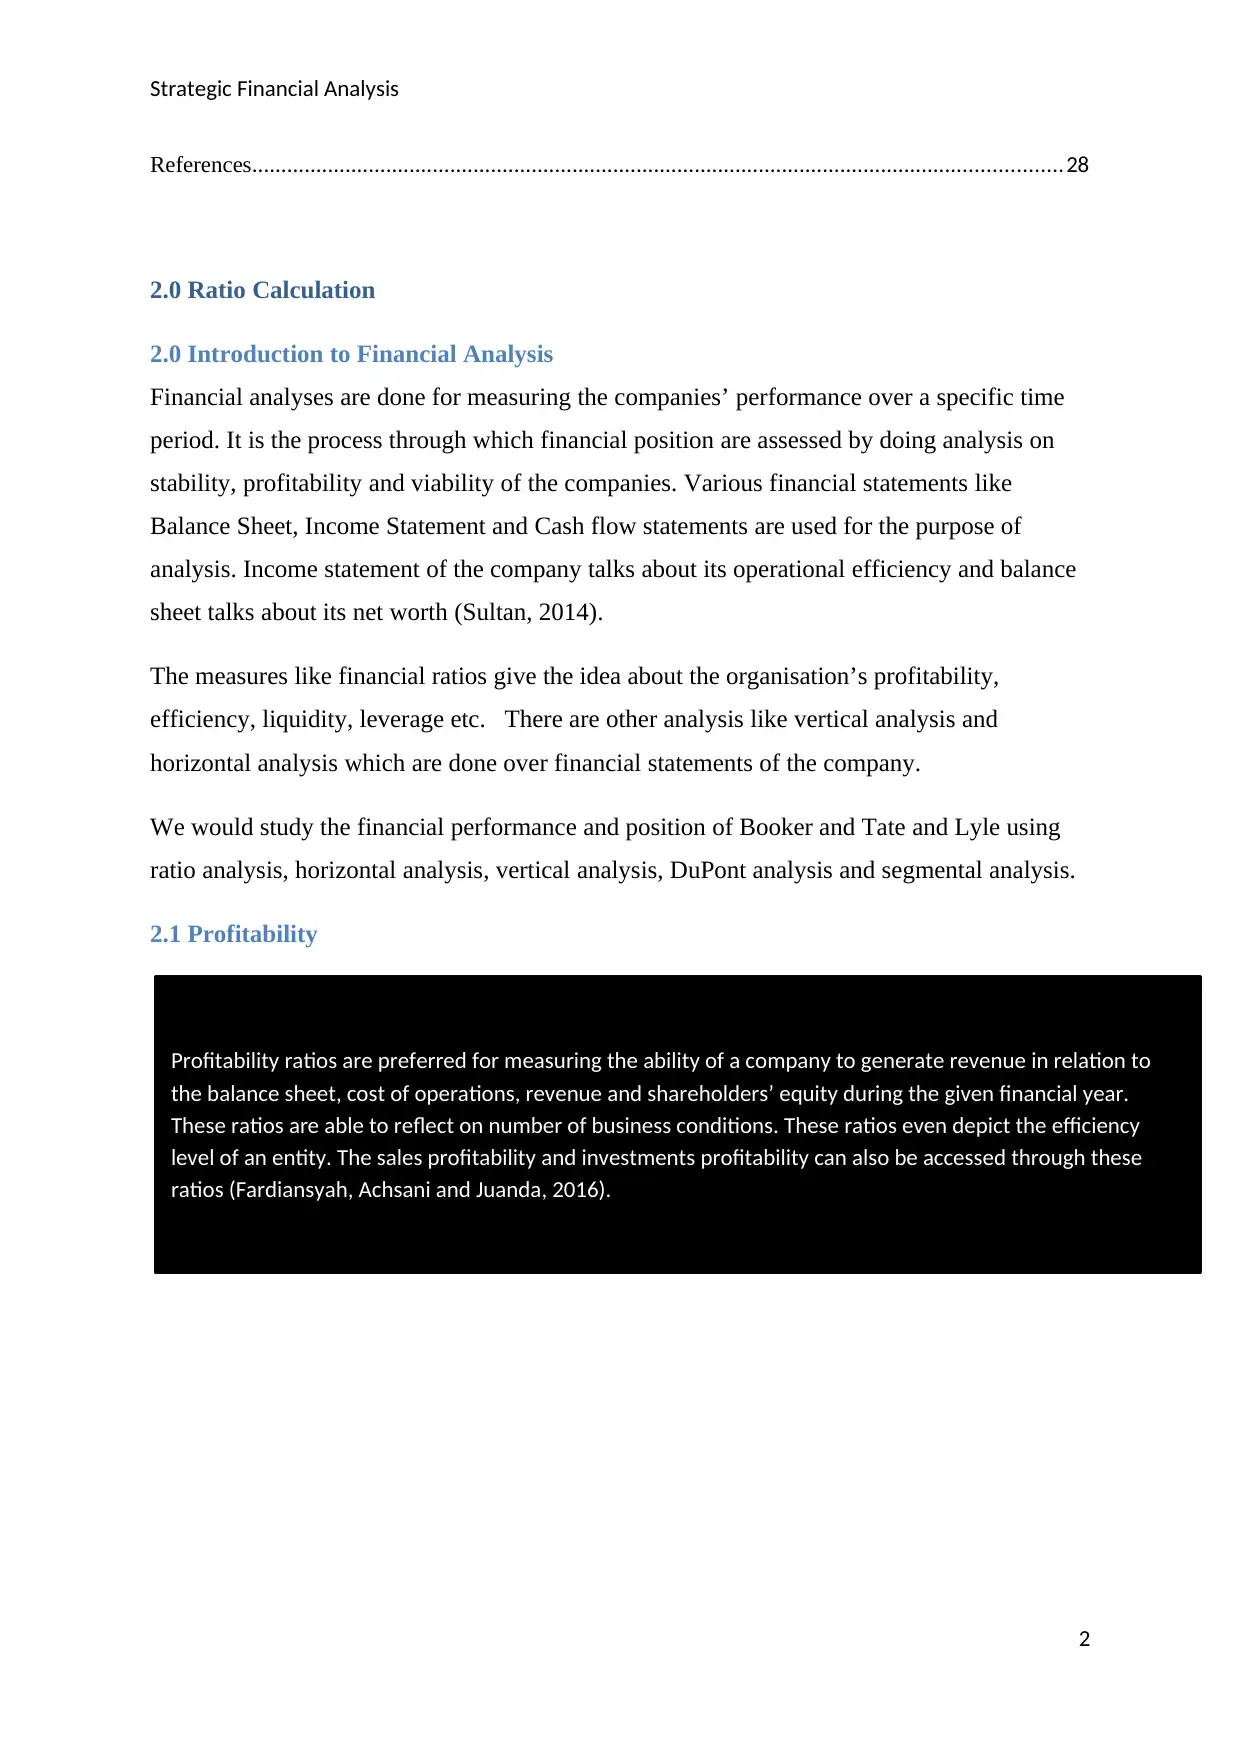
Profitability ratios are preferred for measuring the ability of a company to generate revenue in relation to
the balance sheet, cost of operations, revenue and shareholders’ equity during the given financial year.
These ratios are able to reflect on number of business conditions. These ratios even depict the efficiency
level of an entity. The sales profitability and investments profitability can also be accessed through these
ratios (Fardiansyah, Achsani and Juanda, 2016).
References...........................................................................................................................................28
2.0 Ratio Calculation
2.0 Introduction to Financial Analysis
Financial analyses are done for measuring the companies’ performance over a specific time
period. It is the process through which financial position are assessed by doing analysis on
stability, profitability and viability of the companies. Various financial statements like
Balance Sheet, Income Statement and Cash flow statements are used for the purpose of
analysis. Income statement of the company talks about its operational efficiency and balance
sheet talks about its net worth (Sultan, 2014).
The measures like financial ratios give the idea about the organisation’s profitability,
efficiency, liquidity, leverage etc. There are other analysis like vertical analysis and
horizontal analysis which are done over financial statements of the company.
We would study the financial performance and position of Booker and Tate and Lyle using
ratio analysis, horizontal analysis, vertical analysis, DuPont analysis and segmental analysis.
2.1 Profitability
2
Profitability ratios are preferred for measuring the ability of a company to generate revenue in relation to
the balance sheet, cost of operations, revenue and shareholders’ equity during the given financial year.
These ratios are able to reflect on number of business conditions. These ratios even depict the efficiency
level of an entity. The sales profitability and investments profitability can also be accessed through these
ratios (Fardiansyah, Achsani and Juanda, 2016).
⊘ This is a preview!⊘
Do you want full access?
Subscribe today to unlock all pages.
Trusted by 1+ million students worldwide
Strategic Financial Analysis
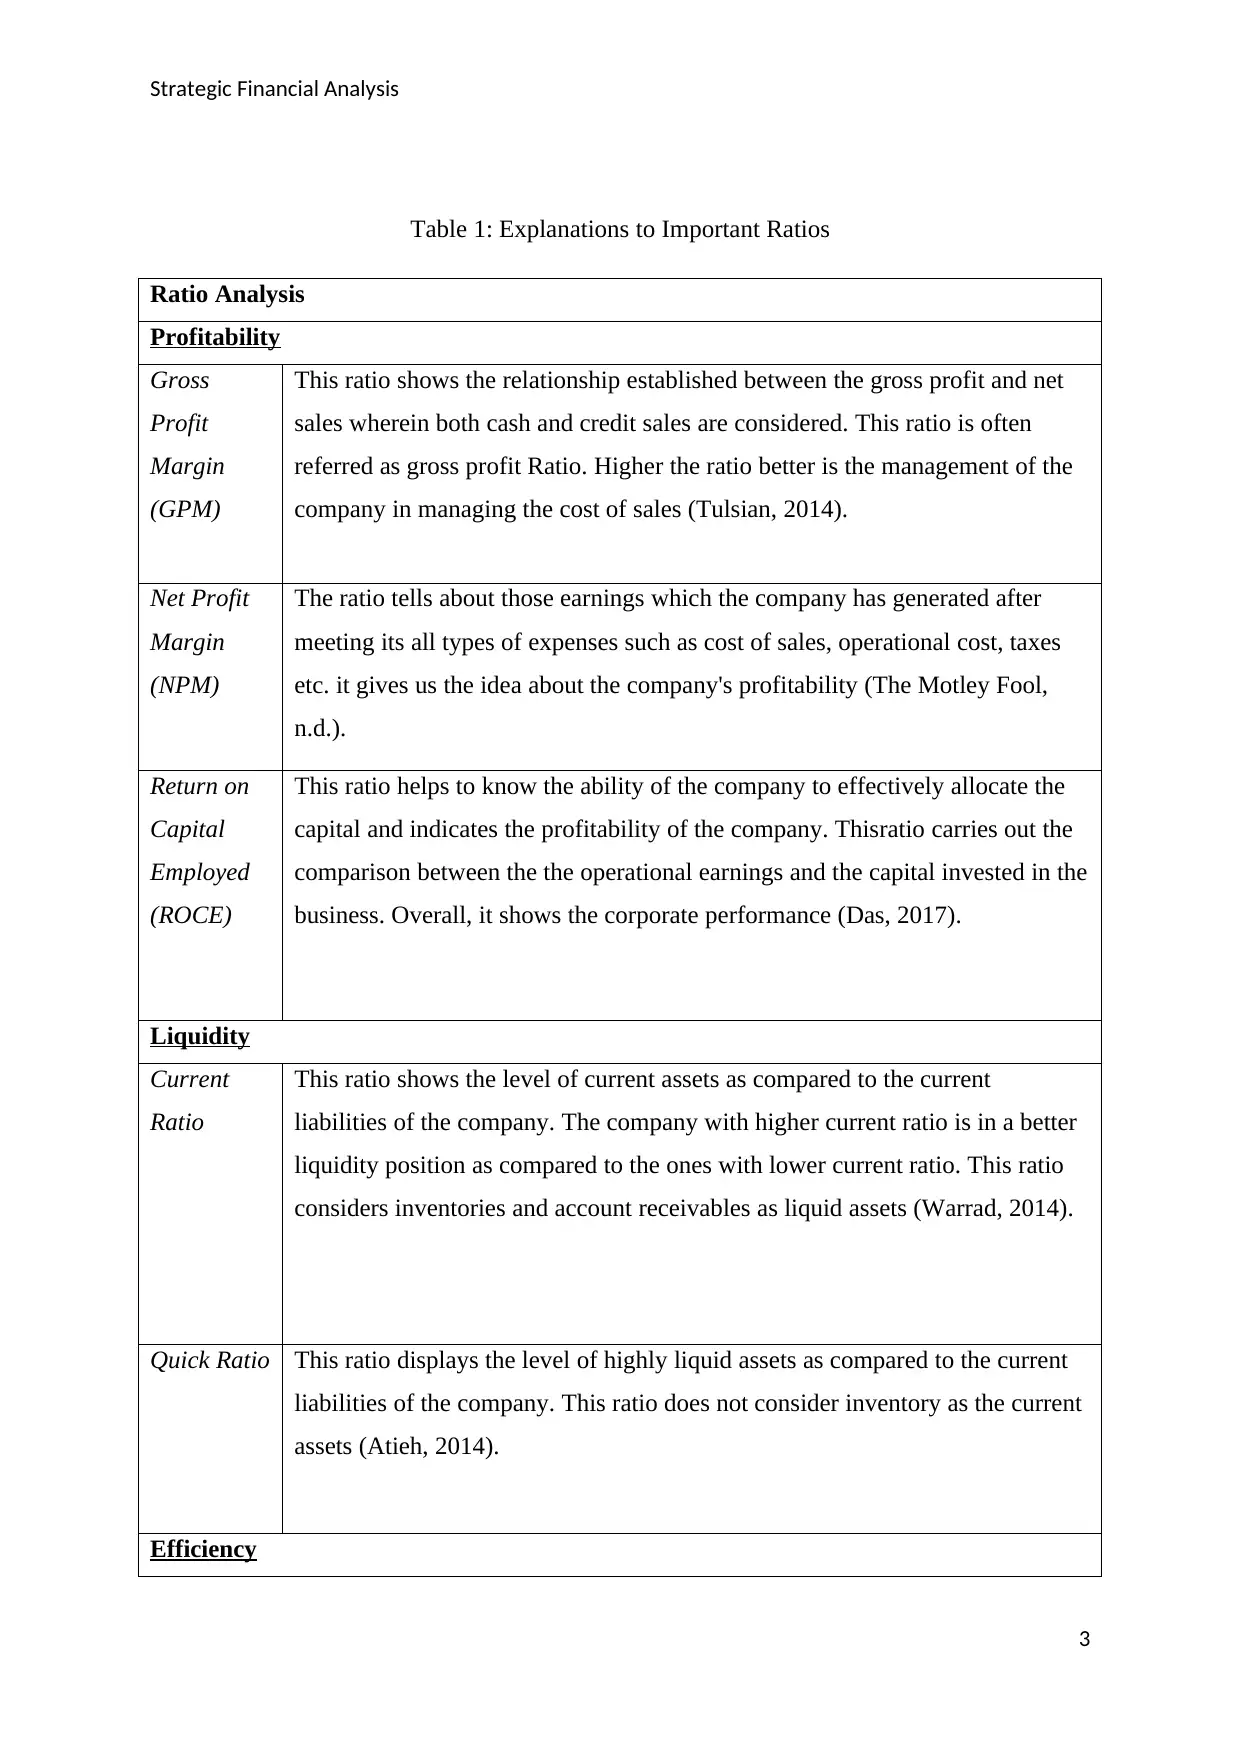
Table 1: Explanations to Important Ratios
Ratio Analysis
Profitability
Gross
Profit
Margin
(GPM)
This ratio shows the relationship established between the gross profit and net
sales wherein both cash and credit sales are considered. This ratio is often
referred as gross profit Ratio. Higher the ratio better is the management of the
company in managing the cost of sales (Tulsian, 2014).
Net Profit
Margin
(NPM)
The ratio tells about those earnings which the company has generated after
meeting its all types of expenses such as cost of sales, operational cost, taxes
etc. it gives us the idea about the company's profitability (The Motley Fool,
n.d.).
Return on
Capital
Employed
(ROCE)
This ratio helps to know the ability of the company to effectively allocate the
capital and indicates the profitability of the company. Thisratio carries out the
comparison between the the operational earnings and the capital invested in the
business. Overall, it shows the corporate performance (Das, 2017).
Liquidity
Current
Ratio
This ratio shows the level of current assets as compared to the current
liabilities of the company. The company with higher current ratio is in a better
liquidity position as compared to the ones with lower current ratio. This ratio
considers inventories and account receivables as liquid assets (Warrad, 2014).
Quick Ratio This ratio displays the level of highly liquid assets as compared to the current
liabilities of the company. This ratio does not consider inventory as the current
assets (Atieh, 2014).
Efficiency
3
Paraphrase This Document
Need a fresh take? Get an instant paraphrase of this document with our AI Paraphraser
Strategic Financial Analysis
Days of
Sales
Outstandin
g (DSO)
It helps to calculate the average days the company is taking for the cash
collection on the credit sales. It is estimated on a monthly, quarterly or yearly
basis (The Business Professor, n.d.).
Days of
Inventory
on Hand
(DOI)
The ratio speaks about average days taken by the business to convert the
inventory into sales. Also, it tells us about the inventory management of
company (bdc, n.d.).
Days of
Payables
(DOP)
This ratio tells about the average number of days taken by the company to
make payments on their account payables which includes, vendors, suppliers,
creditors etc. (WallstreetMojo, n.d.).
Cash
Conversion
Cycle
(CCC)
This tells us about how much days are taken by the company to collect cash
from the accounts receivables and how much days is it taking to convert raw
material into finished goods after subtracting the number of days taken by the
company to pay its short-term obligations (Yasir, Majid and Yousaf, 2014).
Leverage
Debt-to-
Equity
Ratio (D/E)
It displays how much of company's operations are being financed using debt
over equity (Morningstar, n.d.).
Gearing Gearing ratio measures the level of debt company has used in its capital
structure which includes both debt and equity (Thompson, 2018).
Cash Flow Ratios
Operating
Cash flow
to Sales
Operating cash flow to sales depicts that sales amount which has been
converted to cash flow from operating activities.
Operating
Cash Flow
to Net
This ratio represents the amount of net income converted to the cash flow from
operations
4
Days of
Sales
Outstandin
g (DSO)
It helps to calculate the average days the company is taking for the cash
collection on the credit sales. It is estimated on a monthly, quarterly or yearly
basis (The Business Professor, n.d.).
Days of
Inventory
on Hand
(DOI)
The ratio speaks about average days taken by the business to convert the
inventory into sales. Also, it tells us about the inventory management of
company (bdc, n.d.).
Days of
Payables
(DOP)
This ratio tells about the average number of days taken by the company to
make payments on their account payables which includes, vendors, suppliers,
creditors etc. (WallstreetMojo, n.d.).
Cash
Conversion
Cycle
(CCC)
This tells us about how much days are taken by the company to collect cash
from the accounts receivables and how much days is it taking to convert raw
material into finished goods after subtracting the number of days taken by the
company to pay its short-term obligations (Yasir, Majid and Yousaf, 2014).
Leverage
Debt-to-
Equity
Ratio (D/E)
It displays how much of company's operations are being financed using debt
over equity (Morningstar, n.d.).
Gearing Gearing ratio measures the level of debt company has used in its capital
structure which includes both debt and equity (Thompson, 2018).
Cash Flow Ratios
Operating
Cash flow
to Sales
Operating cash flow to sales depicts that sales amount which has been
converted to cash flow from operating activities.
Operating
Cash Flow
to Net
This ratio represents the amount of net income converted to the cash flow from
operations
4
Strategic Financial Analysis
Income
Cash Flow
to Total
Debt
This ratio shows the cash flow generated by the organisation through its
operations for each dollar of debt it used. It is an important measure solvency
and liquidity (Garcia, 2017).
Investor's Ratio
Earnings
Per Share
(EPS)
EPS is an important indicator of risk, company's success and its performance.
It is even used to forecast the future price of company's shares because the
change in the value of EPS often impacts the share price of that company
(Robbetze, Villiers and Harmse, 2017).
Dividend
Pay-out
(DPO)
Dividend pay-out refers to that portion of company's net income which is
distributed as dividend to the shareholders. Higher dividend pay-out ratio of a
company reflects its liberal dividend policy and low dividend pay-out reflects
the conservative dividend policy (Nwabuisi, Aseoluwa and Tolulope, 2017).
Price-
Earnings
Ratio (P/E)
This ratio is used to calculate the value of a firm for which it considers the
current price of the company's shares and earnings received on per share of the
company (Ghaeli, 2016).
2.1.1 Gross Profit Margin (GPM)
2 0 1 2 2 0 1 3 2 0 1 4 2 0 1 5 2 0 1 6
3.78%
3.99%
4.40%
4.80%
5.08%
30.21%
29.94%
30.03%
35.28%
37.54%
Gr o ss P r o fi t M a r g i n
BK T&L
5
⊘ This is a preview!⊘
Do you want full access?
Subscribe today to unlock all pages.
Trusted by 1+ million students worldwide
Strategic Financial Analysis
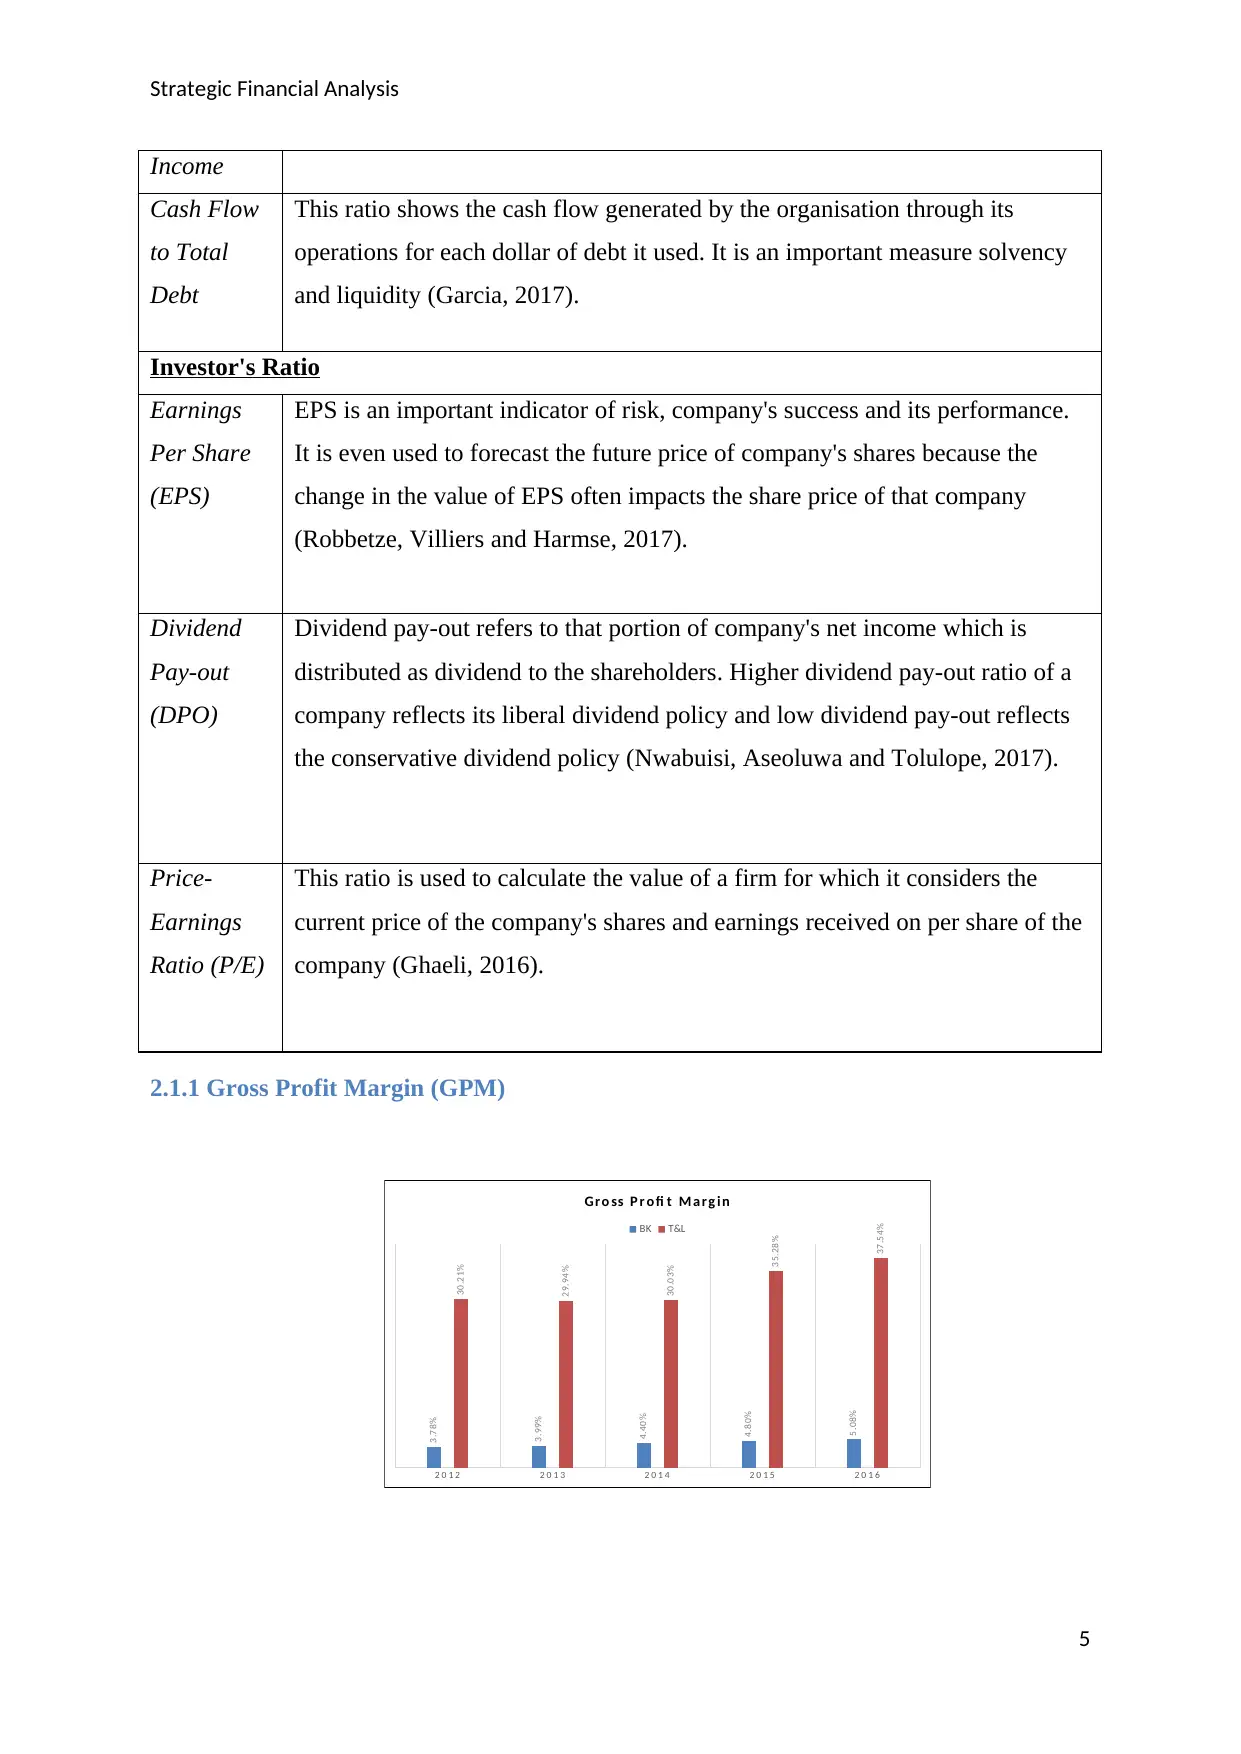
The gross profit margin of Booker is showing an upward trend over five year period. The
gross profit margin has gone up because of increased revenue over the five years period. Over
the five years, the major part of the Booker’s revenue is coming from the non-tobacco
segment whose revenue increased by 44% (£2.39bn in 2012; £3.43bn in 2016), however the
revenue from the tobacco segment has just increased by 6.12% (£1.47bn in 2012; £1.56bn in
2016) (Booker Annual Report, 2016).
Gross profit margin of Tate & Lyle came down during 2013 as compared to 2012 therefore;
the gross profit margin of the company did not show a constant increasing trend. In 2014,
T&L acquired the assets and complete business of Winway Biotechnology Nantong Co. This
acquisition was done with the plan to enhance the capacity of Winway Biotechnology
Nantong for increasing the sale of speciality fibre products food. This increased the revenue
of T&L and also the improved capacity reduced T&L’s cost of production. As a result, the
gross profit margin increased by 7.5% from 2014(30%) to 2016 (37.5%) (Tate and Lyle,
2014).
2.1.2 Net Profit Margin
2 0 1 2 2 0 1 3 2 0 1 4 2 0 1 5 2 0 1 6
2.28%
2.38%
2.64%
2.95%
3.06%
13.08%
10.26%
9.11%
1.41%
5.39%
N e t P r o fi t M ar g in
BK T&L
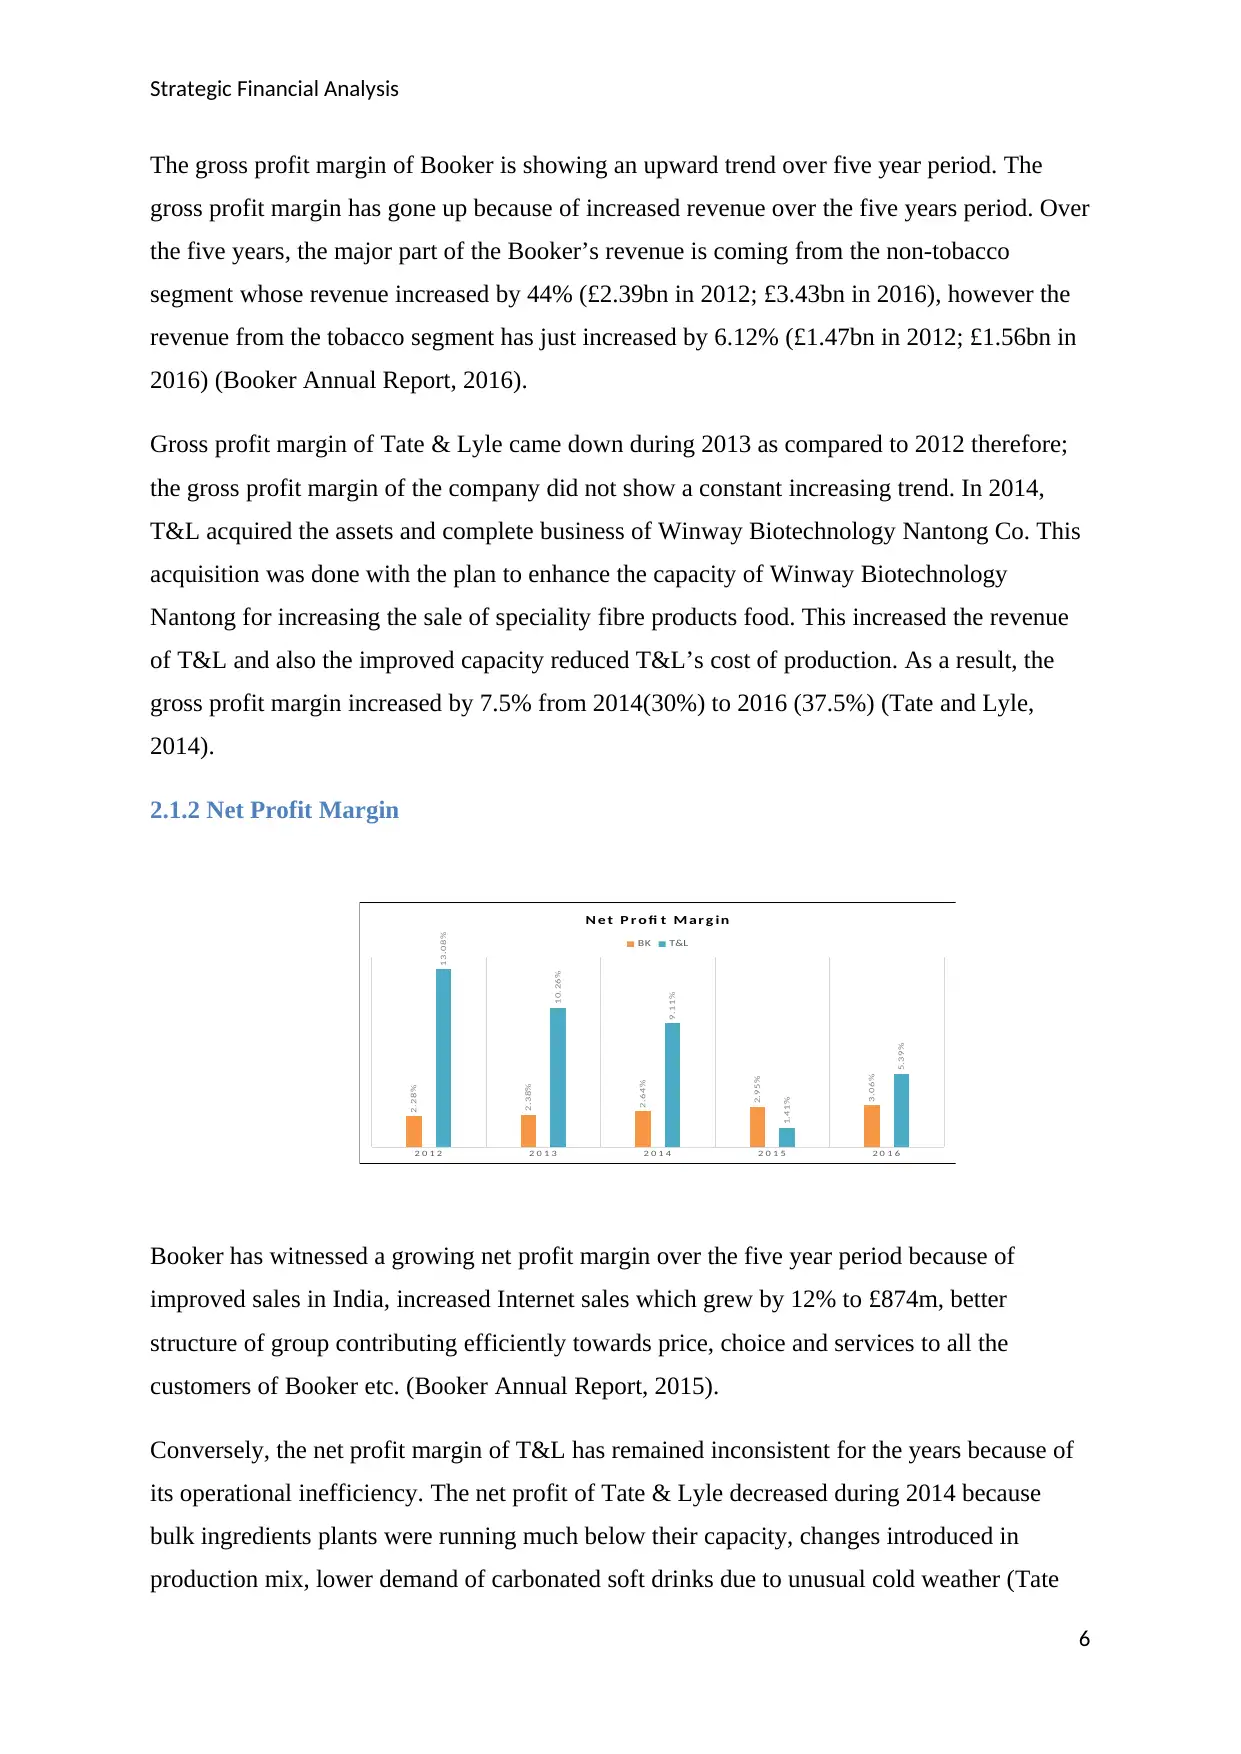
Booker has witnessed a growing net profit margin over the five year period because of
improved sales in India, increased Internet sales which grew by 12% to £874m, better
structure of group contributing efficiently towards price, choice and services to all the
customers of Booker etc. (Booker Annual Report, 2015).
Conversely, the net profit margin of T&L has remained inconsistent for the years because of
its operational inefficiency. The net profit of Tate & Lyle decreased during 2014 because
bulk ingredients plants were running much below their capacity, changes introduced in
production mix, lower demand of carbonated soft drinks due to unusual cold weather (Tate
6
The gross profit margin of Booker is showing an upward trend over five year period. The
gross profit margin has gone up because of increased revenue over the five years period. Over
the five years, the major part of the Booker’s revenue is coming from the non-tobacco
segment whose revenue increased by 44% (£2.39bn in 2012; £3.43bn in 2016), however the
revenue from the tobacco segment has just increased by 6.12% (£1.47bn in 2012; £1.56bn in
2016) (Booker Annual Report, 2016).
Gross profit margin of Tate & Lyle came down during 2013 as compared to 2012 therefore;
the gross profit margin of the company did not show a constant increasing trend. In 2014,
T&L acquired the assets and complete business of Winway Biotechnology Nantong Co. This
acquisition was done with the plan to enhance the capacity of Winway Biotechnology
Nantong for increasing the sale of speciality fibre products food. This increased the revenue
of T&L and also the improved capacity reduced T&L’s cost of production. As a result, the
gross profit margin increased by 7.5% from 2014(30%) to 2016 (37.5%) (Tate and Lyle,
2014).
2.1.2 Net Profit Margin
2 0 1 2 2 0 1 3 2 0 1 4 2 0 1 5 2 0 1 6
2.28%
2.38%
2.64%
2.95%
3.06%
13.08%
10.26%
9.11%
1.41%
5.39%
N e t P r o fi t M ar g in
BK T&L
Booker has witnessed a growing net profit margin over the five year period because of
improved sales in India, increased Internet sales which grew by 12% to £874m, better
structure of group contributing efficiently towards price, choice and services to all the
customers of Booker etc. (Booker Annual Report, 2015).
Conversely, the net profit margin of T&L has remained inconsistent for the years because of
its operational inefficiency. The net profit of Tate & Lyle decreased during 2014 because
bulk ingredients plants were running much below their capacity, changes introduced in
production mix, lower demand of carbonated soft drinks due to unusual cold weather (Tate
6
Paraphrase This Document
Need a fresh take? Get an instant paraphrase of this document with our AI Paraphraser
Strategic Financial Analysis
and Lyle Annual Report, 2014). The major factor which impacted the net profit of T&L
during the year were the extended shutdown of SPLENDA Sucralose facility in Singapore
because of industrial accident, unusual and prolonged winter in US during 2013/14 caused
operations related difficulties in US plant and made the company enter with little inventory
during the year 2015 (Tate and Lyle Final Results, 2015).
No doubt, in most of the years out of five, net profit margin of Tate & Lyle has always been
more than that of Booker. It is because the production cost incurred by Tate & Lyle is much
lower as compared with that of Bookers’. The higher cost of production lowers the net profit
margin of Booker in spite of witnessing higher sales than T&L.
2.1.3 Return on Capital Employed (ROCE)
2 0 1 2 2 0 1 3 2 0 1 4 2 0 1 5 2 0 1 6
20.64%
18.07%
19.74%
21.20%
22.53%
18.26%
15.14%
12.68%
1.90%
7.01%
RO CE
BK T&L
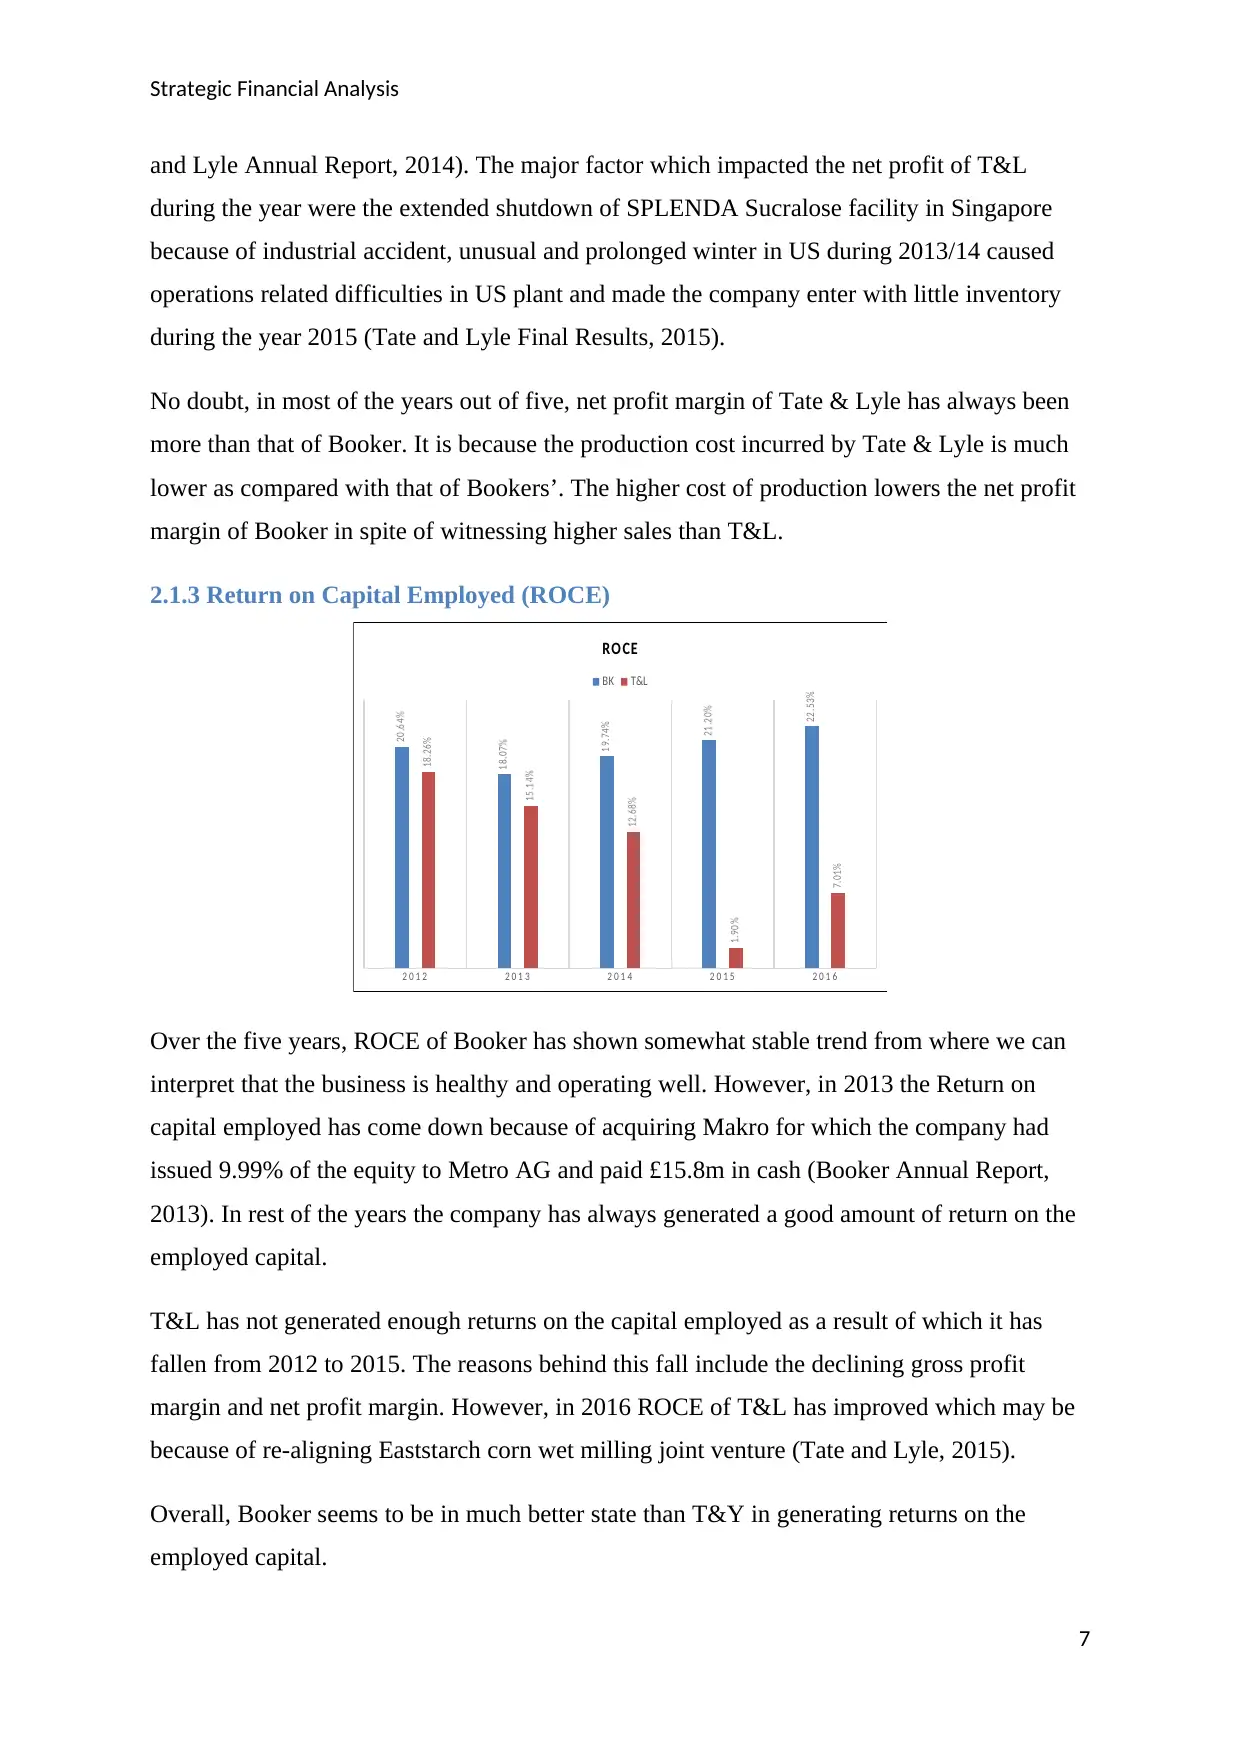
Over the five years, ROCE of Booker has shown somewhat stable trend from where we can
interpret that the business is healthy and operating well. However, in 2013 the Return on
capital employed has come down because of acquiring Makro for which the company had
issued 9.99% of the equity to Metro AG and paid £15.8m in cash (Booker Annual Report,
2013). In rest of the years the company has always generated a good amount of return on the
employed capital.
T&L has not generated enough returns on the capital employed as a result of which it has
fallen from 2012 to 2015. The reasons behind this fall include the declining gross profit
margin and net profit margin. However, in 2016 ROCE of T&L has improved which may be
because of re-aligning Eaststarch corn wet milling joint venture (Tate and Lyle, 2015).
Overall, Booker seems to be in much better state than T&Y in generating returns on the
employed capital.
7
and Lyle Annual Report, 2014). The major factor which impacted the net profit of T&L
during the year were the extended shutdown of SPLENDA Sucralose facility in Singapore
because of industrial accident, unusual and prolonged winter in US during 2013/14 caused
operations related difficulties in US plant and made the company enter with little inventory
during the year 2015 (Tate and Lyle Final Results, 2015).
No doubt, in most of the years out of five, net profit margin of Tate & Lyle has always been
more than that of Booker. It is because the production cost incurred by Tate & Lyle is much
lower as compared with that of Bookers’. The higher cost of production lowers the net profit
margin of Booker in spite of witnessing higher sales than T&L.
2.1.3 Return on Capital Employed (ROCE)
2 0 1 2 2 0 1 3 2 0 1 4 2 0 1 5 2 0 1 6
20.64%
18.07%
19.74%
21.20%
22.53%
18.26%
15.14%
12.68%
1.90%
7.01%
RO CE
BK T&L
Over the five years, ROCE of Booker has shown somewhat stable trend from where we can
interpret that the business is healthy and operating well. However, in 2013 the Return on
capital employed has come down because of acquiring Makro for which the company had
issued 9.99% of the equity to Metro AG and paid £15.8m in cash (Booker Annual Report,
2013). In rest of the years the company has always generated a good amount of return on the
employed capital.
T&L has not generated enough returns on the capital employed as a result of which it has
fallen from 2012 to 2015. The reasons behind this fall include the declining gross profit
margin and net profit margin. However, in 2016 ROCE of T&L has improved which may be
because of re-aligning Eaststarch corn wet milling joint venture (Tate and Lyle, 2015).
Overall, Booker seems to be in much better state than T&Y in generating returns on the
employed capital.
7
Strategic Financial Analysis
2.2 Liquidity
2.2.1 Current Ratio
2012 2013 2014 2015 2016
0.00
0.50
1.00
1.50
2.00
2.50
0.85 0.87 0.98 0.99 0.95
1.87
2.31
1.50
1.32
1.63
Current Ratios
BK
T&L
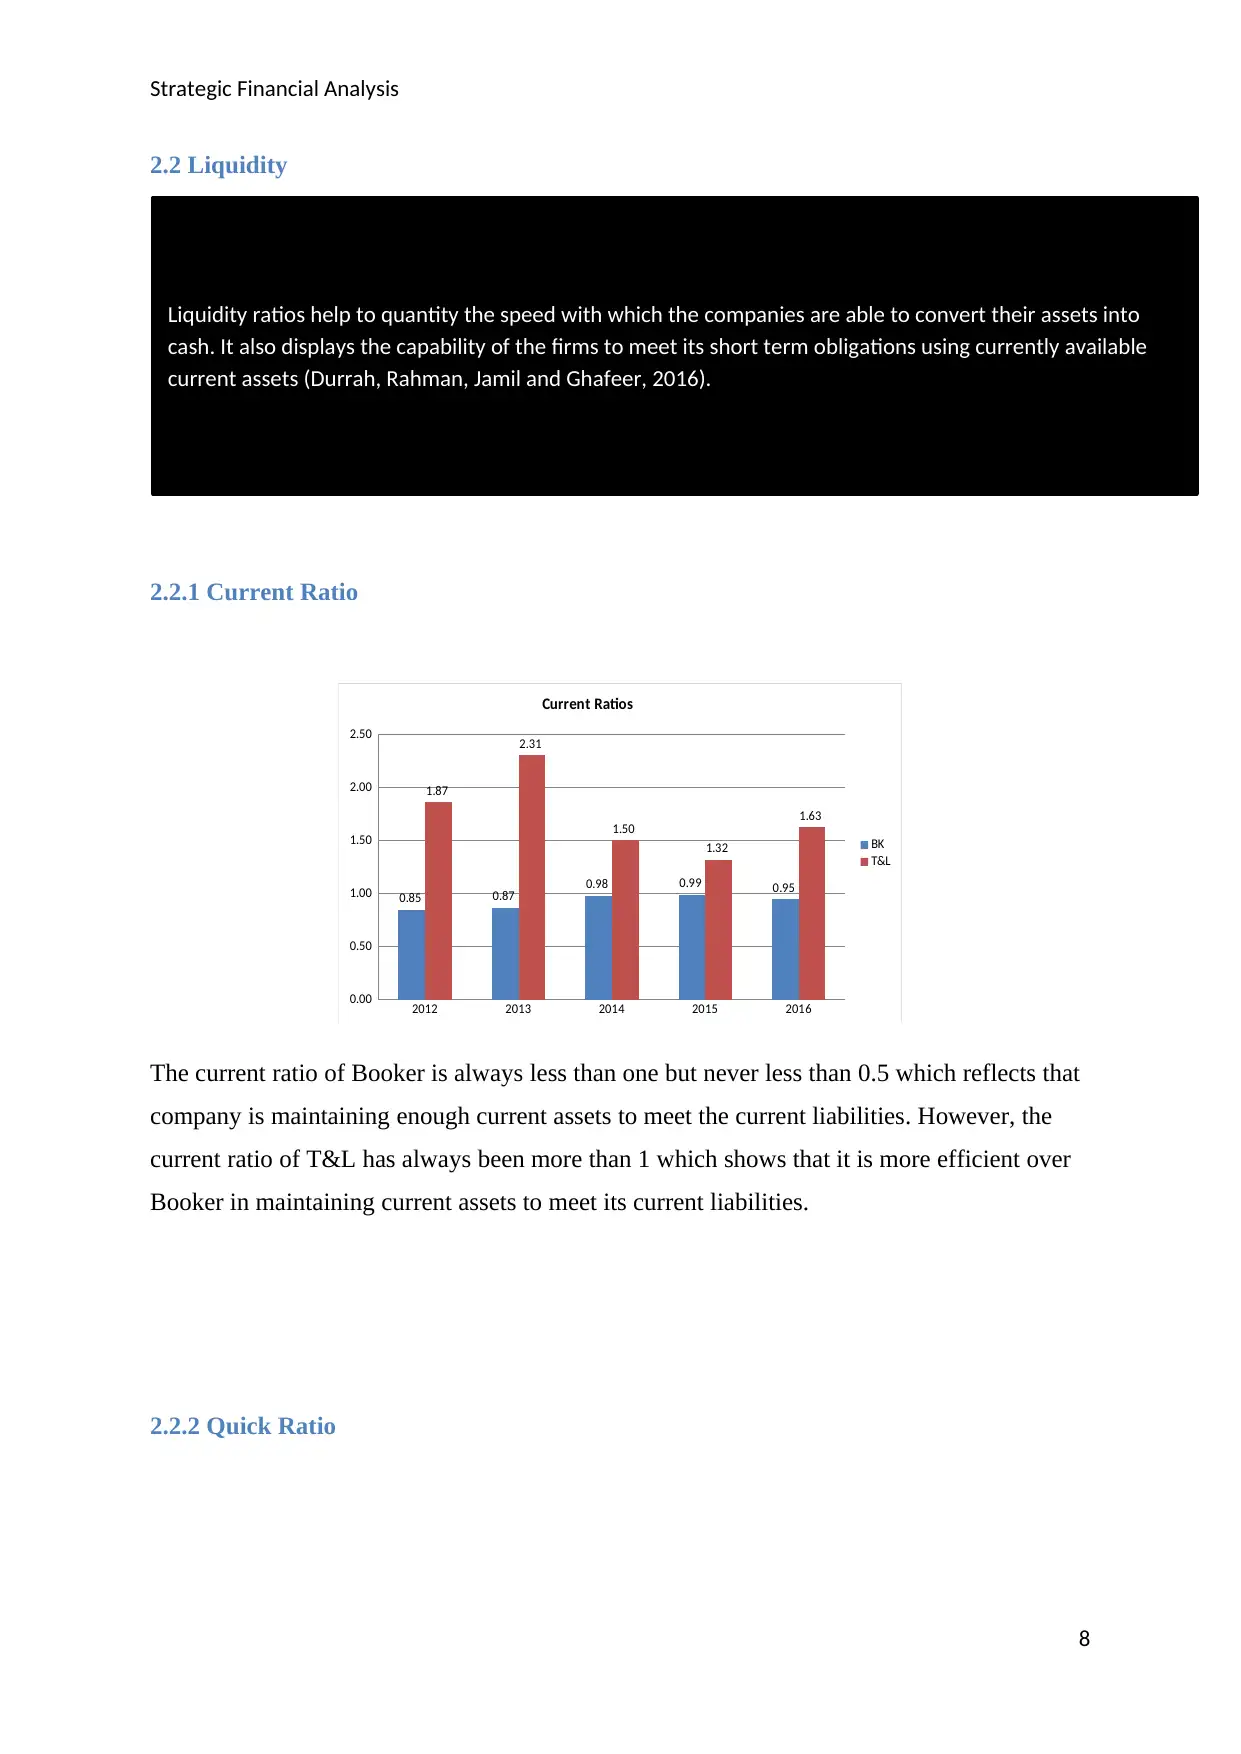
The current ratio of Booker is always less than one but never less than 0.5 which reflects that
company is maintaining enough current assets to meet the current liabilities. However, the
current ratio of T&L has always been more than 1 which shows that it is more efficient over
Booker in maintaining current assets to meet its current liabilities.
2.2.2 Quick Ratio
8
Liquidity ratios help to quantity the speed with which the companies are able to convert their assets into
cash. It also displays the capability of the firms to meet its short term obligations using currently available
current assets (Durrah, Rahman, Jamil and Ghafeer, 2016).
2.2 Liquidity
2.2.1 Current Ratio
2012 2013 2014 2015 2016
0.00
0.50
1.00
1.50
2.00
2.50
0.85 0.87 0.98 0.99 0.95
1.87
2.31
1.50
1.32
1.63
Current Ratios
BK
T&L
The current ratio of Booker is always less than one but never less than 0.5 which reflects that
company is maintaining enough current assets to meet the current liabilities. However, the
current ratio of T&L has always been more than 1 which shows that it is more efficient over
Booker in maintaining current assets to meet its current liabilities.
2.2.2 Quick Ratio
8
Liquidity ratios help to quantity the speed with which the companies are able to convert their assets into
cash. It also displays the capability of the firms to meet its short term obligations using currently available
current assets (Durrah, Rahman, Jamil and Ghafeer, 2016).
⊘ This is a preview!⊘
Do you want full access?
Subscribe today to unlock all pages.
Trusted by 1+ million students worldwide
Strategic Financial Analysis
2012 2013 2014 2015 2016
0.00
0.20
0.40
0.60
0.80
1.00
1.20
1.40
1.60
0.30 0.34
0.44 0.45 0.44
1.21
1.44
0.98
0.81
1.03
Quick Ratios
BK
T&L
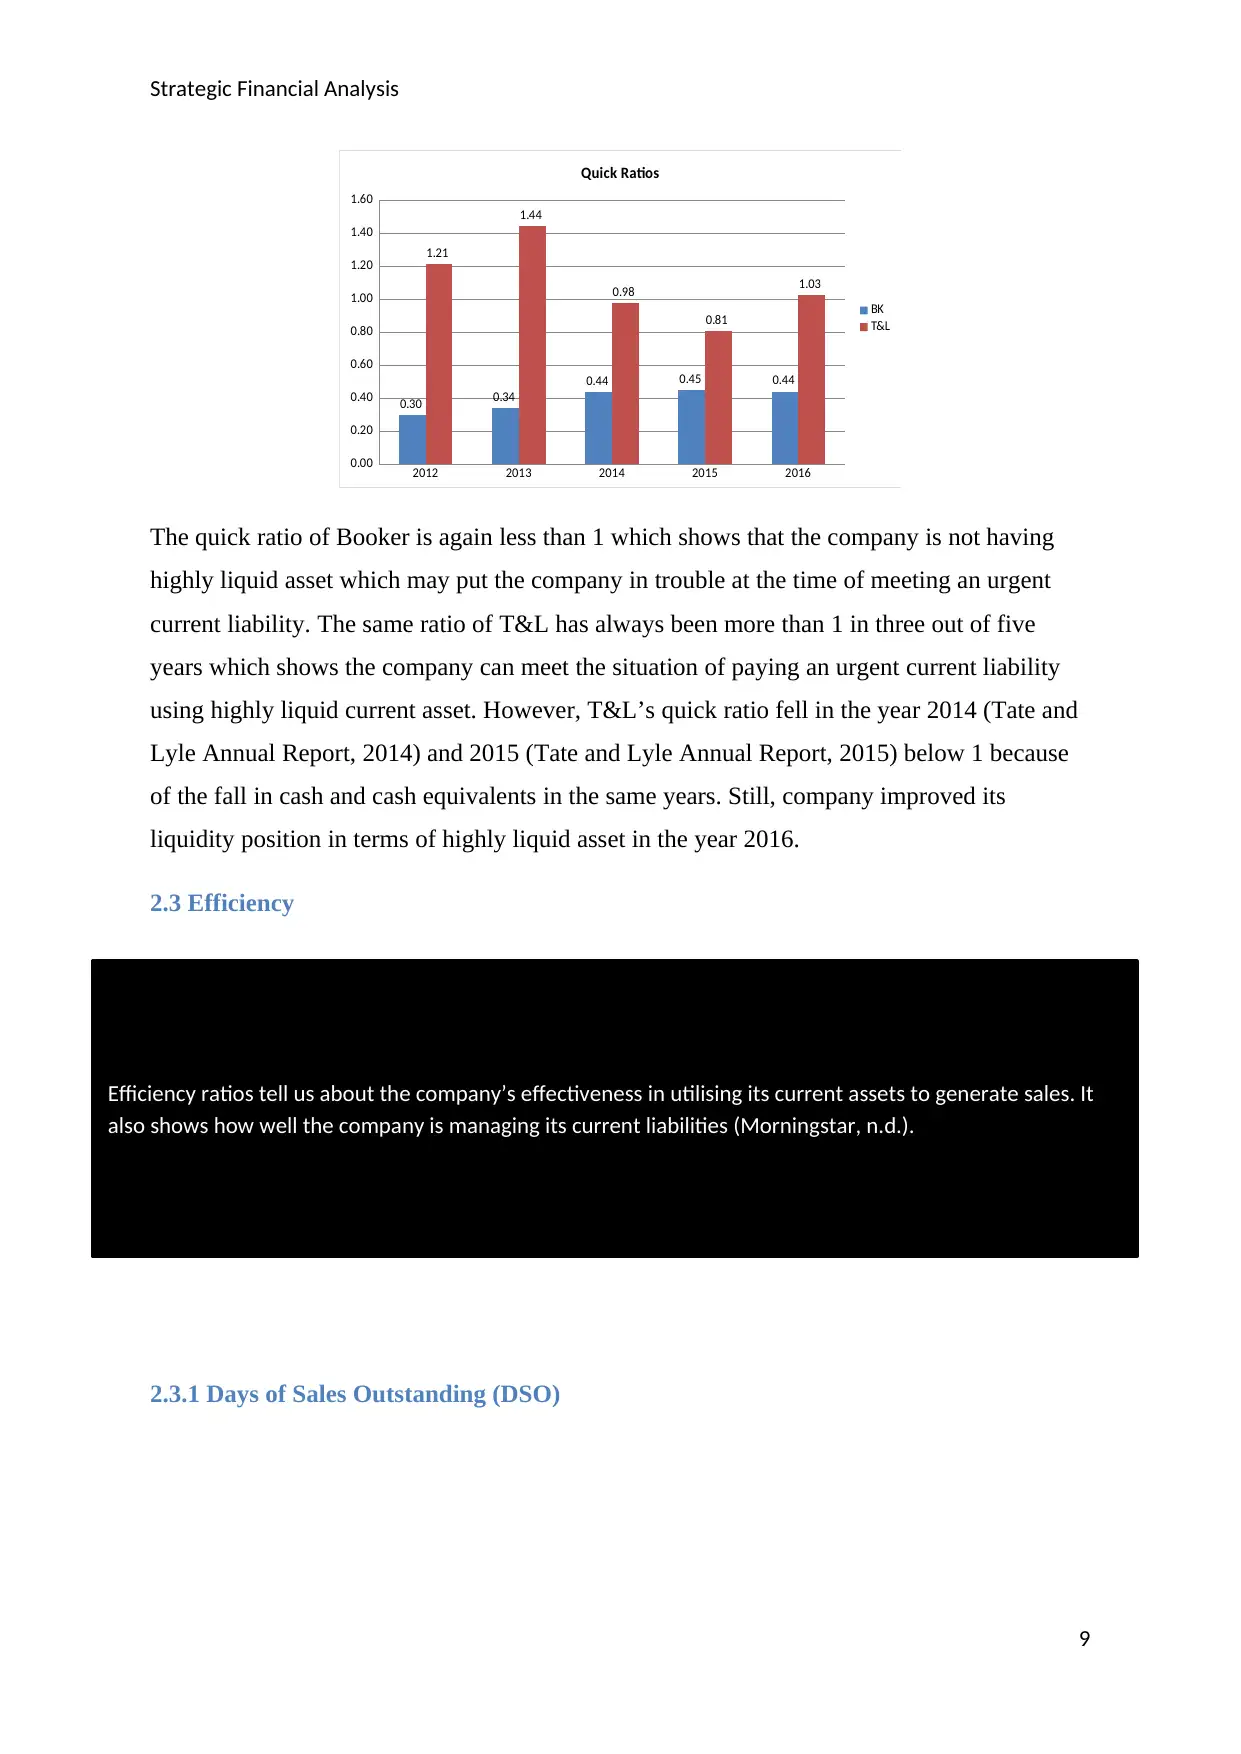
The quick ratio of Booker is again less than 1 which shows that the company is not having
highly liquid asset which may put the company in trouble at the time of meeting an urgent
current liability. The same ratio of T&L has always been more than 1 in three out of five
years which shows the company can meet the situation of paying an urgent current liability
using highly liquid current asset. However, T&L’s quick ratio fell in the year 2014 (Tate and
Lyle Annual Report, 2014) and 2015 (Tate and Lyle Annual Report, 2015) below 1 because
of the fall in cash and cash equivalents in the same years. Still, company improved its
liquidity position in terms of highly liquid asset in the year 2016.
2.3 Efficiency
2.3.1 Days of Sales Outstanding (DSO)
9
Efficiency ratios tell us about the company’s effectiveness in utilising its current assets to generate sales. It
also shows how well the company is managing its current liabilities (Morningstar, n.d.).
2012 2013 2014 2015 2016
0.00
0.20
0.40
0.60
0.80
1.00
1.20
1.40
1.60
0.30 0.34
0.44 0.45 0.44
1.21
1.44
0.98
0.81
1.03
Quick Ratios
BK
T&L
The quick ratio of Booker is again less than 1 which shows that the company is not having
highly liquid asset which may put the company in trouble at the time of meeting an urgent
current liability. The same ratio of T&L has always been more than 1 in three out of five
years which shows the company can meet the situation of paying an urgent current liability
using highly liquid current asset. However, T&L’s quick ratio fell in the year 2014 (Tate and
Lyle Annual Report, 2014) and 2015 (Tate and Lyle Annual Report, 2015) below 1 because
of the fall in cash and cash equivalents in the same years. Still, company improved its
liquidity position in terms of highly liquid asset in the year 2016.
2.3 Efficiency
2.3.1 Days of Sales Outstanding (DSO)
9
Efficiency ratios tell us about the company’s effectiveness in utilising its current assets to generate sales. It
also shows how well the company is managing its current liabilities (Morningstar, n.d.).
Paraphrase This Document
Need a fresh take? Get an instant paraphrase of this document with our AI Paraphraser
Strategic Financial Analysis
2012 2013 2014 2015 2016
0
5
10
15
20
25
30
35
40
4 5 5 5 7
31
33
37 37 38
Days of Sales Outstanding
BK
T&L
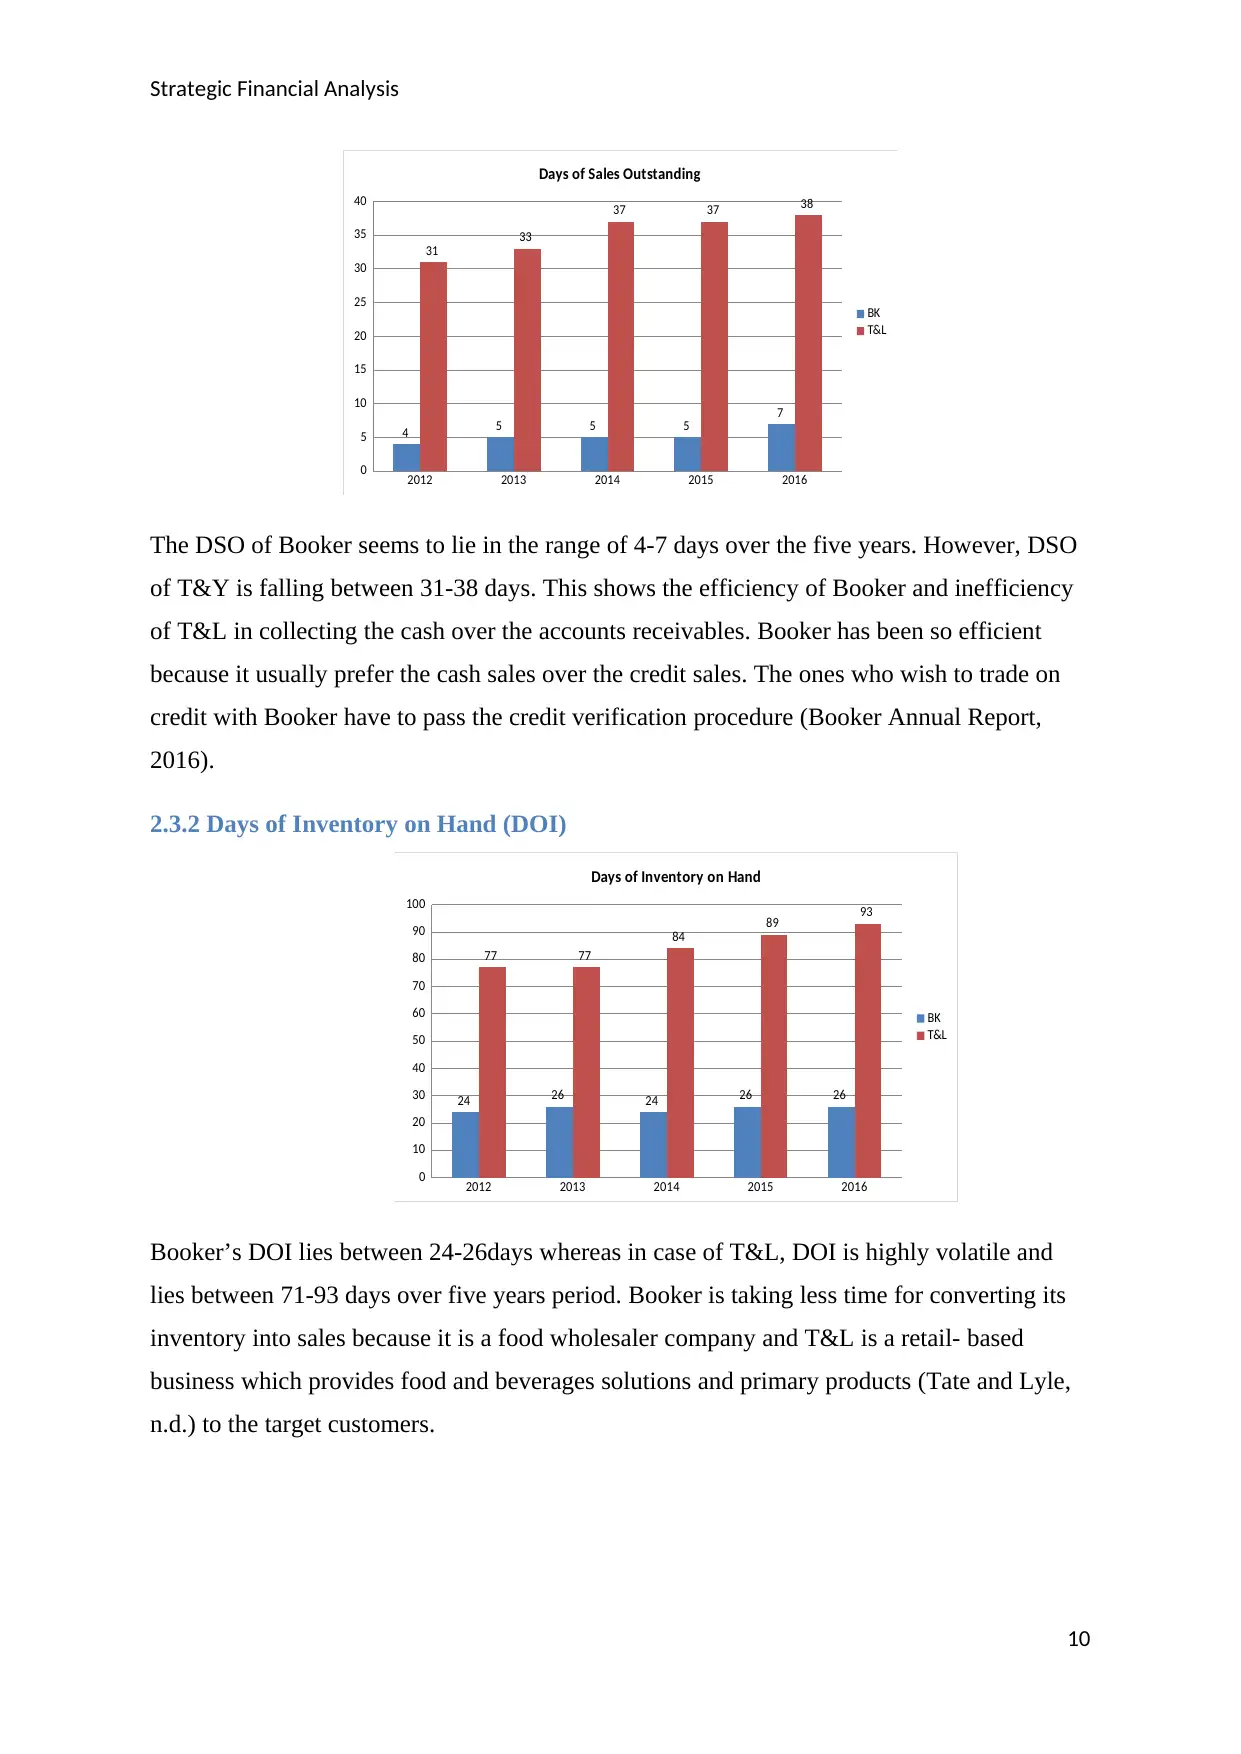
The DSO of Booker seems to lie in the range of 4-7 days over the five years. However, DSO
of T&Y is falling between 31-38 days. This shows the efficiency of Booker and inefficiency
of T&L in collecting the cash over the accounts receivables. Booker has been so efficient
because it usually prefer the cash sales over the credit sales. The ones who wish to trade on
credit with Booker have to pass the credit verification procedure (Booker Annual Report,
2016).
2.3.2 Days of Inventory on Hand (DOI)
2012 2013 2014 2015 2016
0
10
20
30
40
50
60
70
80
90
100
24 26 24 26 26
77 77
84 89 93
Days of Inventory on Hand
BK
T&L
Booker’s DOI lies between 24-26days whereas in case of T&L, DOI is highly volatile and
lies between 71-93 days over five years period. Booker is taking less time for converting its
inventory into sales because it is a food wholesaler company and T&L is a retail- based
business which provides food and beverages solutions and primary products (Tate and Lyle,
n.d.) to the target customers.
10
2012 2013 2014 2015 2016
0
5
10
15
20
25
30
35
40
4 5 5 5 7
31
33
37 37 38
Days of Sales Outstanding
BK
T&L
The DSO of Booker seems to lie in the range of 4-7 days over the five years. However, DSO
of T&Y is falling between 31-38 days. This shows the efficiency of Booker and inefficiency
of T&L in collecting the cash over the accounts receivables. Booker has been so efficient
because it usually prefer the cash sales over the credit sales. The ones who wish to trade on
credit with Booker have to pass the credit verification procedure (Booker Annual Report,
2016).
2.3.2 Days of Inventory on Hand (DOI)
2012 2013 2014 2015 2016
0
10
20
30
40
50
60
70
80
90
100
24 26 24 26 26
77 77
84 89 93
Days of Inventory on Hand
BK
T&L
Booker’s DOI lies between 24-26days whereas in case of T&L, DOI is highly volatile and
lies between 71-93 days over five years period. Booker is taking less time for converting its
inventory into sales because it is a food wholesaler company and T&L is a retail- based
business which provides food and beverages solutions and primary products (Tate and Lyle,
n.d.) to the target customers.
10
Strategic Financial Analysis
2.3.3 Days of Payables (DOP)
2012 2013 2014 2015 2016
0
10
20
30
40
50
60
38 40 38 40 4242 42 44
51
55
Days of Payables
BK
T&L
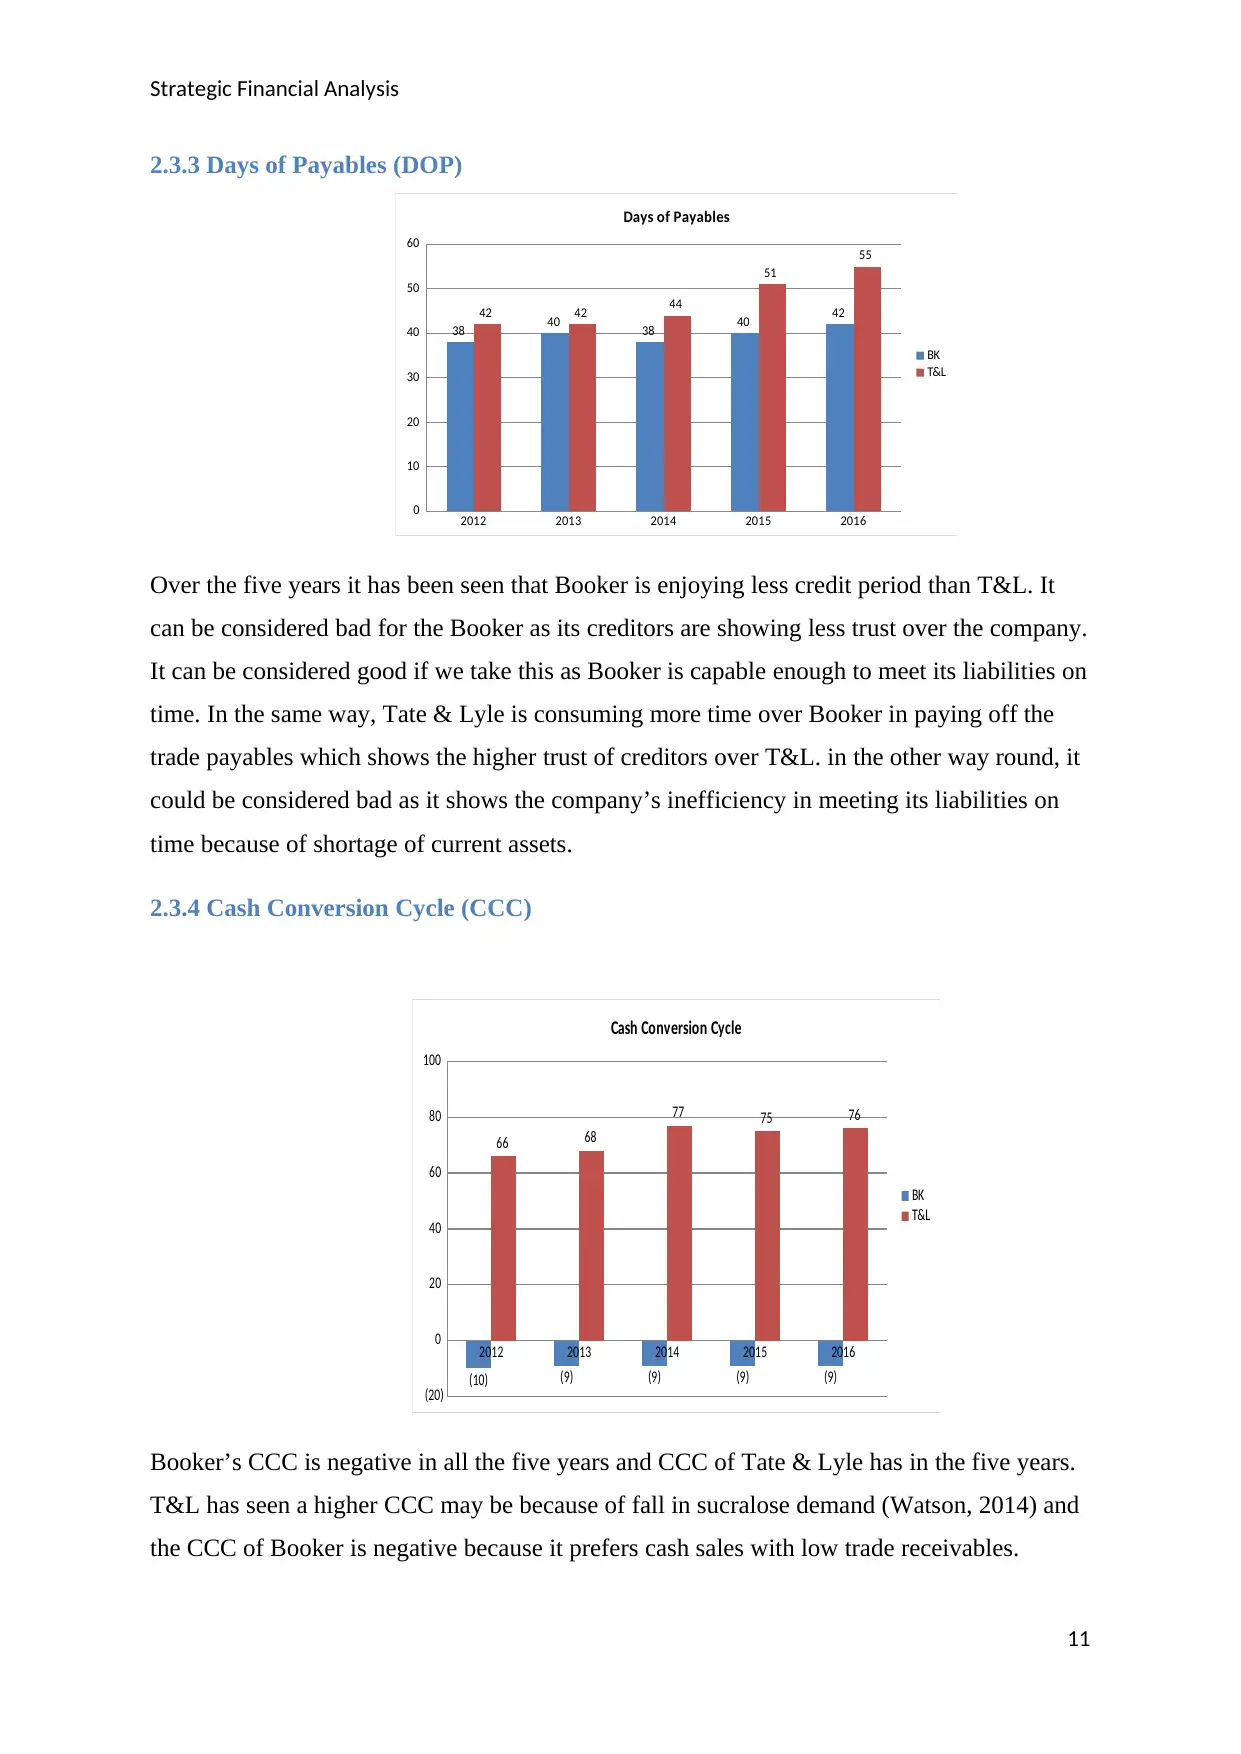
Over the five years it has been seen that Booker is enjoying less credit period than T&L. It
can be considered bad for the Booker as its creditors are showing less trust over the company.
It can be considered good if we take this as Booker is capable enough to meet its liabilities on
time. In the same way, Tate & Lyle is consuming more time over Booker in paying off the
trade payables which shows the higher trust of creditors over T&L. in the other way round, it
could be considered bad as it shows the company’s inefficiency in meeting its liabilities on
time because of shortage of current assets.
2.3.4 Cash Conversion Cycle (CCC)
2012 2013 2014 2015 2016
(20)
0
20
40
60
80
100
(10) (9) (9) (9) (9)
66 68
77 75 76
Cash Conversion Cycle
BK
T&L
Booker’s CCC is negative in all the five years and CCC of Tate & Lyle has in the five years.
T&L has seen a higher CCC may be because of fall in sucralose demand (Watson, 2014) and
the CCC of Booker is negative because it prefers cash sales with low trade receivables.
11
2.3.3 Days of Payables (DOP)
2012 2013 2014 2015 2016
0
10
20
30
40
50
60
38 40 38 40 4242 42 44
51
55
Days of Payables
BK
T&L
Over the five years it has been seen that Booker is enjoying less credit period than T&L. It
can be considered bad for the Booker as its creditors are showing less trust over the company.
It can be considered good if we take this as Booker is capable enough to meet its liabilities on
time. In the same way, Tate & Lyle is consuming more time over Booker in paying off the
trade payables which shows the higher trust of creditors over T&L. in the other way round, it
could be considered bad as it shows the company’s inefficiency in meeting its liabilities on
time because of shortage of current assets.
2.3.4 Cash Conversion Cycle (CCC)
2012 2013 2014 2015 2016
(20)
0
20
40
60
80
100
(10) (9) (9) (9) (9)
66 68
77 75 76
Cash Conversion Cycle
BK
T&L
Booker’s CCC is negative in all the five years and CCC of Tate & Lyle has in the five years.
T&L has seen a higher CCC may be because of fall in sucralose demand (Watson, 2014) and
the CCC of Booker is negative because it prefers cash sales with low trade receivables.
11
⊘ This is a preview!⊘
Do you want full access?
Subscribe today to unlock all pages.
Trusted by 1+ million students worldwide
1 out of 35
Related Documents


Your All-in-One AI-Powered Toolkit for Academic Success.
+13062052269
info@desklib.com
Available 24*7 on WhatsApp / Email
![[object Object]](/_next/static/media/star-bottom.7253800d.svg)
Unlock your academic potential
Copyright © 2020–2026 A2Z Services. All Rights Reserved. Developed and managed by ZUCOL.