Strategic Financial Analysis Report: Wolseley and Booker Comparison
VerifiedAdded on 2020/04/15
|29
|6247
|271
Report
AI Summary
This report presents a strategic financial analysis of Wolseley and Booker, employing both traditional and contemporary methods. It begins with a critical review of horizontal, vertical, and ratio analysis, providing detailed analyses of financial statements, including income statements, balance sheets, and cash flow statements. The report then delves into contemporary methods, such as the Capital Asset Pricing Model (CAPM), dividend growth model, and effective market hypothesis, assessing their strengths and weaknesses. The analysis includes a comparative study of the two companies' financial performances, utilizing data from 2012 to 2016. The study also discusses the limitations of each method and concludes with a comprehensive evaluation of the tools available for assessing an organization's financial position. Appendices provide detailed financial data and calculations to support the analysis.
Running head: STRATEGIC FINANCIAL ANALYSIS
Strategic Financial Analysis
Name of the Student
Name of the University
Authors Note
Course ID
Strategic Financial Analysis
Name of the Student
Name of the University
Authors Note
Course ID
Paraphrase This Document
Need a fresh take? Get an instant paraphrase of this document with our AI Paraphraser
1STRATEGIC FINANCIAL ANALYSIS
Table of Contents
Introduction:...............................................................................................................................2
Critical review of Traditional Methods of Financial Analysis:.................................................2
Horizontal Analysis:...................................................................................................................2
Vertical analysis:........................................................................................................................4
Traditional Ratio Analysis:........................................................................................................5
Contemporary methods of financial analysis:............................................................................6
Capital asset pricing model (CAPM):........................................................................................6
Dividend growth model:............................................................................................................7
Effective market hypothesis:......................................................................................................9
Conclusion:..............................................................................................................................10
Reference List:.........................................................................................................................12
Appendix:.................................................................................................................................14
Horizontal Analysis..................................................................................................................14
Wolseley:..................................................................................................................................14
Income Statement:....................................................................................................................14
Balance Sheet:..........................................................................................................................14
Cash Flow Statement:..............................................................................................................16
Booker......................................................................................................................................17
Income Statement:....................................................................................................................17
Balance Sheet:..........................................................................................................................17
2STRATEGIC FINANCIAL ANALYSIS
Cash Flow Statement:..............................................................................................................18
Vertical Analysis:.....................................................................................................................19
Wolseley...................................................................................................................................19
Income Statement:....................................................................................................................19
Balance Sheet:..........................................................................................................................19
Cash Flow Statement:..............................................................................................................21
Income Statement Analysis:.....................................................................................................21
Booker:.....................................................................................................................................21
Balance Sheet:..........................................................................................................................22
Cash Flow Statement:..............................................................................................................23
Ratio Analysis:.........................................................................................................................24
Wolseley:..................................................................................................................................24
Booker:.....................................................................................................................................25
⊘ This is a preview!⊘
Do you want full access?
Subscribe today to unlock all pages.
Trusted by 1+ million students worldwide
3STRATEGIC FINANCIAL ANALYSIS
Introduction:
The present study is concerned with performing a critical analysis of the several
traditional and modern approaches that are involved in the determination of the fiscal and
operational situation of the organization. Numerous financial analysis elements have been
proposed and assessed by the researchers from the very long time. The most recognized
method of analysis the financial report is the vertical and horizontal method of analysis for
analysing the financial position of an organization. Another important tool of measuring the
financial analysis is the ratio analysis that helps in determining the financial position of a firm
(Deegan 2013). Ratio analysis is treated as the central part of the financial analysis since it
assesses an organizations financial aspects by investigating into the rotational and financial
activities of the firm.
The study will be performing a critical analysis of the finical positon of the Wolseley
and Booker by applying the tools of financial analysis such as the vertical, horizontal and
ratio analysis to assess the operational efficiency of the company. As an alternative to this,
other methods such as Capital asset pricing method, dividend growth model and effective
market hypothesis will be implemented (Williams 2014). The study will cover the descriptive
analysis of the models and would be addressing the shortcoming that is accompanied by the
model. Additionally, a conclusive evidence will be presented to present the tool that is
available in the analysis of the fiscal positon of the organization.
Critical review of Traditional Methods of Financial Analysis:
Horizontal Analysis:
One of the most widely used tool of performing financial analysis is the horizontal
analysis (Whitecotton, Libby and Phillips 2013). Horizontal analysis are those statements that
offer profitable and financial position of a firm for numerous period in respect of comparative
Paraphrase This Document
Need a fresh take? Get an instant paraphrase of this document with our AI Paraphraser
4STRATEGIC FINANCIAL ANALYSIS
form to provide an overview of the financial position of the company for more than two
accounting period. Horizontal analysis is applicable to the to the financial statements namely
income statement and statement of financial position to comparatively draw the financial
position of the organization. The data derived from the horizontal analysis provides a
comparative overview of the company with similar principles of accounting is put into the
use preparing those statements (Weil, Schipper and Francis 2013). If this is not the situation,
any kind of changes in the methods of accounting principles should be methods in the
footnotes.
As evident from the financial assessment a fluctuating trend is noticed for Wolseley.
On performing a detailed analysis, it is noticed that Wolseley has reported a declining line of
trend for the sales recorded since the company had incurred a declining trend of sales in 2012
and 2013. Notably, the organization in the subsequent years of 2015 and 2016 the sales
revenue of Wolseley gained strength as the company recorded a rising trend of sales in those
years. Conversely, Booker reported a mix trend of performance as the revenue for the year
2014 gained to 17.27% from the previously recorded figures of 1.51% which subsequently
declined in the following years of 2015 and 2016 to 1.53 and 5.02% respectively. The
revenue reported by the company represented a declining trend in the following year of 2015
though gaining marginally in the following year of 2016. Therefore, it can be stated that the
horizontal analysis is considered as the beneficial for the readers because it offers them with
the benefit of assessing and comparing the financial position of the organization for a specific
period.
Additionally, the method of horizontal analysis suffers from shortcomings as the
aggregate information in the financial statements might be changed over the specific period
(Bushman 2014). The reason behind this is that the continuous changes in the accounting
may be shifted to different accounts and result in alterations in the accounting period. The
5STRATEGIC FINANCIAL ANALYSIS
analysis suffers from criticisms as it does not take into the consideration the impacts of the
inflation or current market value of cost. Additionally, these analysis have very small bearing
on the future of the company such as technological obsolescence, future decision of
management and varying trends in market.
Vertical analysis:
There are some forms of statements that reflects that the association of numerous
items on the financial statements having similar components by reflecting each component as
the percentage of common constituents (Henderson et al. 2015). Vertical analysis is referred
as the proportional analysis of the financial statements in which every line of items of the
financial statements is logged as the percentage of the other constituents. Characteristically, it
states that every line of item in the profit and loss account is regarded as the percentage of
total sales whereas on the balance sheet every line of item is regarded as the total sales
percentage.
Taking into the consideration the vertical analysis of the companies it is found that
Booker reported a profit from its business 11.88 and 8.58 respectively for the financial year
of 2015 and 2016. It can be stated that the company reported declining trend of profit in the
subsequent year of 2016. Conversely, it is found that Wolseley reported a profit for the
financial year of 2013-14 stood 2.25% and 4.11% accordingly. Nevertheless, in the
subsequent year of 2015 and 2016 the profit from the operations of the company for the
shareholders arrived at 1.60% and 4.57% respectively.
Whereas taking into the considerations the short comings associated with the vertical
analysis there are certain limitations that have been associated in the analysis. In the words of
Pratt (2016), assesses the tool because it does not meet the significant changes in relation to
the extent of inflationary effect. Therefore, the results generated from the inputs could be
⊘ This is a preview!⊘
Do you want full access?
Subscribe today to unlock all pages.
Trusted by 1+ million students worldwide
6STRATEGIC FINANCIAL ANALYSIS
considered as deceptive because the financial information is relatively dependent on the
historical cost. Another criticism surrounding the vertical analysis is that it fails to consider
the qualitative elements while assessing the performance of the firm such as the work quality,
association with the stakeholders etc. The vertical analysis is only focussed on the liquidity
aspects of the analysis and does not takes into the considerations the current ratio and debt
ratio that comprises of the entitlement of the determining the liquidity and solvency (May
2013). The usefulness of the vertical analysis breaks down when an organization reports
fluctuating figures in every quarter in each year. As a result of this the numbers become more
erratic when the amount of reported earnings fluctuates in each quarter. Therefore, vertical
analysis suffers from the limitations of fluctuating numbers.
Traditional Ratio Analysis:
Ratio analysis is regarded as the most commonly method of assessing the financial
and functional efficiency of the organization. According to Marshall (2016), it has been
stated that the ratio analysis is important in ascertaining the organizational efficiencies
regarding the functional and financial performance. The ratio analysis provides the managers
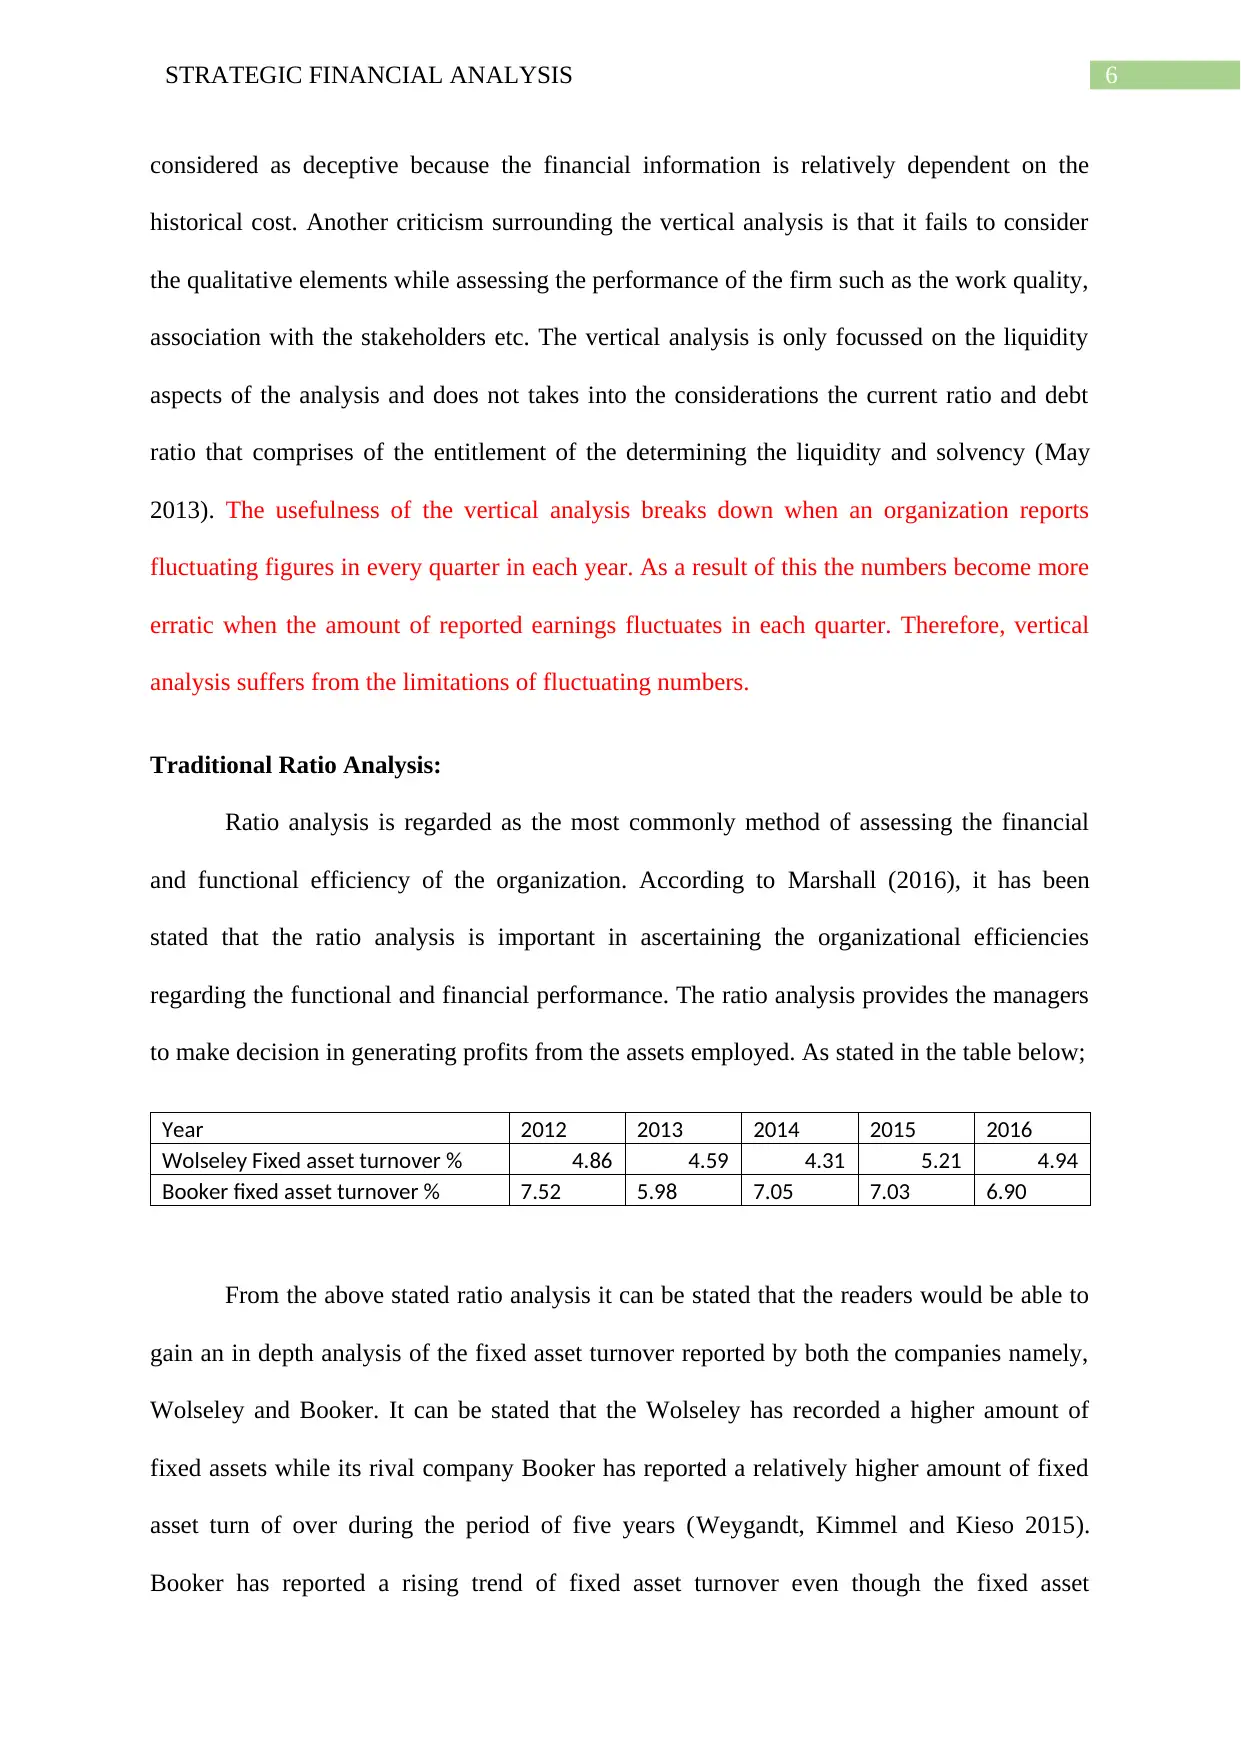
to make decision in generating profits from the assets employed. As stated in the table below;
Year 2012 2013 2014 2015 2016
Wolseley Fixed asset turnover % 4.86 4.59 4.31 5.21 4.94
Booker fixed asset turnover % 7.52 5.98 7.05 7.03 6.90
From the above stated ratio analysis it can be stated that the readers would be able to
gain an in depth analysis of the fixed asset turnover reported by both the companies namely,
Wolseley and Booker. It can be stated that the Wolseley has recorded a higher amount of
fixed assets while its rival company Booker has reported a relatively higher amount of fixed
asset turn of over during the period of five years (Weygandt, Kimmel and Kieso 2015).
Booker has reported a rising trend of fixed asset turnover even though the fixed asset
considered as deceptive because the financial information is relatively dependent on the
historical cost. Another criticism surrounding the vertical analysis is that it fails to consider
the qualitative elements while assessing the performance of the firm such as the work quality,
association with the stakeholders etc. The vertical analysis is only focussed on the liquidity
aspects of the analysis and does not takes into the considerations the current ratio and debt
ratio that comprises of the entitlement of the determining the liquidity and solvency (May
2013). The usefulness of the vertical analysis breaks down when an organization reports
fluctuating figures in every quarter in each year. As a result of this the numbers become more
erratic when the amount of reported earnings fluctuates in each quarter. Therefore, vertical
analysis suffers from the limitations of fluctuating numbers.
Traditional Ratio Analysis:
Ratio analysis is regarded as the most commonly method of assessing the financial
and functional efficiency of the organization. According to Marshall (2016), it has been
stated that the ratio analysis is important in ascertaining the organizational efficiencies
regarding the functional and financial performance. The ratio analysis provides the managers
to make decision in generating profits from the assets employed. As stated in the table below;
Year 2012 2013 2014 2015 2016
Wolseley Fixed asset turnover % 4.86 4.59 4.31 5.21 4.94
Booker fixed asset turnover % 7.52 5.98 7.05 7.03 6.90
From the above stated ratio analysis it can be stated that the readers would be able to
gain an in depth analysis of the fixed asset turnover reported by both the companies namely,
Wolseley and Booker. It can be stated that the Wolseley has recorded a higher amount of
fixed assets while its rival company Booker has reported a relatively higher amount of fixed
asset turn of over during the period of five years (Weygandt, Kimmel and Kieso 2015).
Booker has reported a rising trend of fixed asset turnover even though the fixed asset
Paraphrase This Document
Need a fresh take? Get an instant paraphrase of this document with our AI Paraphraser
7STRATEGIC FINANCIAL ANALYSIS
turnover ratio reported by the company declined in the year 2013 to 5.98 however in the
following years of 2014 it gained strength as the company reported fixed asset turnover of
7.05.
In addition to this, ratio analysis is regarded as the efficient method of identifying the
limitations relating to the performing the operations of the companies even though the
company reported an overall better performance (Narayanaswamy 2017). The information
derived by the managers and higher level authorities assist in taking decision by assessing the
past performance.
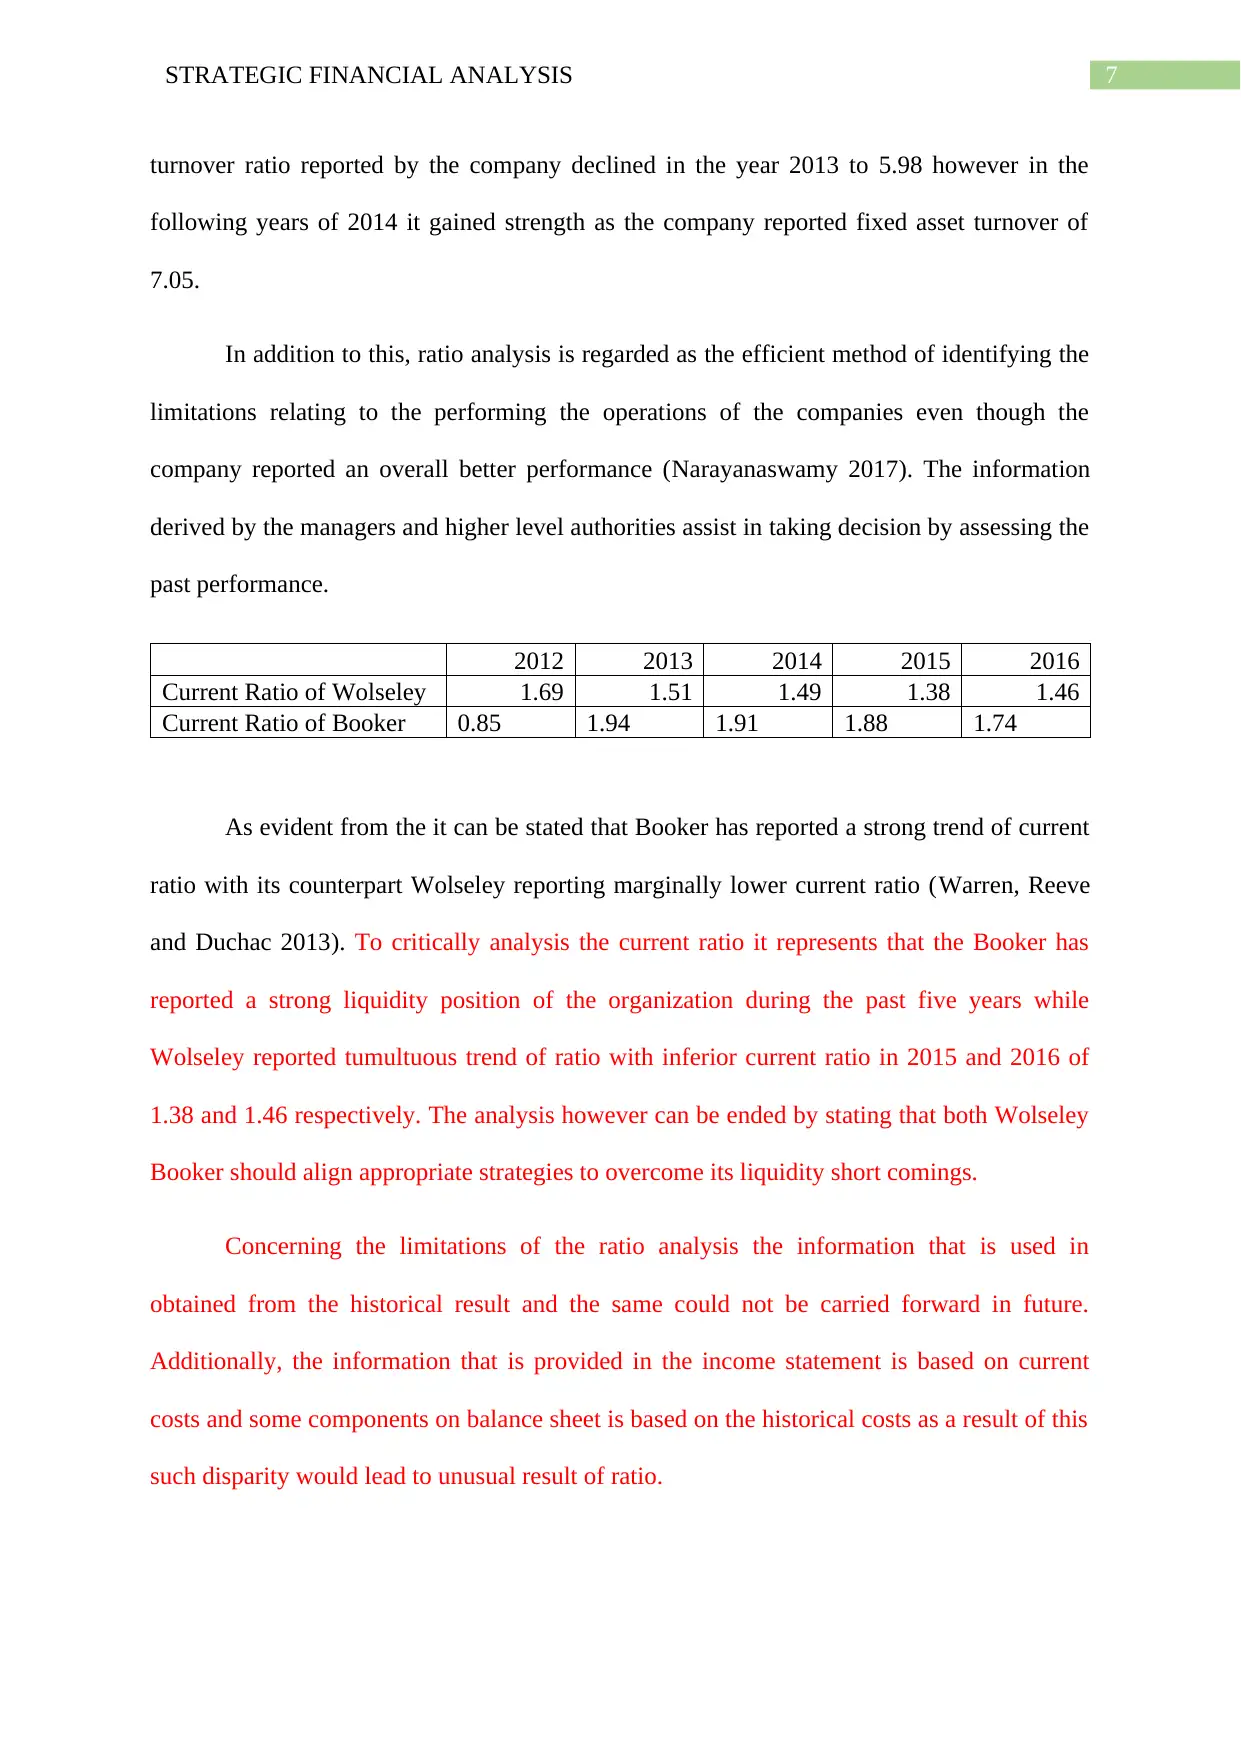
2012 2013 2014 2015 2016
Current Ratio of Wolseley 1.69 1.51 1.49 1.38 1.46
Current Ratio of Booker 0.85 1.94 1.91 1.88 1.74
As evident from the it can be stated that Booker has reported a strong trend of current
ratio with its counterpart Wolseley reporting marginally lower current ratio (Warren, Reeve
and Duchac 2013). To critically analysis the current ratio it represents that the Booker has
reported a strong liquidity position of the organization during the past five years while
Wolseley reported tumultuous trend of ratio with inferior current ratio in 2015 and 2016 of
1.38 and 1.46 respectively. The analysis however can be ended by stating that both Wolseley
Booker should align appropriate strategies to overcome its liquidity short comings.
Concerning the limitations of the ratio analysis the information that is used in
obtained from the historical result and the same could not be carried forward in future.
Additionally, the information that is provided in the income statement is based on current
costs and some components on balance sheet is based on the historical costs as a result of this
such disparity would lead to unusual result of ratio.
turnover ratio reported by the company declined in the year 2013 to 5.98 however in the
following years of 2014 it gained strength as the company reported fixed asset turnover of
7.05.
In addition to this, ratio analysis is regarded as the efficient method of identifying the
limitations relating to the performing the operations of the companies even though the
company reported an overall better performance (Narayanaswamy 2017). The information
derived by the managers and higher level authorities assist in taking decision by assessing the
past performance.
2012 2013 2014 2015 2016
Current Ratio of Wolseley 1.69 1.51 1.49 1.38 1.46
Current Ratio of Booker 0.85 1.94 1.91 1.88 1.74
As evident from the it can be stated that Booker has reported a strong trend of current
ratio with its counterpart Wolseley reporting marginally lower current ratio (Warren, Reeve
and Duchac 2013). To critically analysis the current ratio it represents that the Booker has
reported a strong liquidity position of the organization during the past five years while
Wolseley reported tumultuous trend of ratio with inferior current ratio in 2015 and 2016 of
1.38 and 1.46 respectively. The analysis however can be ended by stating that both Wolseley
Booker should align appropriate strategies to overcome its liquidity short comings.
Concerning the limitations of the ratio analysis the information that is used in
obtained from the historical result and the same could not be carried forward in future.
Additionally, the information that is provided in the income statement is based on current
costs and some components on balance sheet is based on the historical costs as a result of this
such disparity would lead to unusual result of ratio.
8STRATEGIC FINANCIAL ANALYSIS
Contemporary methods of financial analysis:
Capital asset pricing model (CAPM):
The method of capital asset pricing model is reliant on certain assumptions having
similarity with the CAPM and MPT. There is a wide appreciation of the mode relating to its
capability of computing the risk effectively. As stated by the Ross (2013), he considers the
model of the CAPM as the instrument of the systematic risk so that the investors can
diversify their risk involved in the portfolio by removing the unsystematic risk. In addition to
this, the model has been reinforced in comparing the perspective of the CAPM by comparing
it in the market. There are certain investors that uses this model to maximize the usefulness of
the capital. The central difference between model is that firms generally prefer in taking into
the account the concept of utility.
While some have preferred taking large amount of risk which would have rising
marginal utility on capital (Kuehn, Simutin and Wang 2017). There are other investors that
prefer less risk in raising capital and would be regarded as less attractive if it is attached with
greater volume of risk. The model of CAPM is regarded as one of the better tool for investors
for making investment appraisal since it offers sufficient association with the needed rate of
return and methodical risk. The modern process of CAPM overcomes the limitations of the
other forms of traditional model by addressing the risk through performing comparison of the
performance which is not considered by the traditional method of analysis.
Investors have similar expectations relating to the risk and return. However, without
the consensus standard the estimations is associated with the mean variance that may lead to
varied forecast result where critical portfolio of each investors would not be identical from
the others. As noted that investors do not have similar expectations there would no similarity
in their notion and single effective frontline would be applied to each portfolio (Barberis et
⊘ This is a preview!⊘
Do you want full access?
Subscribe today to unlock all pages.
Trusted by 1+ million students worldwide
9STRATEGIC FINANCIAL ANALYSIS
al. 2013). According to the assumptions made under the CAPM, the expected rate of return
and market return is equal to the required rate of return for the stated amount of risk. The
model of CAPM provides liner link among the required rate of and it is linked with the
market risk or the Beta which is not possible to avoid.
The CAPM is not regarded as realistic because it is based on the assumption that each
investors are averse to risk and with higher amount risk leading to higher rate of return. Even
after obtaining high amount of support, the CAPM model possess certain kind of
shortcomings. Initially the mode of CAPM is reliant on the assumptions that have introduced
the queries reliant on the certainty of the model because the existence of the perfect market is
not present from the pricing model (Zabarankin Pavlikov and Uryasev 2014). Additionally,
investors borrowing is not done at the risk free rate and it reflects that original security
market line would be vertical. Relating to competition under CAPM, investment appraisal
offers wider insight on the investment returns while the model of CAPM limits the time to
short and single period.
Dividend growth model:
The model of Dividend Growth is regarded as the widely known model in the finance
which uses the value so that it assesses the essential values of the stocks. The dividend
growth model is based on the assumption that direct functions of the cash flow is expected in
the future. In respect of the common stock, the cash flow represents the dividends which is
paid together with the value of the common stock when they are sold (Jordan 2014). The
value of the share that is generated from the future stream of dividends is regarded as the
inherent price of stocks. On assuming that the dividends are paid at the end of the year, an
investor would be able to predict the fair price of stock that can be held for three years.
Paraphrase This Document
Need a fresh take? Get an instant paraphrase of this document with our AI Paraphraser
10STRATEGIC FINANCIAL ANALYSIS
As stated by the Bodie, Kane and Marcus (2014), the benefit of using the dividend
growth model is that it provides consistency because dividends usually last for a long period
of time in respect to the other component such as earnings. As stated by Kung and Schmid
(2015), additionally supports the model for the wide aspects of coverage which takes into the
account the minority stakeholders. It is noteworthy to denote that dividend growth model is
the effective tool in comparison to the traditional analysis because it provides the companies
with the facilities of comparing different industries and market conditions which is primarily
restricted to ratio analysis.
The model of dividend growth provides an opportunity of creating explicit returns
along with the individual stocks and aggregate market (Belo et al. 2015). The Dividend
Growth Model effectively contributes in the appraisal of comparative attractiveness of the
individual stocks along with the assessment of the stock attractiveness in the market for the
overall allocation of the asset. Furthermore, the model of dividend growth model offers the
effectiveness in assessing the factors of risk namely changes in the interest rate with varying
amount of inflation rate lead to an impact on the stock.
Despite the achievement of the model, there are certain forms of shortcomings that is
associated with the model. As stated by Jovanovic, Andreadakis and Schinckus (2016), the
dividend growth model is dependent on the inputs because slight variation in the required rate
of return a constant growth would lead to high variation in the terminal value together with
the price of stock. The model of dividend growth faced criticism for presuming that the rate
of growth is constant which apparently makes the dividend of the company on the liner side
while the indications have suggested that dividend growth model is liner and lead to the
validity of the model to appear in question. The fails to consider the non-dividend element
namely, loyalty for brand, customer retention and ownership of intangible asset that increases
the company’s value. It assumes that the price of stock is hypersensitive to the dividend
11STRATEGIC FINANCIAL ANALYSIS
growth rate and the rate of growth would not go beyond the cost of equity which usually does
not happens.
Effective market hypothesis:
The theory of effective market hypothesis is considered as the constituents where the
stock prices evidently reflects the info that can be obtained concerning the organizational
value with no other method of deriving additional quantity of profit (Hildenbrand 2014). The
tool of effective market hypothesis is related with the principles and present issues in finance
by looking into the reason regarding the variation in the price and process involved in the
price variation of security market. For an investor the effective market hypothesis consists of
important implications with the managers involved in the traditional method of analysis.
Numerous investors have attempted to identify the securities that is undervalued and
they are expected to raise the value of the stock in the future and particularly those which
might increase more than others have anticipated. Numerous investors together with the
investment management have considered choosing securities that can outclass in the stock
market. They can use numerous forms of valuation and techniques of forecasting to help the
investors in taking investment decision.
Arguably, there are hardly any theory of economics and theories of finance that have
generated more ardent conversation concerning its challenges and proponent. According to
the words of Kelly, Pástor and Veronesi (2016), there are no such theories of economics that
provides a solid empirical evidences of supporting the effective market hypothesis. It must be
noted that the effective market hypothesis provides suggestion that making profit through
price movements is burdensome and improbable prospect. The main component of price
change is the inflow of new indications. A market is regarded as effective given that the price
adjusts speedily and not becoming bias to the new evidences. As a consequence of this,
⊘ This is a preview!⊘
Do you want full access?
Subscribe today to unlock all pages.
Trusted by 1+ million students worldwide
1 out of 29
Related Documents


Your All-in-One AI-Powered Toolkit for Academic Success.
+13062052269
info@desklib.com
Available 24*7 on WhatsApp / Email
![[object Object]](/_next/static/media/star-bottom.7253800d.svg)
Unlock your academic potential
Copyright © 2020–2026 A2Z Services. All Rights Reserved. Developed and managed by ZUCOL.