Strategic Financial Analysis Report - Finance Module, Semester 1
VerifiedAdded on 2020/04/21
|29
|8287
|39
Report
AI Summary
This report provides a comprehensive analysis of both traditional and contemporary methods of strategic financial analysis. It begins with a critical review of traditional techniques like horizontal, vertical, and ratio analysis, examining their strengths and limitations. The report then delves into contemporary methods, including the Capital Asset Pricing Model (CAPM), the dividend growth model, and the efficient market hypothesis, offering descriptions and critiques of each. The financial positions of Wolseley and Rexam are analyzed using horizontal, vertical, and ratio analysis, with detailed financial data and calculations presented in the appendix. The analysis includes an evaluation of fixed asset turnover and current ratios for both companies, and concludes with a discussion of the best available tools for analyzing organizational financial performance. The report emphasizes the importance of understanding both the theoretical underpinnings and the practical applications of these financial analysis methods.
Running head: STRATEGIC FINANCIAL ANALYSIS
Strategic Financial Analysis
Name of the Student
Name of the University
Authors Note
Course ID
Strategic Financial Analysis
Name of the Student
Name of the University
Authors Note
Course ID
Paraphrase This Document
Need a fresh take? Get an instant paraphrase of this document with our AI Paraphraser
1STRATEGIC FINANCIAL ANALYSIS
Table of Contents
Introduction:...............................................................................................................................2
Critical review of Traditional Methods of Financial Analysis:.................................................2
Horizontal Analysis:...................................................................................................................2
Vertical analysis:........................................................................................................................4
Traditional Ratio analysis:.........................................................................................................4
Contemporary methods of financial analysis:............................................................................6
Capital asset Pricing Model:......................................................................................................6
Dividend Growth Model:...........................................................................................................7
Effective market hypothesis:......................................................................................................9
Conclusion:..............................................................................................................................11
Reference List:.........................................................................................................................12
Appendix:.................................................................................................................................15
Horizontal Analysis..................................................................................................................15
Wolseley:..................................................................................................................................15
Income Statement:....................................................................................................................15
Balance Sheet:..........................................................................................................................15
Cash Flow Statement:..............................................................................................................17
Rexam:.....................................................................................................................................18
Income Statement:....................................................................................................................18
Balance Sheet:..........................................................................................................................19
2STRATEGIC FINANCIAL ANALYSIS
Cash Flow Statement:..............................................................................................................20
Vertical Analysis:.....................................................................................................................21
Wolseley...................................................................................................................................21
Income Statement:....................................................................................................................21
Balance Sheet:..........................................................................................................................21
Cash Flow Statement:..............................................................................................................23
Rexam:.....................................................................................................................................23
Income Statement:....................................................................................................................23
Balance Sheet:..........................................................................................................................24
Cash Flow Statements:.............................................................................................................25
⊘ This is a preview!⊘
Do you want full access?
Subscribe today to unlock all pages.
Trusted by 1+ million students worldwide
3STRATEGIC FINANCIAL ANALYSIS
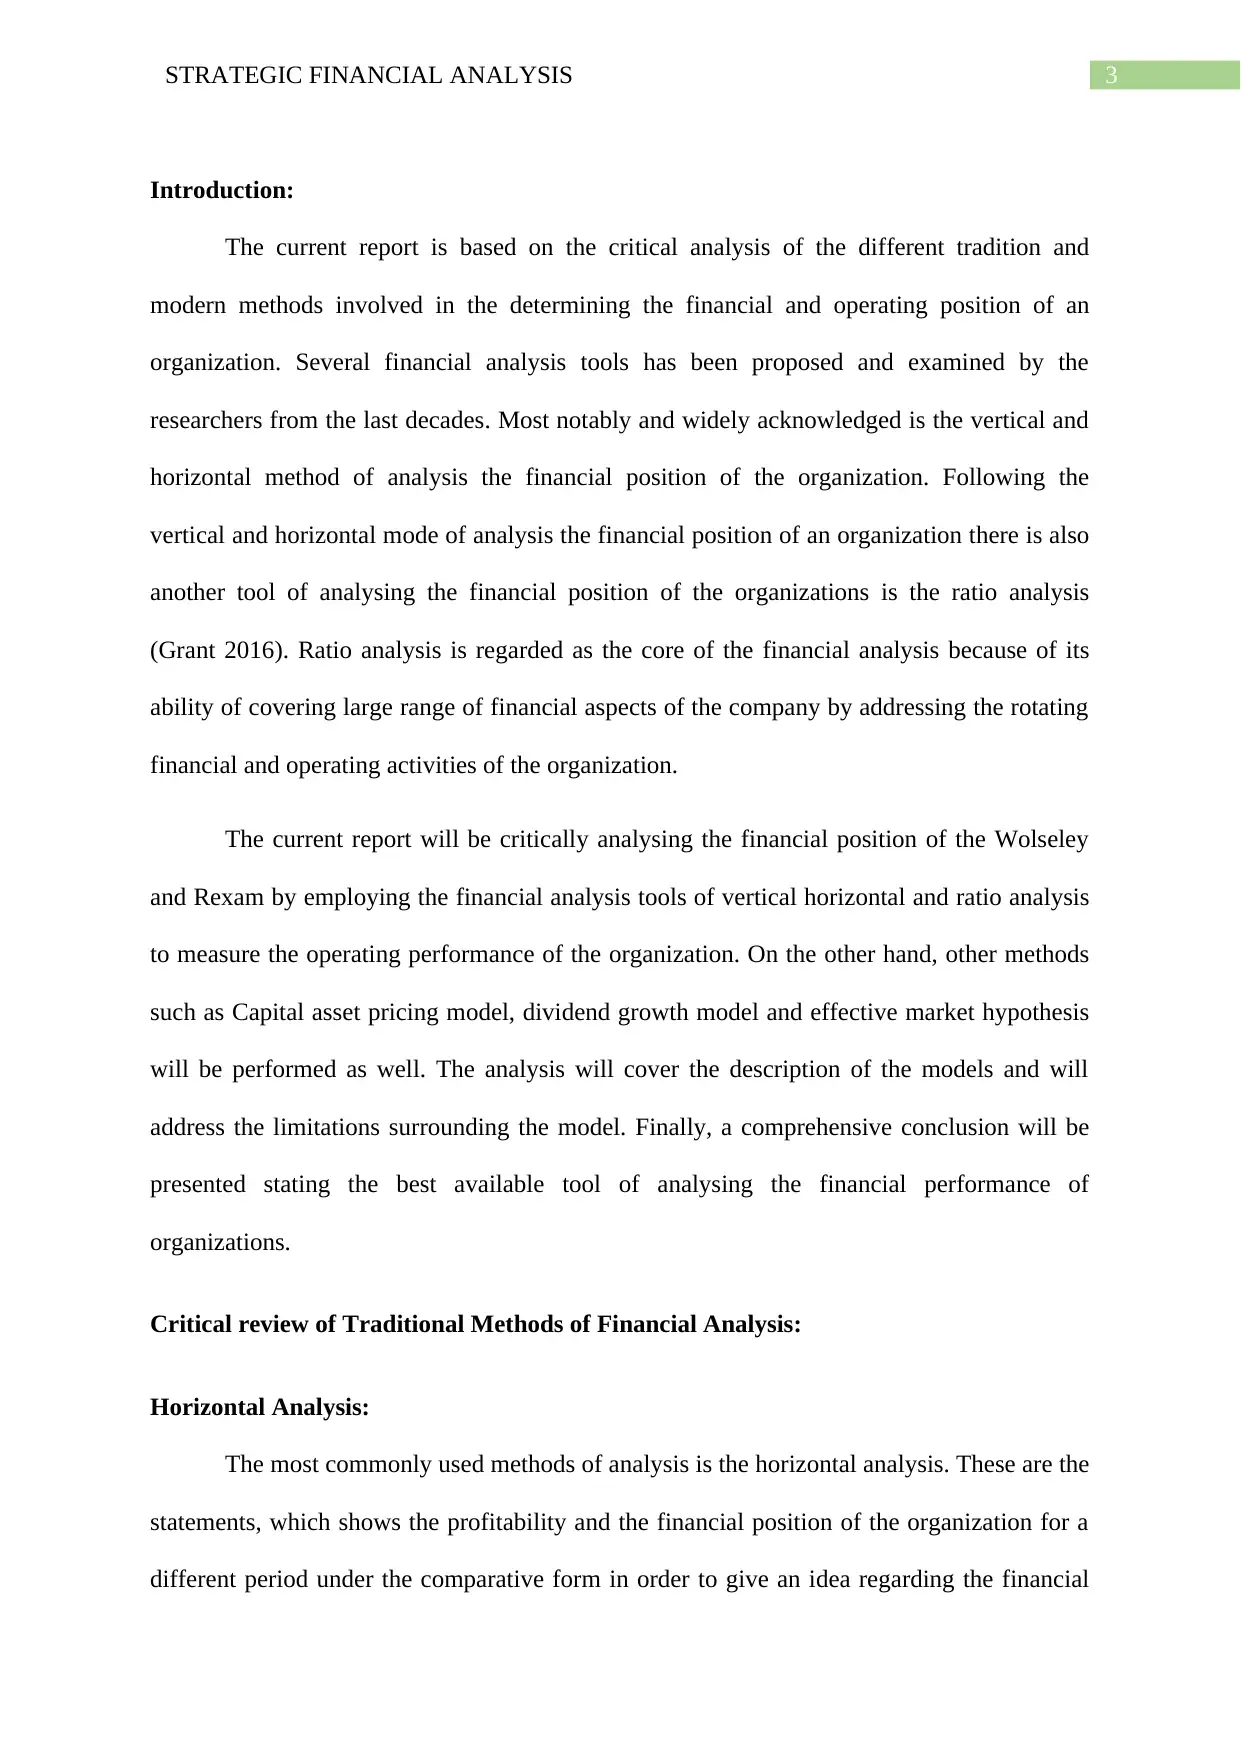
Introduction:
The current report is based on the critical analysis of the different tradition and
modern methods involved in the determining the financial and operating position of an
organization. Several financial analysis tools has been proposed and examined by the
researchers from the last decades. Most notably and widely acknowledged is the vertical and
horizontal method of analysis the financial position of the organization. Following the
vertical and horizontal mode of analysis the financial position of an organization there is also
another tool of analysing the financial position of the organizations is the ratio analysis
(Grant 2016). Ratio analysis is regarded as the core of the financial analysis because of its
ability of covering large range of financial aspects of the company by addressing the rotating
financial and operating activities of the organization.
The current report will be critically analysing the financial position of the Wolseley
and Rexam by employing the financial analysis tools of vertical horizontal and ratio analysis
to measure the operating performance of the organization. On the other hand, other methods
such as Capital asset pricing model, dividend growth model and effective market hypothesis
will be performed as well. The analysis will cover the description of the models and will
address the limitations surrounding the model. Finally, a comprehensive conclusion will be
presented stating the best available tool of analysing the financial performance of
organizations.
Critical review of Traditional Methods of Financial Analysis:
Horizontal Analysis:
The most commonly used methods of analysis is the horizontal analysis. These are the
statements, which shows the profitability and the financial position of the organization for a
different period under the comparative form in order to give an idea regarding the financial
Paraphrase This Document
Need a fresh take? Get an instant paraphrase of this document with our AI Paraphraser
4STRATEGIC FINANCIAL ANALYSIS
position of two or more periods. It is generally applicable to two most important financial
statements particularly the balance sheet and the statement of profit and loss in a comparative
method (Wahlen, Baginski and Bradshaw 2014). The financial data will be comparative
under the circumstances when the identical principles of accounting is used in preparing the
statements. If this is not the situation, changes in the use of the methods of accounting
principles must be mentioned in the footnotes.
As derived from the financial computation a somewhat tumultuous trends is found by
having an in depth analysis for the Wolseley with the falling trend in the sales as the
company suffered a falling trend of sales in the financial year of 2012 and 2013. However, in
the following years of 2015 and 2016 the sales revenue increased for the Wolseley. On the
other hand Rexam reported a blend in their trend of sales as reported by the company during
the financial year. The revenue reported by the company experienced a rising trend of 1.89%
during the year 2011-12 however in the following years of 2012-13 since the revenue
declined by 8.56% which further declined in the subsequent years of 2014-15 by 2.82%. The
trend represented a declining terms of the revenue derivation, which slightly aided in the year
of 2015 with a slight increase of 2.43 for Rexam. Therefore, horizontal analysis is beneficial
for the readers since it provides them with the benefits of examining and comparing the
position of the organization over the years.
However, horizontal analysis suffers from criticism since it suffers from the
shortcoming that the aggregate of the information that is stated in the financial statements
may be changed over the period (Weygandt, Kimmel and Kieso 2015). This is because of the
ongoing changes in the accounts might shift amid different accounts and therefore it causes
variances at the time of comparing the balance of the accounts from one period to another
period of accounting.
5STRATEGIC FINANCIAL ANALYSIS
Vertical analysis:
There are certain statements that reflects the association of different items on the
financial statement with common items by stating each item as the percentage of the common
item. Vertical analysis can be defined as the proportional analysis of the financial statements
where each line of items of the financial statements is recorded as the percentage of the other
item (Carmona 2014). Typically, this represents that the each line of the item in the income
statement is the percentage of gross sale while every line of item of on the balance sheet is
stated as the percentage of the total sales (Vogel 2014). Considering the horizontal analysis
performed for the companies it can be stated that Rexam reported a profit from the business
operations of 8.88% and 5.58% respectively for the financial year of 2011-2012 respectively.
A declining trend in the profit was noticed in the subsequent year of 2013 with Rexam
reporting a profit of 2.38%. On the other hand the profit reported by the Wolseley for the year
2013-14 stood 2.25% and 4.11% respectively. However in the following year of 2015 and
2016 the profit attributed to the shareholder stood 1.60% and 4.57% respectively.
While considering the other side of analysis Vertical analysis is entitled to the certain
limitations. According to Edmonds et al. (2013), criticizes the technique since it does not
addresses the significant changes in the degree of inflationary effect. Therefore, the results of
the inputs can be misleading because the information is largely reliant on the historical cost.
Additionally the analysis does not considers the qualitative aspects at the time of evaluating
the performance such as quality of the work, relation with stakeholders etc. Additionally, it is
restricted to liquidity aspects of the analysis and ignores the current ratio and debt ratio,
which holds the entitlement of computing the liquidity and solvency.
Traditional Ratio analysis:
Ratio analysis is considered as the most widely used and appreciated method of
comparing in respect of the financial and operating performance. In the words of Valickova,
⊘ This is a preview!⊘
Do you want full access?
Subscribe today to unlock all pages.
Trusted by 1+ million students worldwide
6STRATEGIC FINANCIAL ANALYSIS
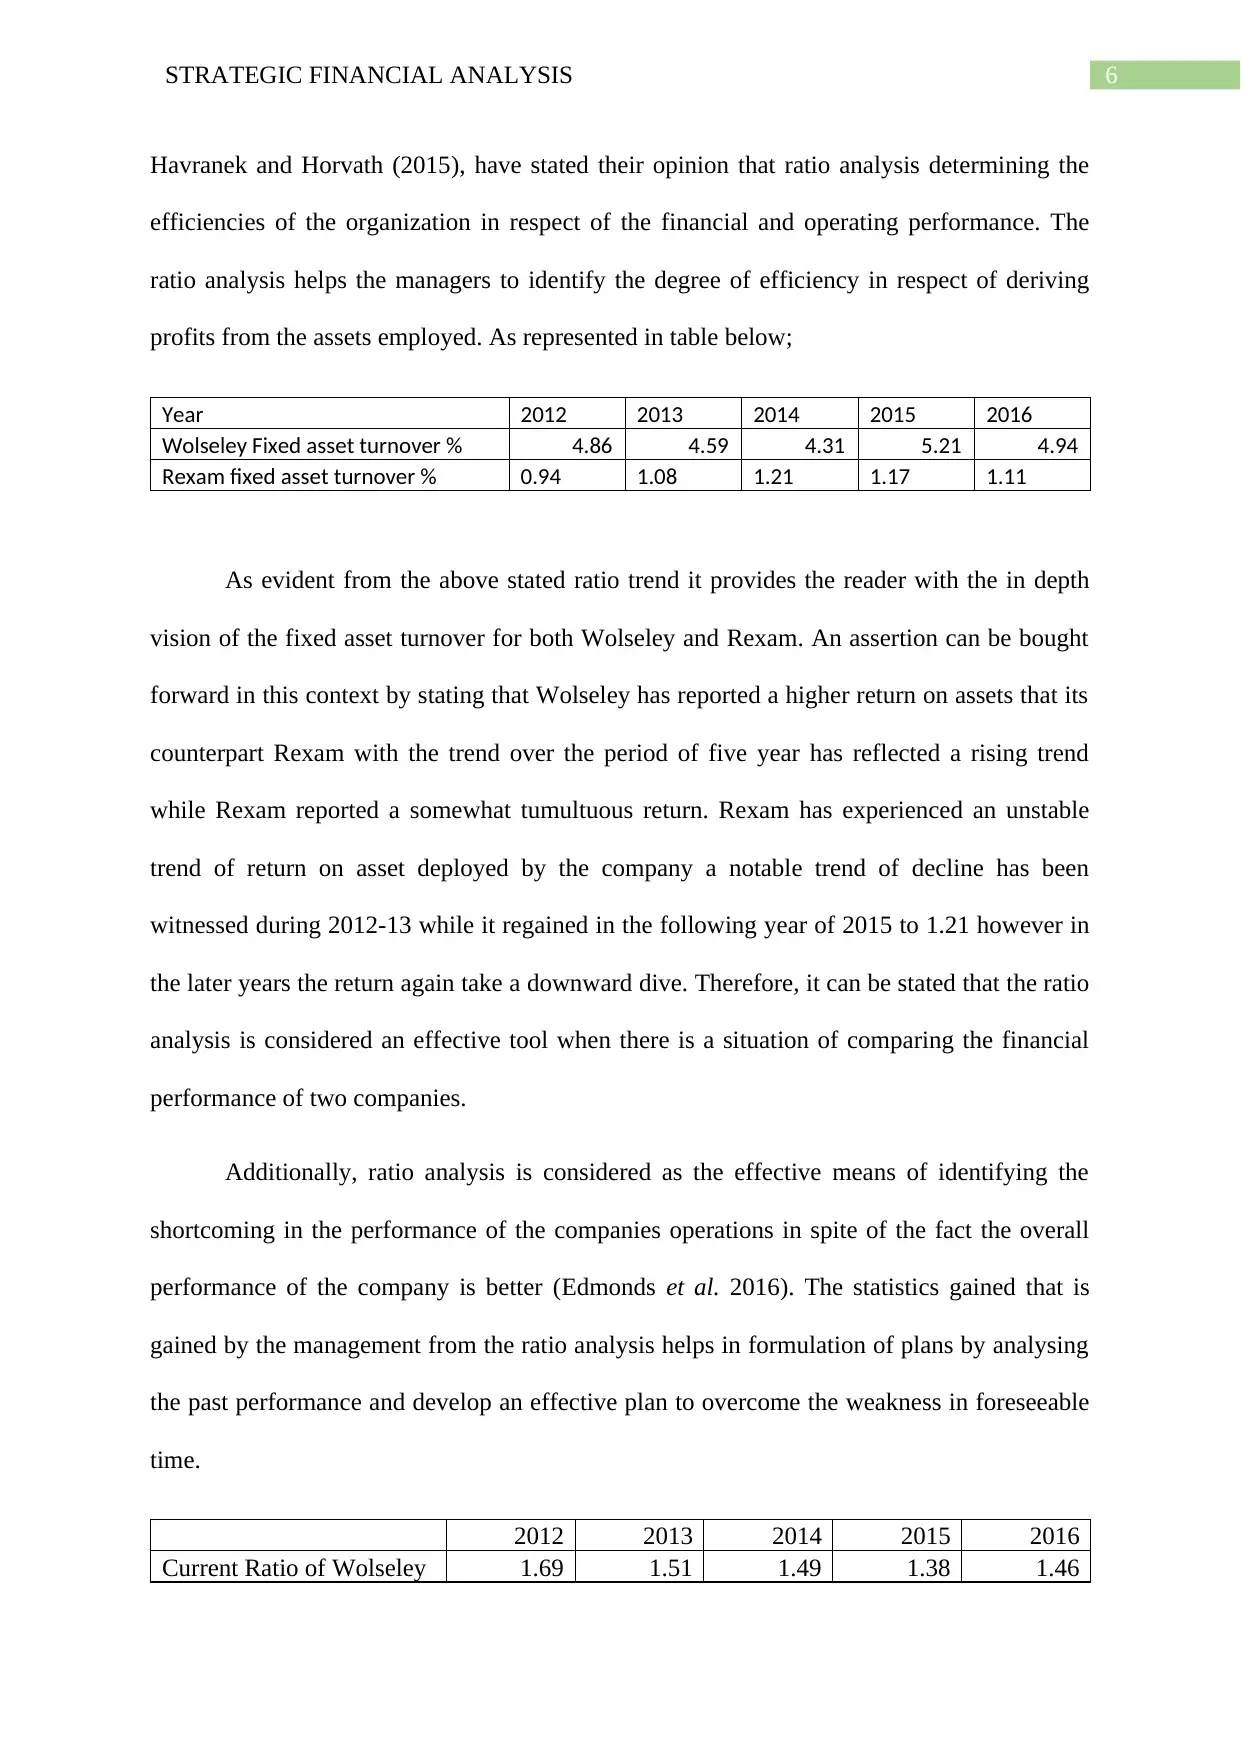
Havranek and Horvath (2015), have stated their opinion that ratio analysis determining the
efficiencies of the organization in respect of the financial and operating performance. The
ratio analysis helps the managers to identify the degree of efficiency in respect of deriving
profits from the assets employed. As represented in table below;
Year 2012 2013 2014 2015 2016
Wolseley Fixed asset turnover % 4.86 4.59 4.31 5.21 4.94
Rexam fixed asset turnover % 0.94 1.08 1.21 1.17 1.11
As evident from the above stated ratio trend it provides the reader with the in depth
vision of the fixed asset turnover for both Wolseley and Rexam. An assertion can be bought
forward in this context by stating that Wolseley has reported a higher return on assets that its
counterpart Rexam with the trend over the period of five year has reflected a rising trend
while Rexam reported a somewhat tumultuous return. Rexam has experienced an unstable
trend of return on asset deployed by the company a notable trend of decline has been
witnessed during 2012-13 while it regained in the following year of 2015 to 1.21 however in
the later years the return again take a downward dive. Therefore, it can be stated that the ratio
analysis is considered an effective tool when there is a situation of comparing the financial
performance of two companies.
Additionally, ratio analysis is considered as the effective means of identifying the
shortcoming in the performance of the companies operations in spite of the fact the overall
performance of the company is better (Edmonds et al. 2016). The statistics gained that is
gained by the management from the ratio analysis helps in formulation of plans by analysing
the past performance and develop an effective plan to overcome the weakness in foreseeable
time.
2012 2013 2014 2015 2016
Current Ratio of Wolseley 1.69 1.51 1.49 1.38 1.46
Havranek and Horvath (2015), have stated their opinion that ratio analysis determining the
efficiencies of the organization in respect of the financial and operating performance. The
ratio analysis helps the managers to identify the degree of efficiency in respect of deriving
profits from the assets employed. As represented in table below;
Year 2012 2013 2014 2015 2016
Wolseley Fixed asset turnover % 4.86 4.59 4.31 5.21 4.94
Rexam fixed asset turnover % 0.94 1.08 1.21 1.17 1.11
As evident from the above stated ratio trend it provides the reader with the in depth
vision of the fixed asset turnover for both Wolseley and Rexam. An assertion can be bought
forward in this context by stating that Wolseley has reported a higher return on assets that its
counterpart Rexam with the trend over the period of five year has reflected a rising trend
while Rexam reported a somewhat tumultuous return. Rexam has experienced an unstable
trend of return on asset deployed by the company a notable trend of decline has been
witnessed during 2012-13 while it regained in the following year of 2015 to 1.21 however in
the later years the return again take a downward dive. Therefore, it can be stated that the ratio
analysis is considered an effective tool when there is a situation of comparing the financial
performance of two companies.
Additionally, ratio analysis is considered as the effective means of identifying the
shortcoming in the performance of the companies operations in spite of the fact the overall
performance of the company is better (Edmonds et al. 2016). The statistics gained that is
gained by the management from the ratio analysis helps in formulation of plans by analysing
the past performance and develop an effective plan to overcome the weakness in foreseeable
time.
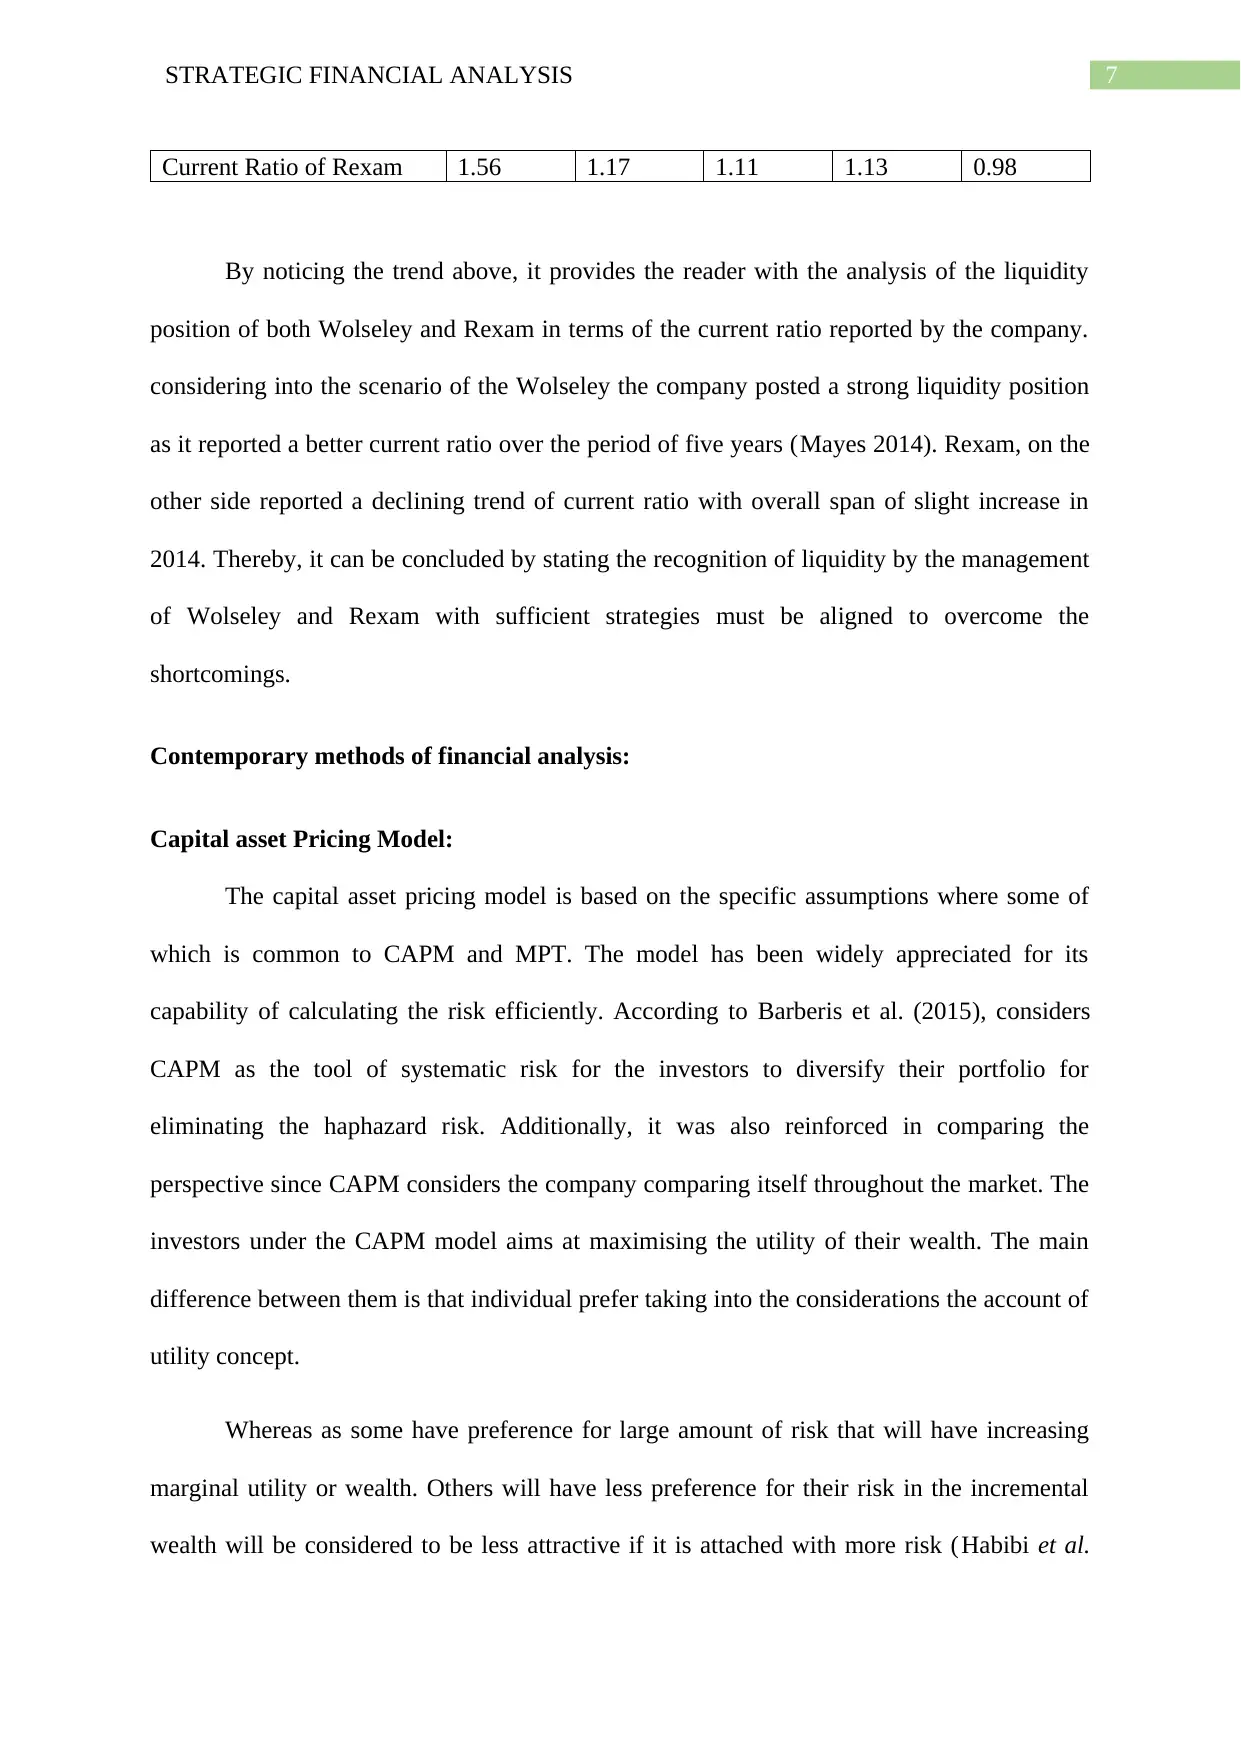
2012 2013 2014 2015 2016
Current Ratio of Wolseley 1.69 1.51 1.49 1.38 1.46
Paraphrase This Document
Need a fresh take? Get an instant paraphrase of this document with our AI Paraphraser
7STRATEGIC FINANCIAL ANALYSIS
Current Ratio of Rexam 1.56 1.17 1.11 1.13 0.98
By noticing the trend above, it provides the reader with the analysis of the liquidity
position of both Wolseley and Rexam in terms of the current ratio reported by the company.
considering into the scenario of the Wolseley the company posted a strong liquidity position
as it reported a better current ratio over the period of five years (Mayes 2014). Rexam, on the
other side reported a declining trend of current ratio with overall span of slight increase in
2014. Thereby, it can be concluded by stating the recognition of liquidity by the management
of Wolseley and Rexam with sufficient strategies must be aligned to overcome the
shortcomings.
Contemporary methods of financial analysis:
Capital asset Pricing Model:
The capital asset pricing model is based on the specific assumptions where some of
which is common to CAPM and MPT. The model has been widely appreciated for its
capability of calculating the risk efficiently. According to Barberis et al. (2015), considers
CAPM as the tool of systematic risk for the investors to diversify their portfolio for
eliminating the haphazard risk. Additionally, it was also reinforced in comparing the
perspective since CAPM considers the company comparing itself throughout the market. The
investors under the CAPM model aims at maximising the utility of their wealth. The main
difference between them is that individual prefer taking into the considerations the account of
utility concept.
Whereas as some have preference for large amount of risk that will have increasing
marginal utility or wealth. Others will have less preference for their risk in the incremental
wealth will be considered to be less attractive if it is attached with more risk (Habibi et al.
8STRATEGIC FINANCIAL ANALYSIS
2016). The technique of CAPM is considered as the better technique for the investors to use
the tool for investment appraisal because it provides appropriate link with the required rate of
return and systematic risk. The contemporary procedure of CAPM overcomes the
shortcomings of the other traditional methods by addressing risk by facilitating comparison of
the performance that is ignored by the traditional methods.
Investors have identical anticipations of Risk and return therefore without such
consensus standards the estimates related to mean variance might result in different forecast
with the result that the critical portfolio of each will be not be similar from that of the others
(Golez 2014). Given that the investors does not have identical anticipations there will be no
homogeneity in their conception and solitary efficient frontier would be applicable to all. The
assumptions of the CAPM represents that the market equilibrium and the anticipated rate of
return is equivalent to the required rate of return for the given degree of risk. CAPM offers a
liner association amid the required rate of return and it is associated to the market risk or Beta
that cannot be avoided.
The model of CAPM is not considered to be realistic since it assumes that all the
investors are averse to risk and with higher risk the return is higher. In spite of getting
widespread support, the model of CAPM suffers from certain limitations and shortcomings
(Bodie, Kane and Marcus 2014). At first CAPM is largely based on the assumptions that have
bought forward the questions based on the actuality of the model since the prevalence of the
perfect market is absence from the pricing of the model. In addition to this, borrowing from
the investors is not performed at the risk free rate and this represents that the actual security
market line will be steeper. Finally, in terms of the competition with the CAPM, investment
appraisal provides bigger perception on the investments returns whereas the model of CAPM
restricts the span to short and singular period.
⊘ This is a preview!⊘
Do you want full access?
Subscribe today to unlock all pages.
Trusted by 1+ million students worldwide
9STRATEGIC FINANCIAL ANALYSIS
Dividend Growth Model:
The Gordon’s dividend growth model is considered as one of the most popular model
in finance to make use value in order to evaluate the fundamental values of the stocks. The
dividend discount model assumes that the value is a direct function of the cash flow
anticipated in the future (Asimakopoulos et al. 2016). Under the circumstances of the
common stock, the relevant cash flows is the dividends that is paid along with the value of
the stock when it is sold. The price or the value of the share is that is derived from the future
stream of dividends is considered to be the intrinsic value of the stock. By assuming that the
dividends are paid out at the end of every year, the investors can estimate the fair price of the
stock to hold for the period of three years.
According to Belo et al. (2015), the advantage of dividend growth model lies in its
consistency since dividend generally stays for a longer period as compared to the other
components like earnings. Hamid et al. (2017), also supports the model for their wide range
of coverage that considers the minority shareholders. An important consideration in this
regard can be bought forward that dividend growth model is the efficient model in respect to
other traditional analysis since it enables the companies to compare companies of different
industries and market conditions that is primarily limitations to the ratio analysis.
The dividend growth model offers a wide mean of developing the explicit returns
together for the individual stocks and the aggregate market (Jordan 2014). The model
essentially contributes in the appraisal of the relative attractiveness of the individual stocks
together with the evaluation of the attractiveness of the stock market in the entire asset
allocation settings. In addition to this, the dividend growth model provides the usefulness in
understanding the factors of risk such as variation in interest rate with changing inflation rate
create an impact on the stocks.
Paraphrase This Document
Need a fresh take? Get an instant paraphrase of this document with our AI Paraphraser
10STRATEGIC FINANCIAL ANALYSIS
In spite of the success of the model, dividend growth model possesses certain
limitations as well. In the words of Lundholm and Sloan (2013), the mode is reliant heavily
on the inputs since a small change in the required rate of return or a continuous growth might
result in huge change in the terminal value along with the value of the stock. The model has
been additionally criticized for assuming that the growth rate is constant that makes the
dividend of the company appear liner whereas the empirical evidences represents that the
dividend growth is found to be seldom liner which ultimate makes the validity of the model
under query. The model does not assume non-dividend factors such as brand loyalty,
retention of customers and ownership of the intangible assets which increases the value of the
company. The model assumes that the stock price of the company is hypersensitive to the
dividend growth rate selected and the growth rate cannot go past the cost of equity and this
generally does not happen.
Effective market hypothesis:
The effective market hypothesis is regarded as the proposition where present prices of
stock clearly reflects the information that is available regarding the value of the organization
with no other means of earning excess amount of profit (Frahm 2014). The effective market
hypothesis is concerned with the most fundamental and exciting issues in finance by
addressing the reasons behind the change in the price and methods involved in changes in
price in security market. The effective market hypothesis holds important implications for the
investors along with the managers that the traditional method of analysis.
Several investors make an attempt to recognize the securities, which is undervalued,
and are anticipated to increase the value in upcoming time and especially those that would
increase more than others would (Weygandt, Kimmel and Kieso 2015). Several investors
along with investment managers considers that they can select securities, which would
11STRATEGIC FINANCIAL ANALYSIS
outperform in market. They make use of the several types of valuation and forecasting
techniques to assist them in their investment decision.
Most arguably, none of the economics theory or financial theory have produced more
passionate discussion surrounding its challenges and proponent. As stated by Narayan et al.
(2015), there is no proposition in the economics that possess more solid empirical evidence
supporting the efficient market hypothesis. An important consideration to denote that
effective market hypothesis suggest that profiting by predicting the price movements is
cumbersome and unlikely prospect. The main engine behind the price changes is the influx of
the new evidence. A market is considered to be efficient if the price adjust quickly and on
average without being bias to the new information (Jovanovic, Andreadakis and Schinckus
2016). Consequently, the present price of the securities reflects all the available information
during any given period. Because of this, there is hardly any reason to believe that the prices
are very high or low. The price of the securities adjust before an investor has the time to
adjust to the trade and profit the new section of information.
One of the prime reason for the prevalence of the effective market hypothesis is the
high degree of competition amid the investors to profit from the new information. The ability
of identifying the over and under priced stocks is considered to be very valuable as it enables
the investors to purchase some stocks in less than the true value and selling those stocks to
others at a higher value (Baltes, Dragoe and Ardelean 2015). In natural terms as more number
of investors compete against each other with the effort of taking advantage of over and
undervalued securities with the probability of being able to identify the exploit such miss-
priced securities becomes relatively small. An important considerations under the Effective
market hypothesis is that at any situation of time prices of the securities provides an all
known information that is available to the investors. There is hardly any means of deceiving
⊘ This is a preview!⊘
Do you want full access?
Subscribe today to unlock all pages.
Trusted by 1+ million students worldwide
1 out of 29
Related Documents


Your All-in-One AI-Powered Toolkit for Academic Success.
+13062052269
info@desklib.com
Available 24*7 on WhatsApp / Email
![[object Object]](/_next/static/media/star-bottom.7253800d.svg)
Unlock your academic potential
Copyright © 2020–2026 A2Z Services. All Rights Reserved. Developed and managed by ZUCOL.