Strategic Financial Analysis Report: Traditional Methods Analysis
VerifiedAdded on 2022/09/05
|20
|4417
|17
Report
AI Summary
This report provides a strategic financial analysis comparing the financial performance of Tate & Lyle PLC and Wolseley UK using traditional methods. The analysis includes ratio analysis, common size statement analysis (both vertical and horizontal), and DuPont analysis, examining profitability, liquidity, solvency, efficiency, and investor ratios over a period of several years. The report delves into the strengths and limitations of each method, with a focus on year-on-year trends. The report provides a detailed overview of the two companies' financial positions, highlighting key findings and suggesting the most effective methods or combinations of methods for comprehensive financial evaluation. The report is structured to critically review the methods involved in assessing a company’s operational efficiency, financial position, and performance, which is crucial for top-level management to devise creative business solutions and analyze performance. The report concludes with recommendations based on the comparative analysis and the limitations and strengths of each method.
STRATEGIC FINANCIAL ANALYSIS
Paraphrase This Document
Need a fresh take? Get an instant paraphrase of this document with our AI Paraphraser
Table of Contents
INTRODUCTION.................................................................................................................................4
Overview of Strategic Financial Analysis..........................................................................................4
Brief Background of Companies You Select (For Illustrative Purposes)...........................................4
Purpose of Report..............................................................................................................................5
STRATEGIC FINANCIAL ANALYSIS – TRADITTIONAL METHODS.........................................5
2.1 Ratio Analysis – 3 Year, Year on Year Trend Analysis...............................................................5
2.1.1 Profitability...............................................................................................................................5
2.1.2 Liquidity...................................................................................................................................7
2.2.3 Solvency...................................................................................................................................8
2.2.4 Efficiency.................................................................................................................................9
2.2.5 Investor.....................................................................................................................................9
2.2 Common Size Statement Analysis.................................................................................................10
2.2.1 Vertical Common Size Analysis.............................................................................................10
2.2.2 Horizontal Common Size Analysis.........................................................................................10
2.3 DuPont Analysis........................................................................................................................10
ANALYSIS AND EVALUATION OF LIMITATIONS AND STRENGTHS OF METHODS..........10
3.1 Ratio Analysis...........................................................................................................................10
3.1.1 Ratio Analysis – Limitations and Strengths............................................................................11
Advantages......................................................................................................................................11
Disadvantages..................................................................................................................................11
3.1.2 Contemporary Methods Proposed to Minimize Limitations of Ratio Analysis...........................11
3.2 Vertical Size Statement Analysis...............................................................................................11
Advantages......................................................................................................................................11
Disadvantages..................................................................................................................................12
3.2.1 Common Size Statement Analysis – Limitations and Strengths.............................................12
3.2.2 Contemporary Methods Proposed to Minimize Common Size Statement Analysis................12
Horizontal Common Size Analysis..................................................................................................12
Advantages......................................................................................................................................12
Disadvantages..................................................................................................................................13
3.3 DuPont Analysis........................................................................................................................13
3.3.1 Common Size Statement Analysis – Limitations and Strengths.............................................13
3.3.2 Contemporary Methods Proposed to Minimize Common Size Statement Analysis................13
Advantages......................................................................................................................................13
Disadvantages..................................................................................................................................14
CONCLUSIONS AND RECOMMENDATIONS...............................................................................14
4.1 Summary of Key Findings.........................................................................................................14
4.2 Suggest the Best Methods and/or Combination of Methods to be used.....................................14
APPENDICES.....................................................................................................................................15
REFERENCES....................................................................................................................................18
⊘ This is a preview!⊘
Do you want full access?
Subscribe today to unlock all pages.
Trusted by 1+ million students worldwide
INTRODUCTION
Overview of Strategic Financial Analysis
Strategic financial analysis is one of the most common analyses that has been undertaken to
give a detailed idea of how companies have performed over the period of few years and what
is their current position with respect to the competitors. The strategic financial analysis is a
powerful, value-creating framework that which helps the top level management to devise the
creative business solutions, analyse performance, and value a business. From the vantage
point of seniors, this framework is helpful in making management more aware towards the
operations of the company. This also helps in taking the business decision form the point of
view of the investors, and it lets them take an outside-in perspective of an acquirer trying to
value a target or an activist or private equity investor looking to drive value creation in a
company (Ratiosys.com. 2019).
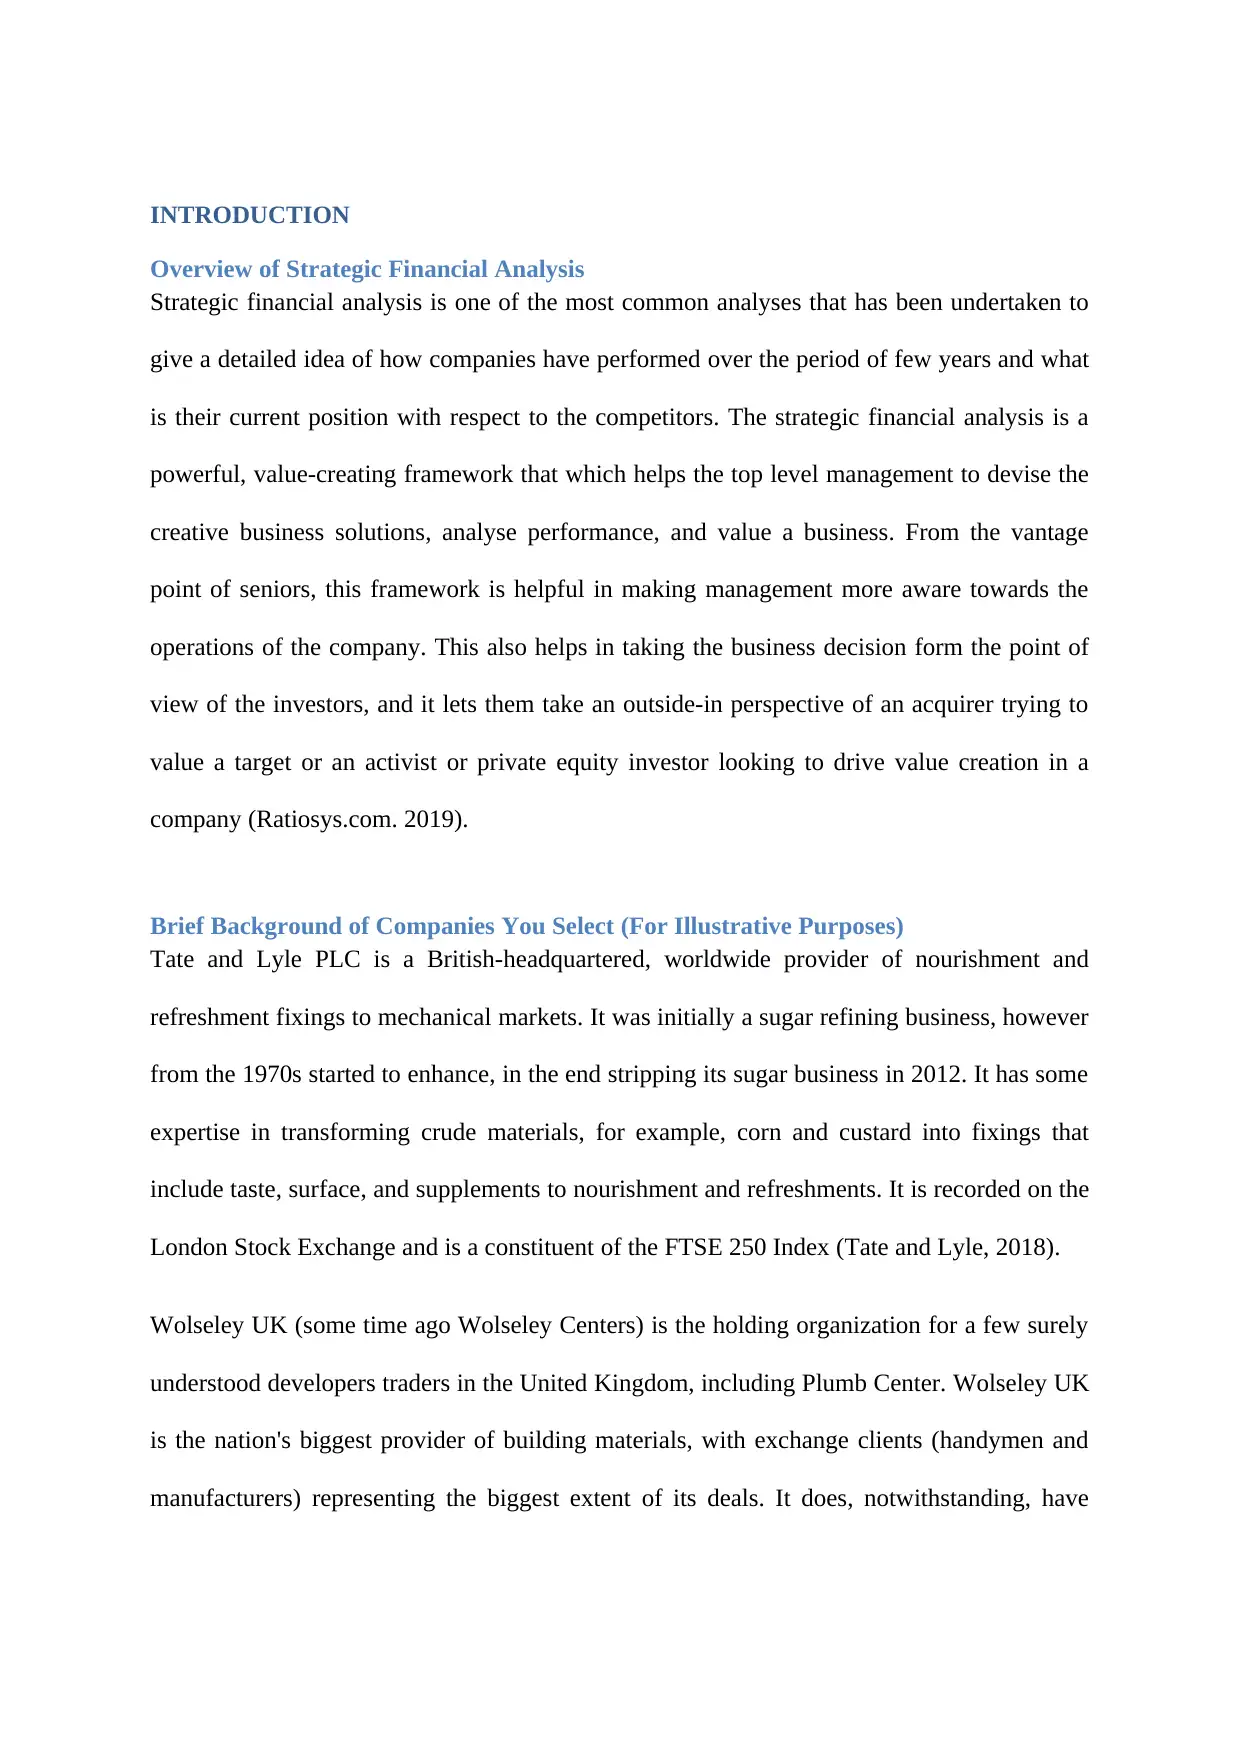
Brief Background of Companies You Select (For Illustrative Purposes)
Tate and Lyle PLC is a British-headquartered, worldwide provider of nourishment and
refreshment fixings to mechanical markets. It was initially a sugar refining business, however
from the 1970s started to enhance, in the end stripping its sugar business in 2012. It has some
expertise in transforming crude materials, for example, corn and custard into fixings that
include taste, surface, and supplements to nourishment and refreshments. It is recorded on the
London Stock Exchange and is a constituent of the FTSE 250 Index (Tate and Lyle, 2018).
Wolseley UK (some time ago Wolseley Centers) is the holding organization for a few surely
understood developers traders in the United Kingdom, including Plumb Center. Wolseley UK
is the nation's biggest provider of building materials, with exchange clients (handymen and
manufacturers) representing the biggest extent of its deals. It does, notwithstanding, have
Overview of Strategic Financial Analysis
Strategic financial analysis is one of the most common analyses that has been undertaken to
give a detailed idea of how companies have performed over the period of few years and what
is their current position with respect to the competitors. The strategic financial analysis is a
powerful, value-creating framework that which helps the top level management to devise the
creative business solutions, analyse performance, and value a business. From the vantage
point of seniors, this framework is helpful in making management more aware towards the
operations of the company. This also helps in taking the business decision form the point of
view of the investors, and it lets them take an outside-in perspective of an acquirer trying to
value a target or an activist or private equity investor looking to drive value creation in a
company (Ratiosys.com. 2019).
Brief Background of Companies You Select (For Illustrative Purposes)
Tate and Lyle PLC is a British-headquartered, worldwide provider of nourishment and
refreshment fixings to mechanical markets. It was initially a sugar refining business, however
from the 1970s started to enhance, in the end stripping its sugar business in 2012. It has some
expertise in transforming crude materials, for example, corn and custard into fixings that
include taste, surface, and supplements to nourishment and refreshments. It is recorded on the
London Stock Exchange and is a constituent of the FTSE 250 Index (Tate and Lyle, 2018).
Wolseley UK (some time ago Wolseley Centers) is the holding organization for a few surely
understood developers traders in the United Kingdom, including Plumb Center. Wolseley UK
is the nation's biggest provider of building materials, with exchange clients (handymen and
manufacturers) representing the biggest extent of its deals. It does, notwithstanding, have
Paraphrase This Document
Need a fresh take? Get an instant paraphrase of this document with our AI Paraphraser
retail showrooms around the United Kingdom which are available to the overall population
(Wolseley, 2018).
Purpose of Report
In this report a detailed understanding of Tate and Lye and Wolseley has been discussed in
detail on the basis of the ratio analysis of the company. The common and the vertical analysis
have also been undertaken in detail to understand the movements of each item of income
statement and balance sheet. Dupont Analysis has also been undertaken to get the real
understanding of the profits and the revenue (Riyadi, 2017).
STRATEGIC FINANCIAL ANALYSIS – TRADITTIONAL METHODS
2.1 Ratio Analysis – 3 Year, Year on Year Trend Analysis
2.1.1 Profitability
Profitability ratios are the ratios that help in understanding the profitability of the business
over the past 5 years along with the competitors. In this current section, the detailed analysis
of the ratios of Tate and Lye and Wolseley have been undertaken to understand the
competitive difference between the companies (Chatfield, 2016).
Profitability has been measured over lots of parameters in case of Tate and Lye over the
period of 5 years. In analysis of Tate the gross profit margin has increased from 30.21% to
37.54% whereas that of Wolseley has been low in comparison to Tate. The gross margins
define the raw profits that are incurred before any expenses. In the financial year 2012, the
gross margin of Wolseley was 27.55% and Tate was operating at 30.21%. Further, the
operating margin of Tate has been reduced from 13.08% to 9.11% in the year 2014 and
thereafter till 5.39% (ElFayoumi, 2018).
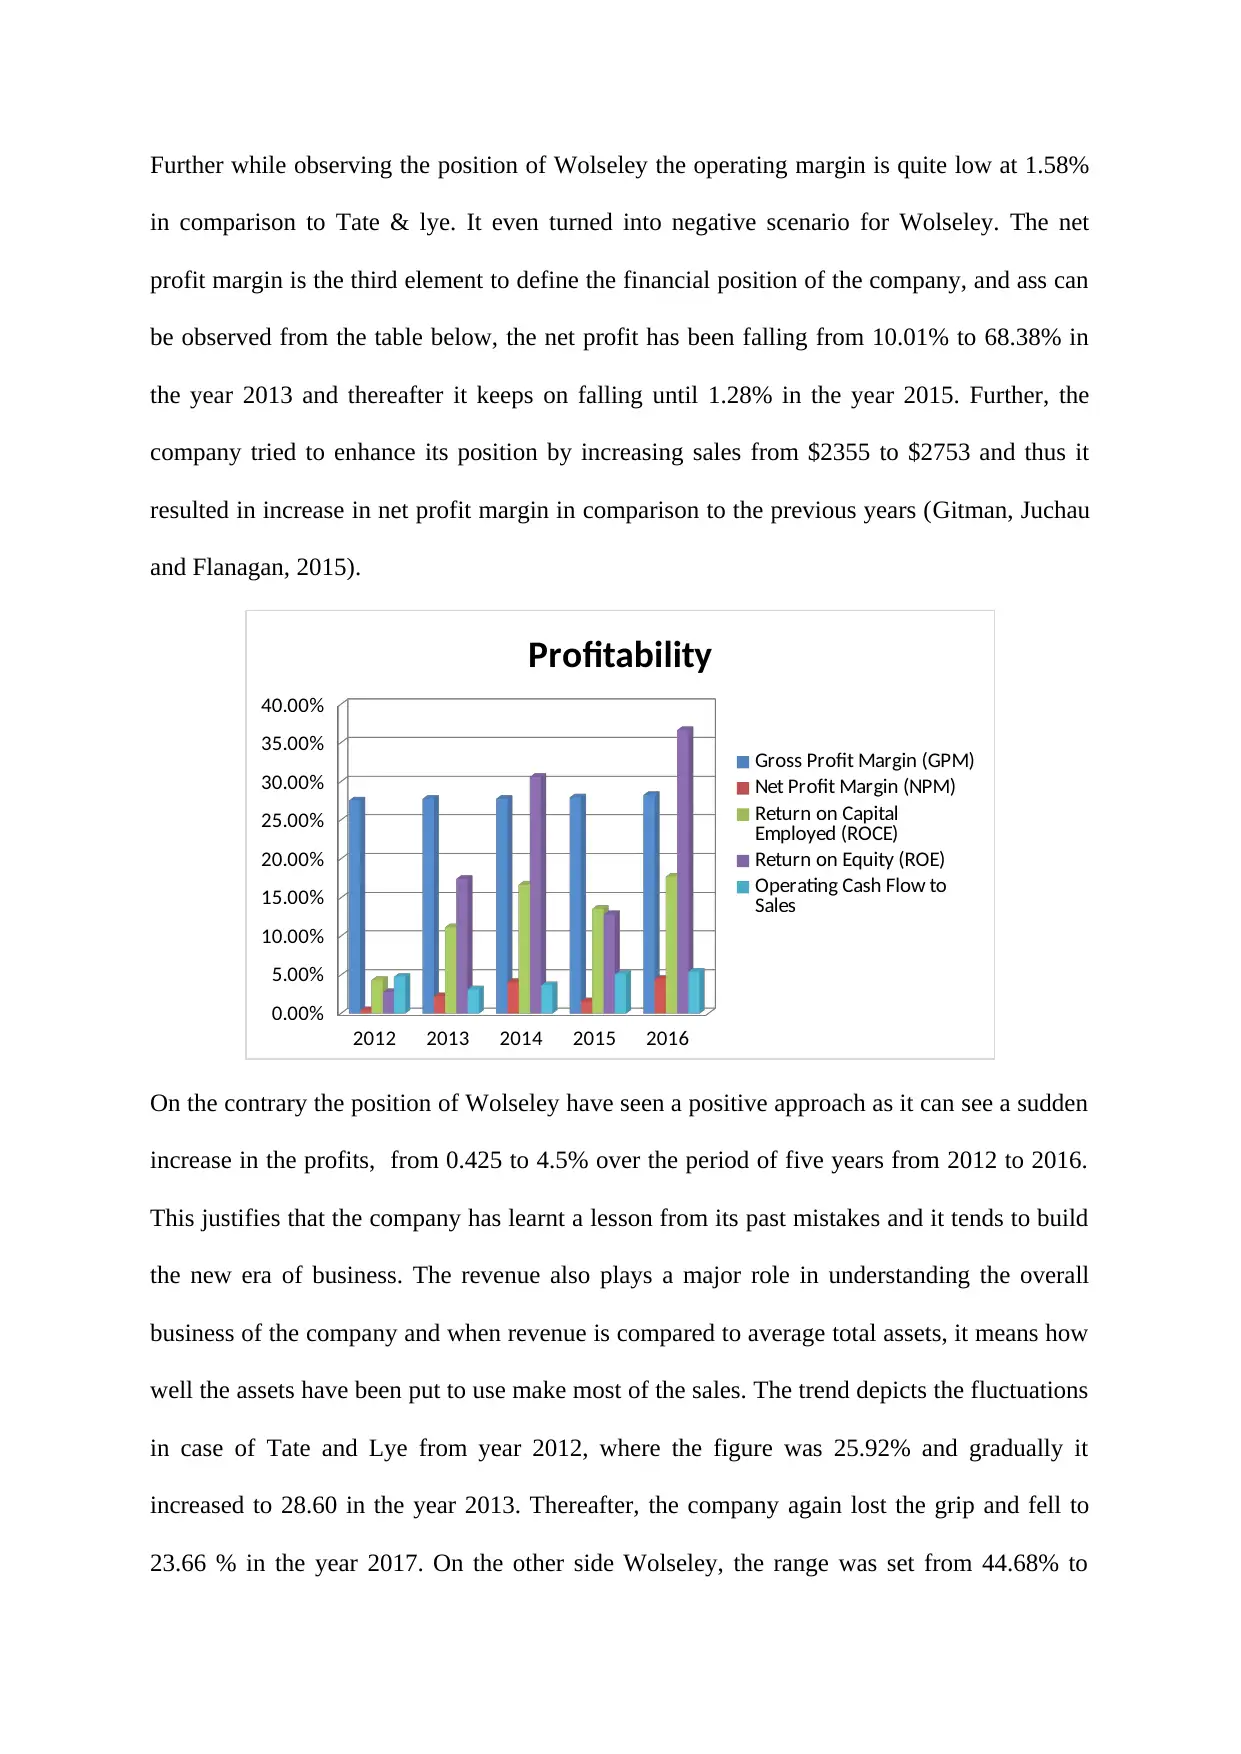
Further while observing the position of Wolseley the operating margin is quite low at 1.58%
in comparison to Tate & lye. It even turned into negative scenario for Wolseley. The net
profit margin is the third element to define the financial position of the company, and ass can
be observed from the table below, the net profit has been falling from 10.01% to 68.38% in
the year 2013 and thereafter it keeps on falling until 1.28% in the year 2015. Further, the
company tried to enhance its position by increasing sales from $2355 to $2753 and thus it
resulted in increase in net profit margin in comparison to the previous years (Gitman, Juchau
and Flanagan, 2015).
2012 2013 2014 2015 2016
0.00%
5.00%
10.00%
15.00%
20.00%
25.00%
30.00%
35.00%
40.00%
Profitability
Gross Profit Margin (GPM)
Net Profit Margin (NPM)
Return on Capital
Employed (ROCE)
Return on Equity (ROE)
Operating Cash Flow to
Sales
On the contrary the position of Wolseley have seen a positive approach as it can see a sudden
increase in the profits, from 0.425 to 4.5% over the period of five years from 2012 to 2016.
This justifies that the company has learnt a lesson from its past mistakes and it tends to build
the new era of business. The revenue also plays a major role in understanding the overall
business of the company and when revenue is compared to average total assets, it means how
well the assets have been put to use make most of the sales. The trend depicts the fluctuations
in case of Tate and Lye from year 2012, where the figure was 25.92% and gradually it
increased to 28.60 in the year 2013. Thereafter, the company again lost the grip and fell to
23.66 % in the year 2017. On the other side Wolseley, the range was set from 44.68% to
⊘ This is a preview!⊘
Do you want full access?
Subscribe today to unlock all pages.
Trusted by 1+ million students worldwide
46.84% in all the years. This implies Wolseley in this area tends to have a better impact and
usage of assets in comparison to Tate and Lye (Grant, 2016).
While looking at the cash flows of the company the operating cash flow with respect to profit
increases over the period of time from 75% to 105% 2013 and from there it jumped to 115%.
Wolseley saw a decline in their operating cash flow ratio from 1126% and it saw a sharp
decline till 121% in the year 2017. This is a typical case of low supervision in the operating
area of the company (Liang, Lu, Tsai and Shih, 2016).
From the overall analysis the picture states that Tate and Lye is performing better in case of
profitability of the company and Wolseley needs to take the strategic decisions to improve the
existing situations (Uechi., et al 2015).
2.1.2 Liquidity
Liquidity ratios are the ratio that helps in determining the overall capacity of the company in
paying the liabilities of current nature as fast as possible with the help of the current assets.
The liquidity ratios are judged on the basis of the current ratio, quick ratio and cash ratio. The
current ratio of Tate is almost more than Wolseley in all the individual years respectively.
This indicates Tate is better in realizing the cash and making the payment immediately
whereas Wolseley, is making the payments at the late pace. The current ratio earlier was
sound in case of Tate at 1.91 times and it reduced to 1.32 in the year 2015 and it again
fluctuated in the year and reached to 1.63. On the other hand, the current ratio of Wolseley
discloses that the ratio tends to fall till 2015 and thereafter it saw a hike but is still not close to
benchmark. Earlier in the year 2012, the current ratio was 1.69 and thereafter it reached to
1.51 in the next year following a trend and reached to 1.38, but saw an increased in the year
2016 (Ardalan, 2017).
Liquidity ratios 2012 2013 2014 2015 2016
(Current Assets / Current Liabilities) 1.91 2.31 1.50 1.32 1.63
Paraphrase This Document
Need a fresh take? Get an instant paraphrase of this document with our AI Paraphraser
(Current Assets - Inventories)/ Current
Liabilities 1.24 1.44 0.98 0.81 1.03
Cash and Cash equivalent / Current Liabilities 0.63 0.64 0.49 0.28 0.49
Wolsele
y
Liquidity ratios 2012 2013 2014 2015 2016
(Current Assets / Current Liabilities) 1.69 1.51 1.49 1.38 1.46
(Current Assets - Inventories)/ Current
Liabilities 1.06 0.88 0.86 0.88 0.89
Cash and Cash equivalent / Current Liabilities 0.32 0.12 0.09 0.32 0.27
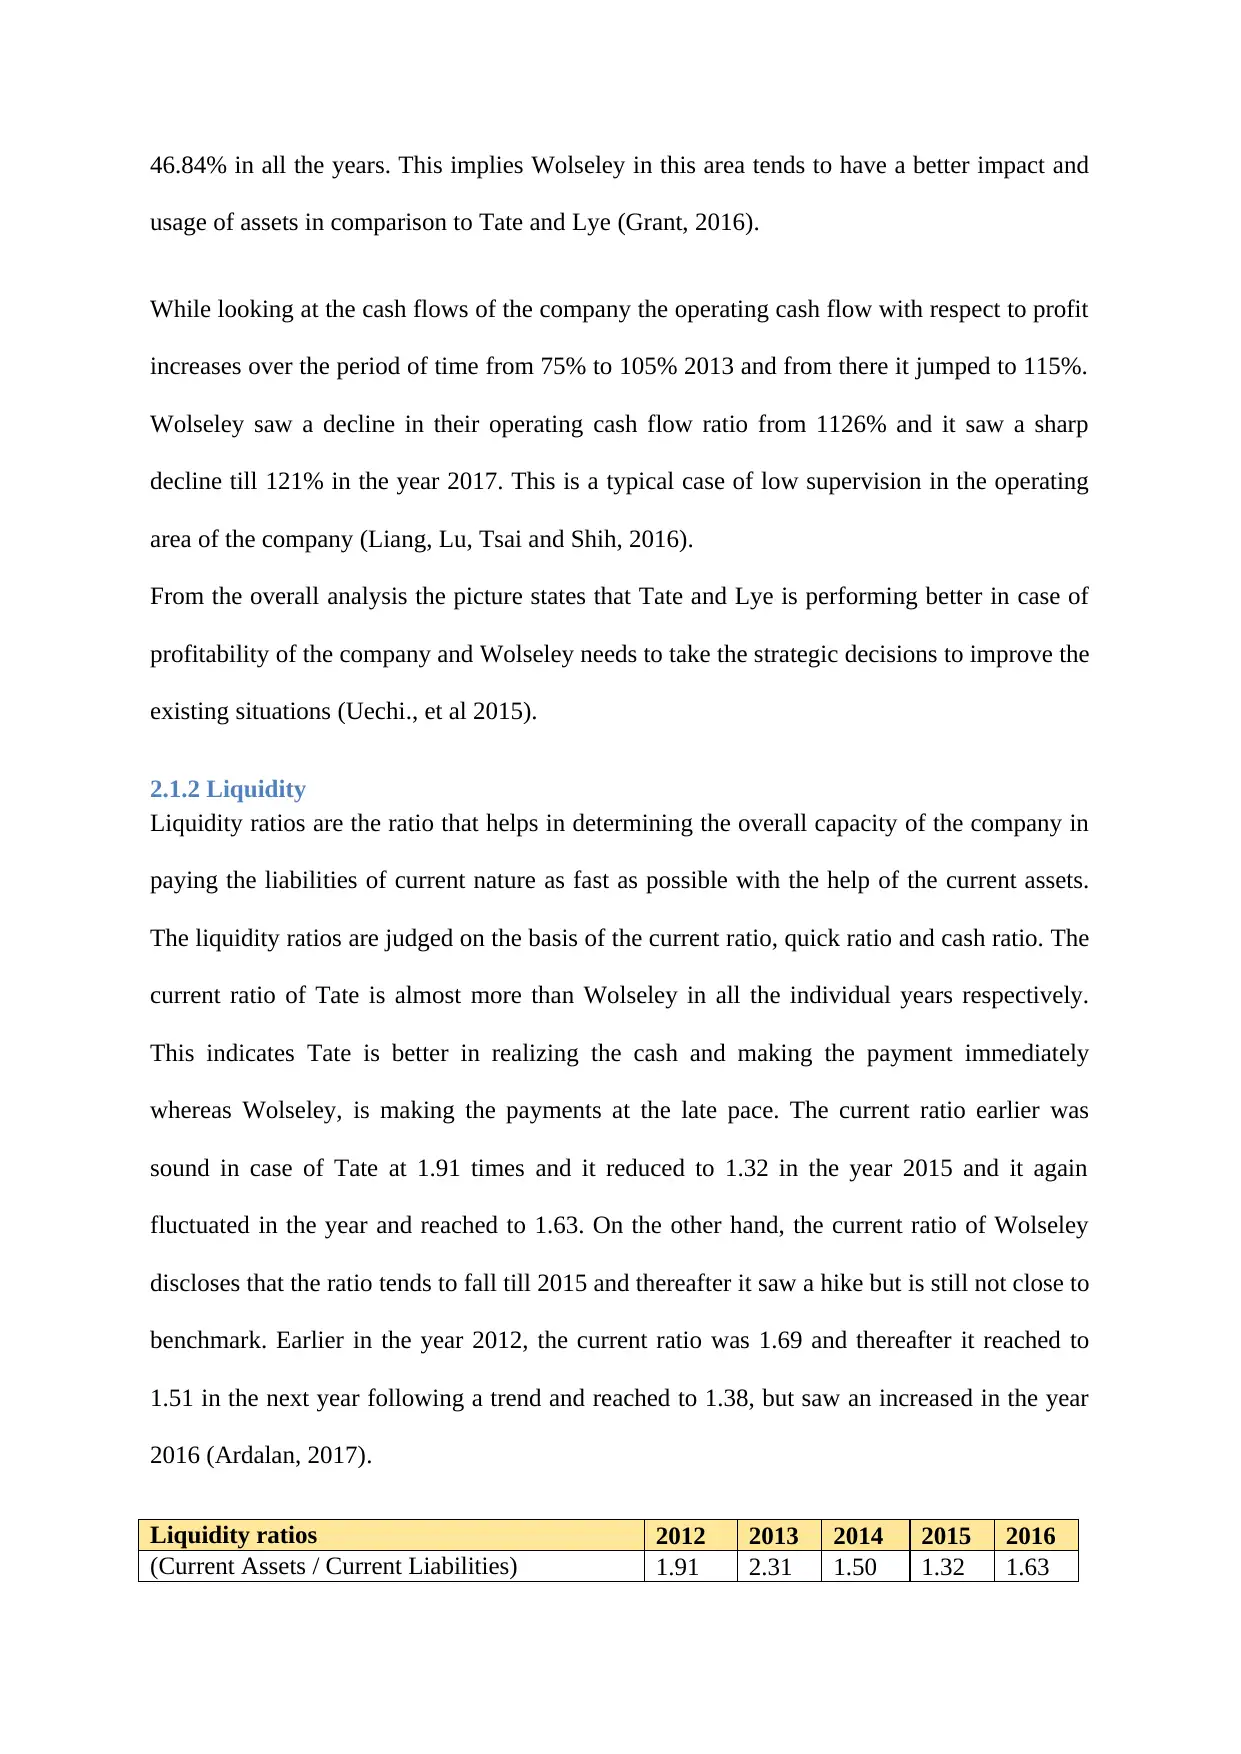
2.2.3 Solvency
It has been seen that solvency ratio of Tate and Lyle has been decreases in the last five years
which depicts that the company issue the shares instead of borrowing money from third party
on loan. The debt to equity ratio in five years is 1.09, 1.12, 0.68, 0.84 and 0.85 in the
year 2012, 2013, 2014, 2015 and 2016 respectively. The amount of debt has been decreases
in five years as compare to increasing the amount of total equity. It is beneficial for the
company that it finances the operating activities through issuing shares instead of borrowing
money (Chatfield, 2016).
1 2 3 4 5
0.00
0.20
0.40
0.60
0.80
1.00
1.20
Solvency Ratios
Debt-to-Equity Ratio (D/E)
Debt-to-Assets Ratio
Gearing
The total debt to equity ratio of Wolseley has been increases in the last five years which
depicts that the company financing the operation activities by borrowing loan instead of
issuing shares of the company. The debt to equity ratio of the company has been increases in
Liabilities 1.24 1.44 0.98 0.81 1.03
Cash and Cash equivalent / Current Liabilities 0.63 0.64 0.49 0.28 0.49
Wolsele
y
Liquidity ratios 2012 2013 2014 2015 2016
(Current Assets / Current Liabilities) 1.69 1.51 1.49 1.38 1.46
(Current Assets - Inventories)/ Current
Liabilities 1.06 0.88 0.86 0.88 0.89
Cash and Cash equivalent / Current Liabilities 0.32 0.12 0.09 0.32 0.27
2.2.3 Solvency
It has been seen that solvency ratio of Tate and Lyle has been decreases in the last five years
which depicts that the company issue the shares instead of borrowing money from third party
on loan. The debt to equity ratio in five years is 1.09, 1.12, 0.68, 0.84 and 0.85 in the
year 2012, 2013, 2014, 2015 and 2016 respectively. The amount of debt has been decreases
in five years as compare to increasing the amount of total equity. It is beneficial for the
company that it finances the operating activities through issuing shares instead of borrowing
money (Chatfield, 2016).
1 2 3 4 5
0.00
0.20
0.40
0.60
0.80
1.00
1.20
Solvency Ratios
Debt-to-Equity Ratio (D/E)
Debt-to-Assets Ratio
Gearing
The total debt to equity ratio of Wolseley has been increases in the last five years which
depicts that the company financing the operation activities by borrowing loan instead of
issuing shares of the company. The debt to equity ratio of the company has been increases in
the five years such as 1.28, 1.31, 1.34, 1.88 and 1.81in the years 2012, 2013, 2014, 2015 and
2016 respectively. Tate and Lyle cover the interest amount in 50 days but Wolseley takes
19.18 days to recover the amount of interest in the year 2017. It depicts that Tate and Lyle is
less aware to cover the amount of interest from the market. The whole analysis of solvency
ratio is that Tate and Lyle is good in terms of borrowing money but Wolseley is best in
covering the interest amount in less time (Easton and Sommers, 2018).
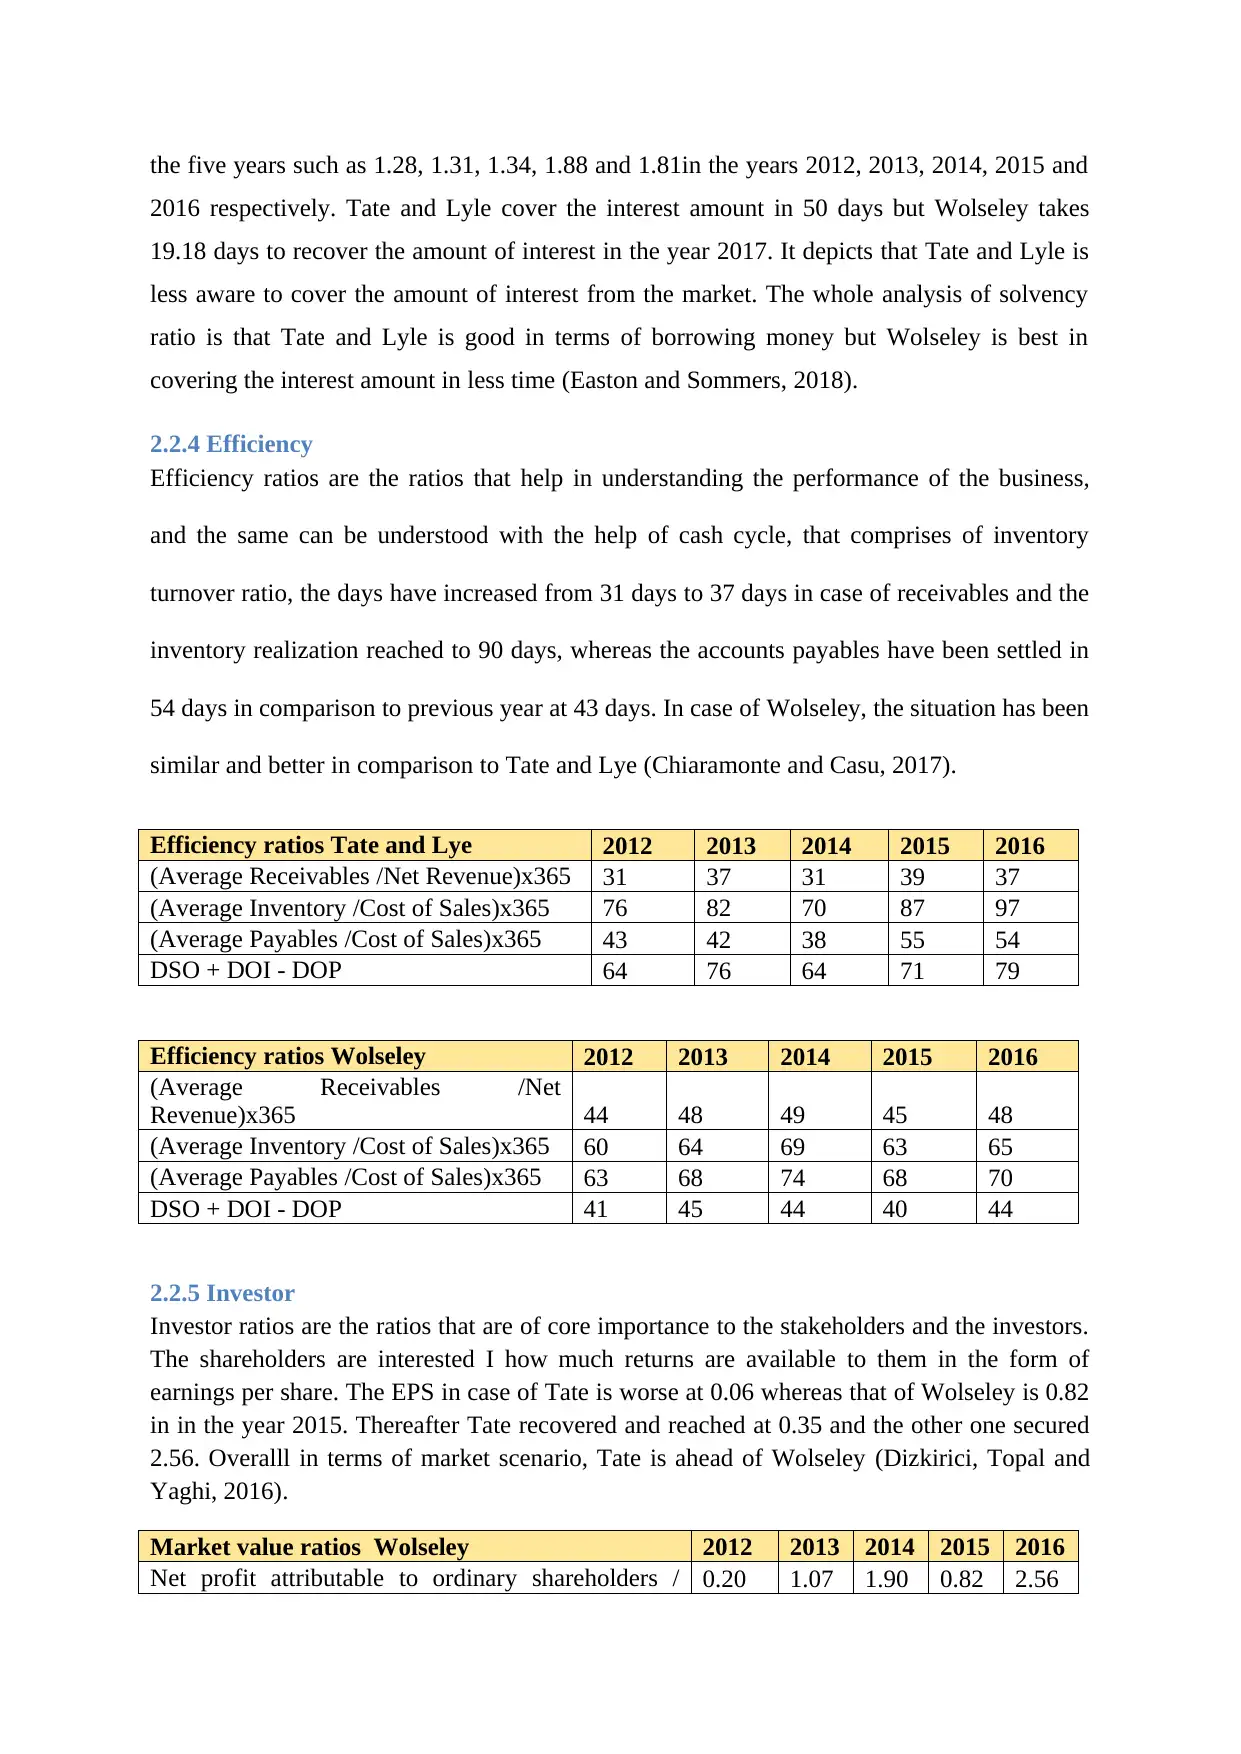
2.2.4 Efficiency
Efficiency ratios are the ratios that help in understanding the performance of the business,
and the same can be understood with the help of cash cycle, that comprises of inventory
turnover ratio, the days have increased from 31 days to 37 days in case of receivables and the
inventory realization reached to 90 days, whereas the accounts payables have been settled in
54 days in comparison to previous year at 43 days. In case of Wolseley, the situation has been
similar and better in comparison to Tate and Lye (Chiaramonte and Casu, 2017).
Efficiency ratios Tate and Lye 2012 2013 2014 2015 2016
(Average Receivables /Net Revenue)x365 31 37 31 39 37
(Average Inventory /Cost of Sales)x365 76 82 70 87 97
(Average Payables /Cost of Sales)x365 43 42 38 55 54
DSO + DOI - DOP 64 76 64 71 79
Efficiency ratios Wolseley 2012 2013 2014 2015 2016
(Average Receivables /Net
Revenue)x365 44 48 49 45 48
(Average Inventory /Cost of Sales)x365 60 64 69 63 65
(Average Payables /Cost of Sales)x365 63 68 74 68 70
DSO + DOI - DOP 41 45 44 40 44
2.2.5 Investor
Investor ratios are the ratios that are of core importance to the stakeholders and the investors.
The shareholders are interested I how much returns are available to them in the form of
earnings per share. The EPS in case of Tate is worse at 0.06 whereas that of Wolseley is 0.82
in in the year 2015. Thereafter Tate recovered and reached at 0.35 and the other one secured
2.56. Overalll in terms of market scenario, Tate is ahead of Wolseley (Dizkirici, Topal and
Yaghi, 2016).
Market value ratios Wolseley 2012 2013 2014 2015 2016
Net profit attributable to ordinary shareholders / 0.20 1.07 1.90 0.82 2.56
2016 respectively. Tate and Lyle cover the interest amount in 50 days but Wolseley takes
19.18 days to recover the amount of interest in the year 2017. It depicts that Tate and Lyle is
less aware to cover the amount of interest from the market. The whole analysis of solvency
ratio is that Tate and Lyle is good in terms of borrowing money but Wolseley is best in
covering the interest amount in less time (Easton and Sommers, 2018).
2.2.4 Efficiency
Efficiency ratios are the ratios that help in understanding the performance of the business,
and the same can be understood with the help of cash cycle, that comprises of inventory
turnover ratio, the days have increased from 31 days to 37 days in case of receivables and the
inventory realization reached to 90 days, whereas the accounts payables have been settled in
54 days in comparison to previous year at 43 days. In case of Wolseley, the situation has been
similar and better in comparison to Tate and Lye (Chiaramonte and Casu, 2017).
Efficiency ratios Tate and Lye 2012 2013 2014 2015 2016
(Average Receivables /Net Revenue)x365 31 37 31 39 37
(Average Inventory /Cost of Sales)x365 76 82 70 87 97
(Average Payables /Cost of Sales)x365 43 42 38 55 54
DSO + DOI - DOP 64 76 64 71 79
Efficiency ratios Wolseley 2012 2013 2014 2015 2016
(Average Receivables /Net
Revenue)x365 44 48 49 45 48
(Average Inventory /Cost of Sales)x365 60 64 69 63 65
(Average Payables /Cost of Sales)x365 63 68 74 68 70
DSO + DOI - DOP 41 45 44 40 44
2.2.5 Investor
Investor ratios are the ratios that are of core importance to the stakeholders and the investors.
The shareholders are interested I how much returns are available to them in the form of
earnings per share. The EPS in case of Tate is worse at 0.06 whereas that of Wolseley is 0.82
in in the year 2015. Thereafter Tate recovered and reached at 0.35 and the other one secured
2.56. Overalll in terms of market scenario, Tate is ahead of Wolseley (Dizkirici, Topal and
Yaghi, 2016).
Market value ratios Wolseley 2012 2013 2014 2015 2016
Net profit attributable to ordinary shareholders / 0.20 1.07 1.90 0.82 2.56
⊘ This is a preview!⊘
Do you want full access?
Subscribe today to unlock all pages.
Trusted by 1+ million students worldwide
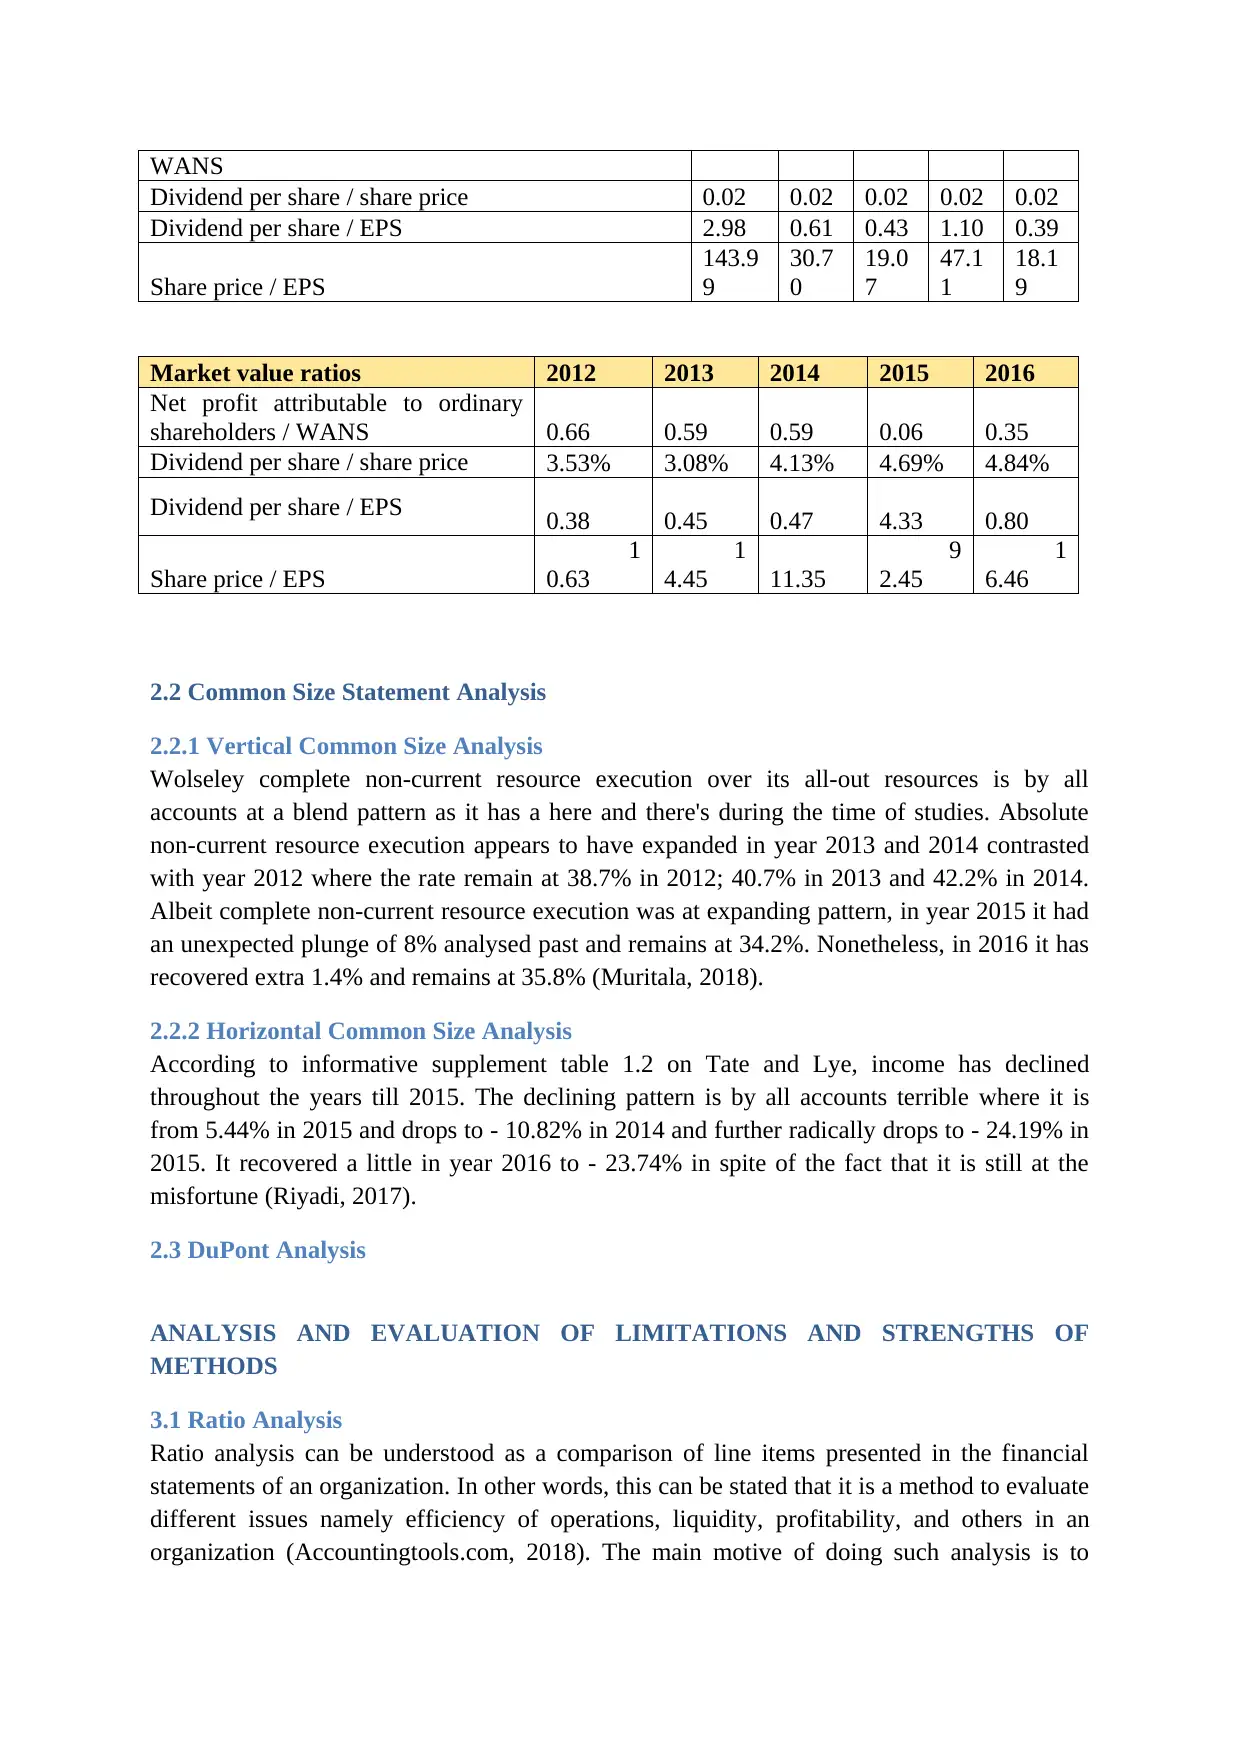
WANS
Dividend per share / share price 0.02 0.02 0.02 0.02 0.02
Dividend per share / EPS 2.98 0.61 0.43 1.10 0.39
Share price / EPS
143.9
9
30.7
0
19.0
7
47.1
1
18.1
9
Market value ratios 2012 2013 2014 2015 2016
Net profit attributable to ordinary
shareholders / WANS 0.66 0.59 0.59 0.06 0.35
Dividend per share / share price 3.53% 3.08% 4.13% 4.69% 4.84%
Dividend per share / EPS 0.38 0.45 0.47 4.33 0.80
Share price / EPS
1
0.63
1
4.45 11.35
9
2.45
1
6.46
2.2 Common Size Statement Analysis
2.2.1 Vertical Common Size Analysis
Wolseley complete non-current resource execution over its all-out resources is by all
accounts at a blend pattern as it has a here and there's during the time of studies. Absolute
non-current resource execution appears to have expanded in year 2013 and 2014 contrasted
with year 2012 where the rate remain at 38.7% in 2012; 40.7% in 2013 and 42.2% in 2014.
Albeit complete non-current resource execution was at expanding pattern, in year 2015 it had
an unexpected plunge of 8% analysed past and remains at 34.2%. Nonetheless, in 2016 it has
recovered extra 1.4% and remains at 35.8% (Muritala, 2018).
2.2.2 Horizontal Common Size Analysis
According to informative supplement table 1.2 on Tate and Lye, income has declined
throughout the years till 2015. The declining pattern is by all accounts terrible where it is
from 5.44% in 2015 and drops to - 10.82% in 2014 and further radically drops to - 24.19% in
2015. It recovered a little in year 2016 to - 23.74% in spite of the fact that it is still at the
misfortune (Riyadi, 2017).
2.3 DuPont Analysis
ANALYSIS AND EVALUATION OF LIMITATIONS AND STRENGTHS OF
METHODS
3.1 Ratio Analysis
Ratio analysis can be understood as a comparison of line items presented in the financial
statements of an organization. In other words, this can be stated that it is a method to evaluate
different issues namely efficiency of operations, liquidity, profitability, and others in an
organization (Accountingtools.com, 2018). The main motive of doing such analysis is to
Paraphrase This Document
Need a fresh take? Get an instant paraphrase of this document with our AI Paraphraser
understand and review the trend line as well as industry comparison. There are many
advantages and disadvantages of the subjective analysis that are mentioned as follows.
3.1.1 Ratio Analysis – Limitations and Strengths
Advantages
The very first advantage and purpose of such analysis is a simplification of the study
of complicated financial statements
As mentioned above, it converts significant data in a plain form hence it saves the
time of investors and other users of financial information where they can make their
decision in less time by looking after only a few figures.
Disadvantages
Ratio analysis is mostly related to the past data where stakeholders of any business
remain more concerned about current as well as future data.
Many of the ratios are calculated based on historical cost and ignore the factor of
changes in price level cause of inflation. It does not provide a true picture of financial
position and stakeholders are likely to take wrong decisions based on rations
(Ratiosys.com, 2019).
3.1.2 Contemporary Methods Proposed to Minimize Limitations of Ratio Analysis
3.2 Vertical Size Statement Analysis
As the name implies, it is a type of common size analysis where each item of financial
statements is used to calculate as a percentage of a base figure which also exists in the
subjective financial statement (accountingformanagement.org, 2019). After understanding the
basic meaning and working style of vertical common-size analysis, the pros and cons of the
same are also seemed necessary to study here. These are mentioned as below:-
Advantages
It is easy to compute and understood as different items need to calculate a percentage
of the based elements.
It helps stakeholders to understand how each factor matters to the overall financial
performance of their business and which factor needs to be increased and decreased to
reach up to idol situation.
It helps to identify different areas where the company has used its funds.
Disadvantages
There is no standard percentage for each item and therefore this analysis does not
seem helpful in decision making.
It cannot measure liquidity (efinancemanagement.com, 2019)
It does not provide a quality analysis due to a lack of consistency in the ratio of the
elements
3.2.1 Common Size Statement Analysis – Limitations and Strengths
3.2.2 Contemporary Methods Proposed to Minimize Common Size Statement Analysis
Horizontal Common Size Analysis
It is an important and helpful method to study trend situations. To discuss the meaning of the
same this is to state that horizontal common-size analysis is a method, which reflects changes
in the particular financial item over a period of time. In this way, to practice this analysis
there should be financial statements available for two or more periods. The analysis can be
pursued using the balance sheet, statement of retained earnings and income statements.
Advantages
It allows users of financial information to check the performance of a company over a
period and to judge success and failure of the same.
It helps analysis to predict future values of a particular item if the trend is the same.
⊘ This is a preview!⊘
Do you want full access?
Subscribe today to unlock all pages.
Trusted by 1+ million students worldwide
1 out of 20
Related Documents


Your All-in-One AI-Powered Toolkit for Academic Success.
+13062052269
info@desklib.com
Available 24*7 on WhatsApp / Email
![[object Object]](/_next/static/media/star-bottom.7253800d.svg)
Unlock your academic potential
Copyright © 2020–2026 A2Z Services. All Rights Reserved. Developed and managed by ZUCOL.