Strategic Financial Analysis: Booker Group PLC vs. Tate & Lyle PLC
VerifiedAdded on 2020/12/30
|57
|13738
|400
Report
AI Summary
This report provides a strategic financial analysis comparing the financial performance of Booker Group PLC and Tate & Lyle PLC over a five-year period. The analysis employs various financial tools, including ratio analysis (profitability, liquidity, efficiency, and leverage ratios), common size analysis (vertical and horizontal), and DuPont analysis. The report examines the merits and demerits of each analytical method and discusses contemporary methods like the Capital Asset Pricing Model (CAPM), Economic Value Added (EVA), and the Efficient Market Hypothesis (EMH) to overcome limitations. The study includes detailed financial statements, vertical and horizontal analyses, benchmarking ratios, and DuPont analyses for both companies, offering a comprehensive evaluation of their financial positions, industry outlook, and overall firm situations. The conclusion summarizes the key findings and insights derived from the analyses.

Strategic Financial Analysis
Paraphrase This Document
Need a fresh take? Get an instant paraphrase of this document with our AI Paraphraser
TABLE OF CONTENTS
1. INTRODUCTION.......................................................................................................................4
1.1 Strategic financial analysis and its importance ...............................................................4
1.2 Report objectives..............................................................................................................4
1.3 Introducing 2 selected organization .................................................................................4
1.4 Introduction and method of analysis................................................................................5
2. Ratio Analysis (5 year trend and benchmarking)....................................................................5
2.1 Profitability Ratio.............................................................................................................6
2.2 Liquidity ratio...................................................................................................................8
2.3 Efficiency ratio.................................................................................................................9
2.4 Investors/ Leverage ratio................................................................................................11
2.5 Common Size analyses...................................................................................................13
2.6 DuPont Analysis.............................................................................................................14
3. Merits and demerits of particular analysis.............................................................................16
3.1 Ratio Analysis................................................................................................................16
3.2 Common size analysis....................................................................................................16
3.3 DuPont analysis..............................................................................................................17
4. Contemporary methods for overcoming limitations of above analysis................................18
4.1 Capital Asset pricing model...........................................................................................18
4.2 Economic value added....................................................................................................19
4.3 Efficient market hypothesis............................................................................................19
CONCLUSION..............................................................................................................................20
REFERENCES..............................................................................................................................21
APPENDIX....................................................................................................................................23
1. Financial statements of Booker Plc .......................................................................................23
2. Financial statements of Tate & Lyle......................................................................................28
3. Vertical analysis of Booker Group Plc..................................................................................34
4. Vertical analysis of Tate & Lyle Plc.....................................................................................39
5. Horizontal analysis of Booker Plc.........................................................................................45
6. Horizontal analysis of Tate & Lyle Plc.................................................................................50
7. Benchmarking ratio of Booker Group Plc ............................................................................54
8. Benchmarking ratio of Tate & Lyle Plc ................................................................................56
9. Dupont analysis of Booker Group Plc ..................................................................................58
10. Dupont analysis of Tate & Lyle Plc ....................................................................................59
9. Dupont analysis of Booker Group Plc ..................................................................................58
10. Dupont analysis of Tate & Lyle Plc ....................................................................................59
⊘ This is a preview!⊘
Do you want full access?
Subscribe today to unlock all pages.
Trusted by 1+ million students worldwide
1. INTRODUCTION
1.1 Strategic financial analysis and its importance
Strategic financial analysis is replicated as value creating and powerful framework which helps senior executives for assessing
strategy, analysing business value with its performance. It also weighs potential acquisition and to assess global competition. It lays
special emphasis on process of valuation which is relevant for decision makers. This financial analysis helps in exploring best
practices for improving and benchmarking its performance. Hence, by obtaining financial information, it helps business for taking
rationale decisions and future planning as well. It raises organization's profitability for doing well and usually this concept is used in
various corporate.
1.2 Report objectives
The main objective behind initiating current study is to assess or evaluate financial position and performance of Booker Group
PLC over the period of 5 years and in comparison to Tate & Lyle PLC.
1.3 Introducing 2 selected organization
Booker Group PLC
Booker Group PLC is a Britain food wholesaler organization located in United Kingdom. It was founded through George and
Richard Booker in 1835. This group consists of Makro Booker Direct, Booker wholesale, Ritter Couriyard, Family Shopper, Chef
Direct, Budgen Londies along with booker India operates through 13000 employees and 1.5 million customers are served.
Tate & Lyle PLC
It is a British multinational company which operates in agribusiness. It had merger in year 1921 and formed through Henry
Tate & Sons along with Abram Lyle & Sons. The organization has produced product of refining sugar and in year 1970 it started
diversifying and divests in sugar business in year 2012. It had attained expertise with application of innovative technology for
4
Paraphrase This Document
Need a fresh take? Get an instant paraphrase of this document with our AI Paraphraser
changing raw materials such as oats, tapioca and corn in high quality with different ingredients which aggregates taste, nutrients,
texture with increment in functionality to beverage and food, animal food and industrial chemicals.
The Booker and Tate & Lyle PLC both are comprised in food segment of industry, similar target consumers and market
capitalization could be compared.
1.4 Introduction and method of analysis
Both organization are directly listed on London Stock Exchange in FTSE 250 Index. With reference to above aspect, this study
would be evaluating business performance, financial capacity, industry outlook, overall firm situation and framework of Tate & Lyle
and Booker Group PLC. It had analysed tools such as calculation of ratio such as profitability and liquidity ratio. It would be
signifying vertical and horizontal analysis with context of balance sheet and income statement. Further, there will be representation of
DuPont analysis, asset and profit efficiency and financial statement notes which allows lenders and investors for sharpening analysis
with understanding of performance of organization.
2. Ratio Analysis (5 year trend and benchmarking)
In the present scenario, financial statements are effectively used for determining and measuring performance of organization
on basis of current and past financial condition. The future trend is forecasted with reference to its financial position. The financial
statements are prepared through management with objective of reflecting period which had attained progress. The ratio analysis is
considered as very effective and widely used tools for monitoring and evaluating financial performance of company. It helps
management and investor for giving easier and effective aspect of understanding the figure's abundance in financial statements ( Sales,
Ghirardi and Jorquera, 2017).
5
2.1 Profitability Ratio
It is class of financial metrics which helps in assessing capability of business for generating earnings on basis of associated
expenses. In simple words, it is referred to profit earning of business through revenue of sales and efficiency of its operations. It helps
in examining its performance and comparison among current year and past records of performance.
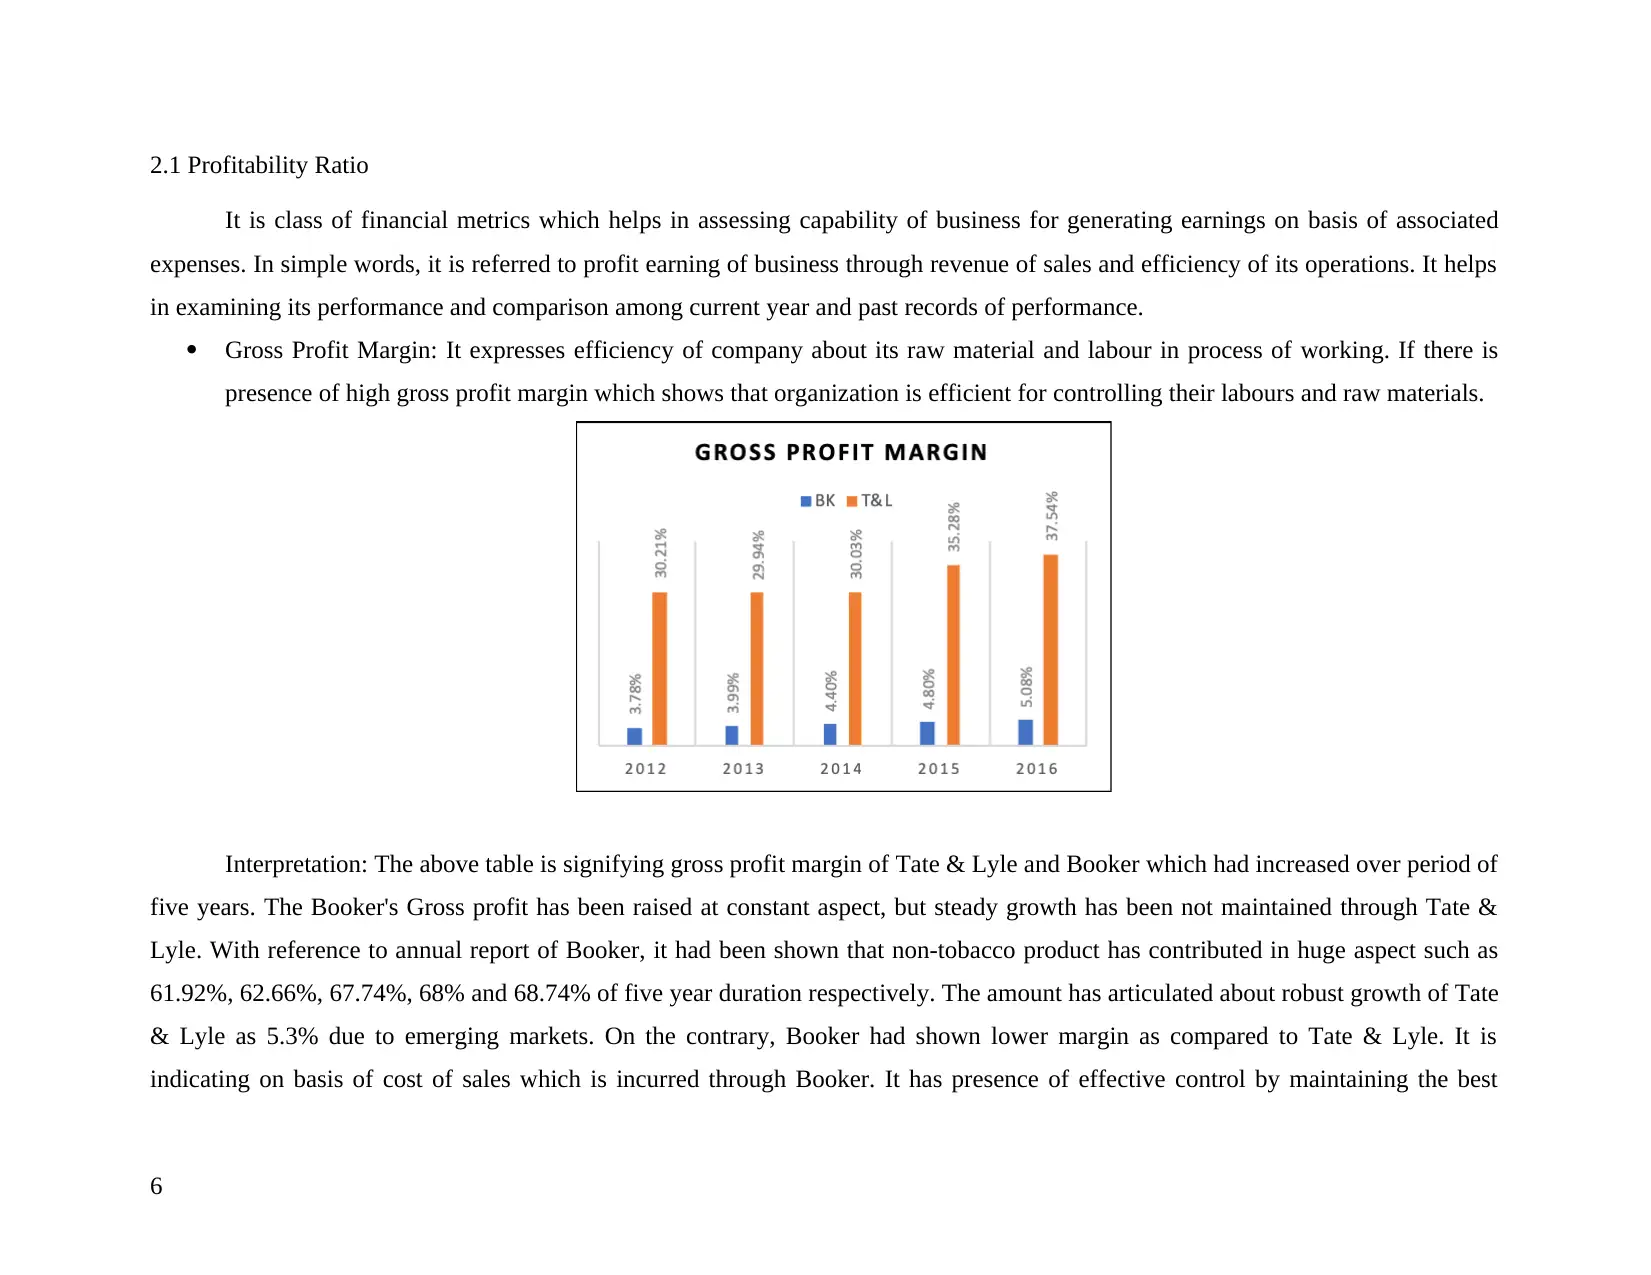
Gross Profit Margin: It expresses efficiency of company about its raw material and labour in process of working. If there is
presence of high gross profit margin which shows that organization is efficient for controlling their labours and raw materials.
Interpretation: The above table is signifying gross profit margin of Tate & Lyle and Booker which had increased over period of
five years. The Booker's Gross profit has been raised at constant aspect, but steady growth has been not maintained through Tate &
Lyle. With reference to annual report of Booker, it had been shown that non-tobacco product has contributed in huge aspect such as
61.92%, 62.66%, 67.74%, 68% and 68.74% of five year duration respectively. The amount has articulated about robust growth of Tate
& Lyle as 5.3% due to emerging markets. On the contrary, Booker had shown lower margin as compared to Tate & Lyle. It is
indicating on basis of cost of sales which is incurred through Booker. It has presence of effective control by maintaining the best
6
It is class of financial metrics which helps in assessing capability of business for generating earnings on basis of associated
expenses. In simple words, it is referred to profit earning of business through revenue of sales and efficiency of its operations. It helps
in examining its performance and comparison among current year and past records of performance.
Gross Profit Margin: It expresses efficiency of company about its raw material and labour in process of working. If there is
presence of high gross profit margin which shows that organization is efficient for controlling their labours and raw materials.
Interpretation: The above table is signifying gross profit margin of Tate & Lyle and Booker which had increased over period of
five years. The Booker's Gross profit has been raised at constant aspect, but steady growth has been not maintained through Tate &
Lyle. With reference to annual report of Booker, it had been shown that non-tobacco product has contributed in huge aspect such as
61.92%, 62.66%, 67.74%, 68% and 68.74% of five year duration respectively. The amount has articulated about robust growth of Tate
& Lyle as 5.3% due to emerging markets. On the contrary, Booker had shown lower margin as compared to Tate & Lyle. It is
indicating on basis of cost of sales which is incurred through Booker. It has presence of effective control by maintaining the best
6
⊘ This is a preview!⊘
Do you want full access?
Subscribe today to unlock all pages.
Trusted by 1+ million students worldwide
relationship with its suppliers. These are comparatively higher from cost of sales occurred by Tate & Lyle by lower base of material
cost with consolidating its US facility in production.
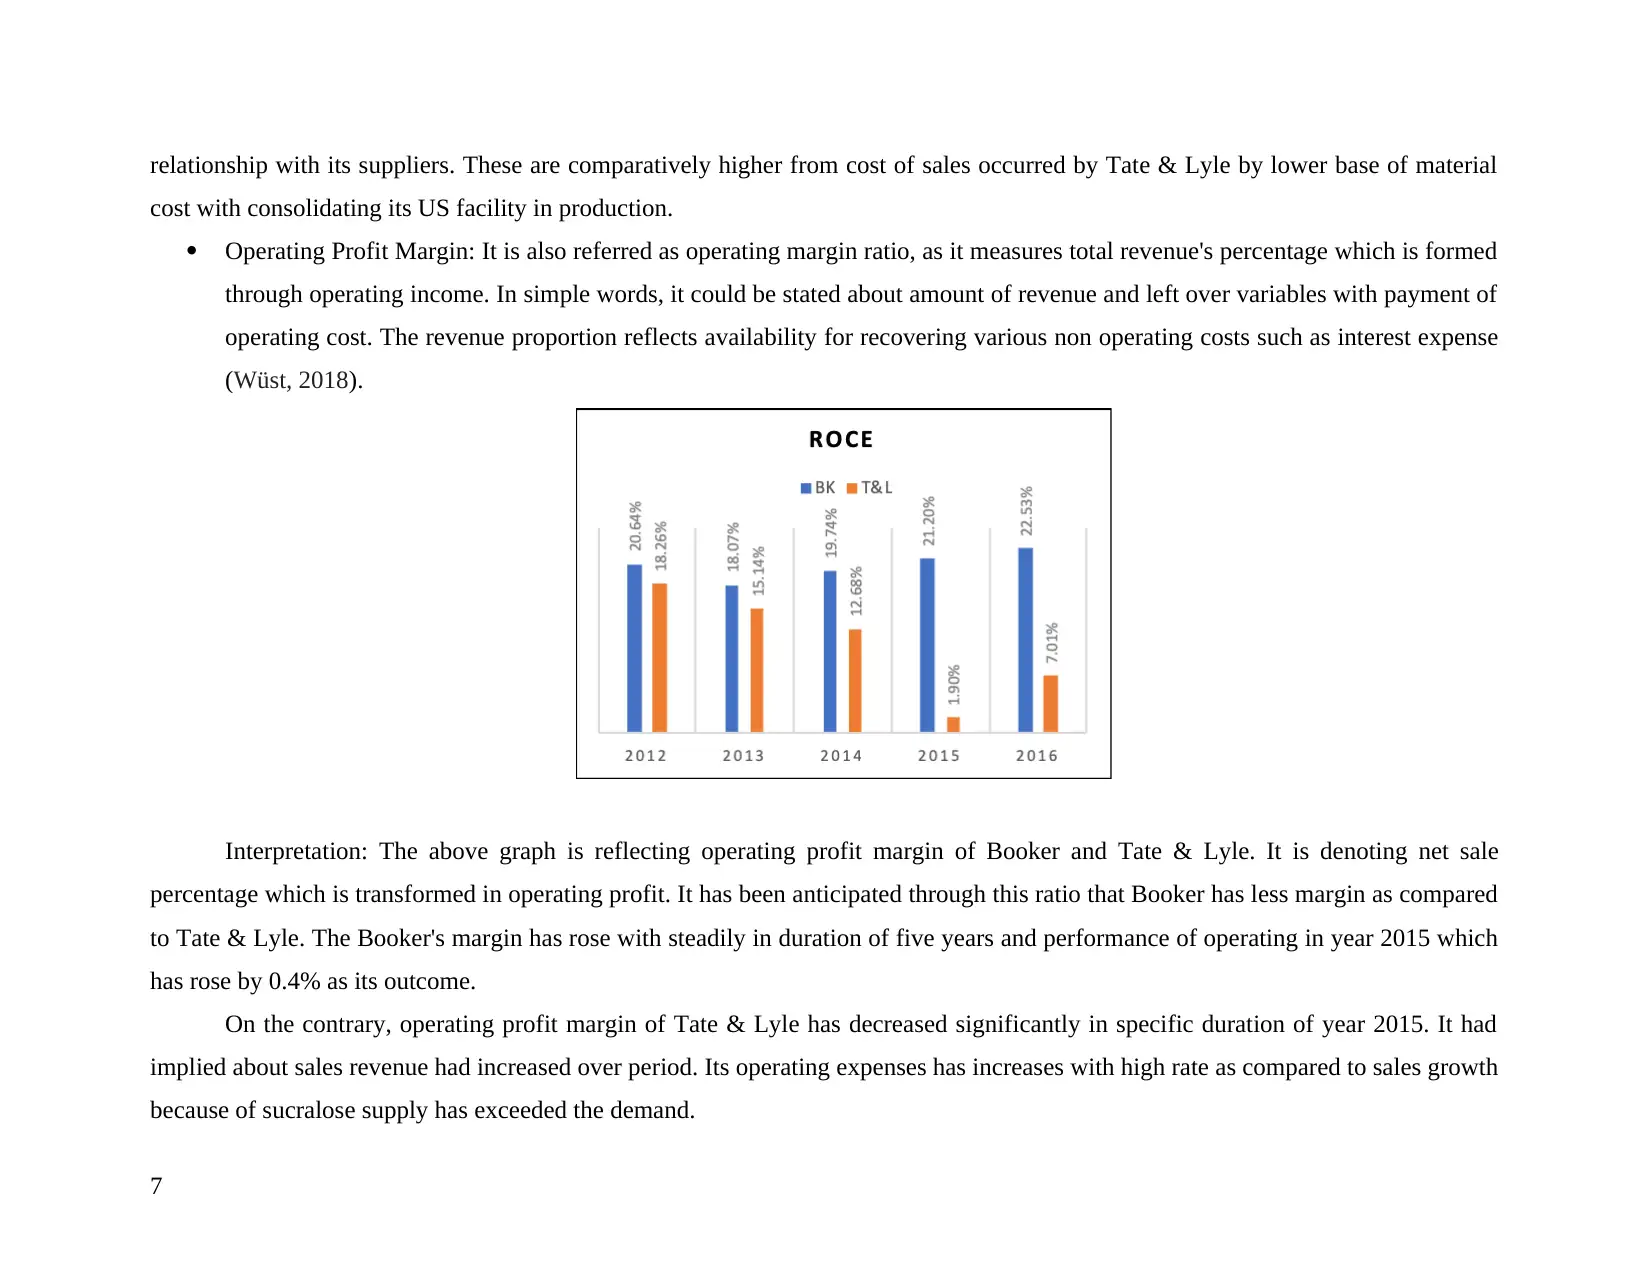
Operating Profit Margin: It is also referred as operating margin ratio, as it measures total revenue's percentage which is formed
through operating income. In simple words, it could be stated about amount of revenue and left over variables with payment of
operating cost. The revenue proportion reflects availability for recovering various non operating costs such as interest expense
(Wüst, 2018).
Interpretation: The above graph is reflecting operating profit margin of Booker and Tate & Lyle. It is denoting net sale
percentage which is transformed in operating profit. It has been anticipated through this ratio that Booker has less margin as compared
to Tate & Lyle. The Booker's margin has rose with steadily in duration of five years and performance of operating in year 2015 which
has rose by 0.4% as its outcome.
On the contrary, operating profit margin of Tate & Lyle has decreased significantly in specific duration of year 2015. It had
implied about sales revenue had increased over period. Its operating expenses has increases with high rate as compared to sales growth
because of sucralose supply has exceeded the demand.
7
cost with consolidating its US facility in production.
Operating Profit Margin: It is also referred as operating margin ratio, as it measures total revenue's percentage which is formed
through operating income. In simple words, it could be stated about amount of revenue and left over variables with payment of
operating cost. The revenue proportion reflects availability for recovering various non operating costs such as interest expense
(Wüst, 2018).
Interpretation: The above graph is reflecting operating profit margin of Booker and Tate & Lyle. It is denoting net sale
percentage which is transformed in operating profit. It has been anticipated through this ratio that Booker has less margin as compared
to Tate & Lyle. The Booker's margin has rose with steadily in duration of five years and performance of operating in year 2015 which
has rose by 0.4% as its outcome.
On the contrary, operating profit margin of Tate & Lyle has decreased significantly in specific duration of year 2015. It had
implied about sales revenue had increased over period. Its operating expenses has increases with high rate as compared to sales growth
because of sucralose supply has exceeded the demand.
7
Paraphrase This Document
Need a fresh take? Get an instant paraphrase of this document with our AI Paraphraser
2.2 Liquidity ratio
It is an indicator where current asset of organization are enough for accomplishing obligations of organization when they are
due. This ratio impacts credit rating and credibility of business entity. In simple words, it is class of financial metrics used for
identifying ability of debtor for repaying its current debt obligation with absence of raising external capital.
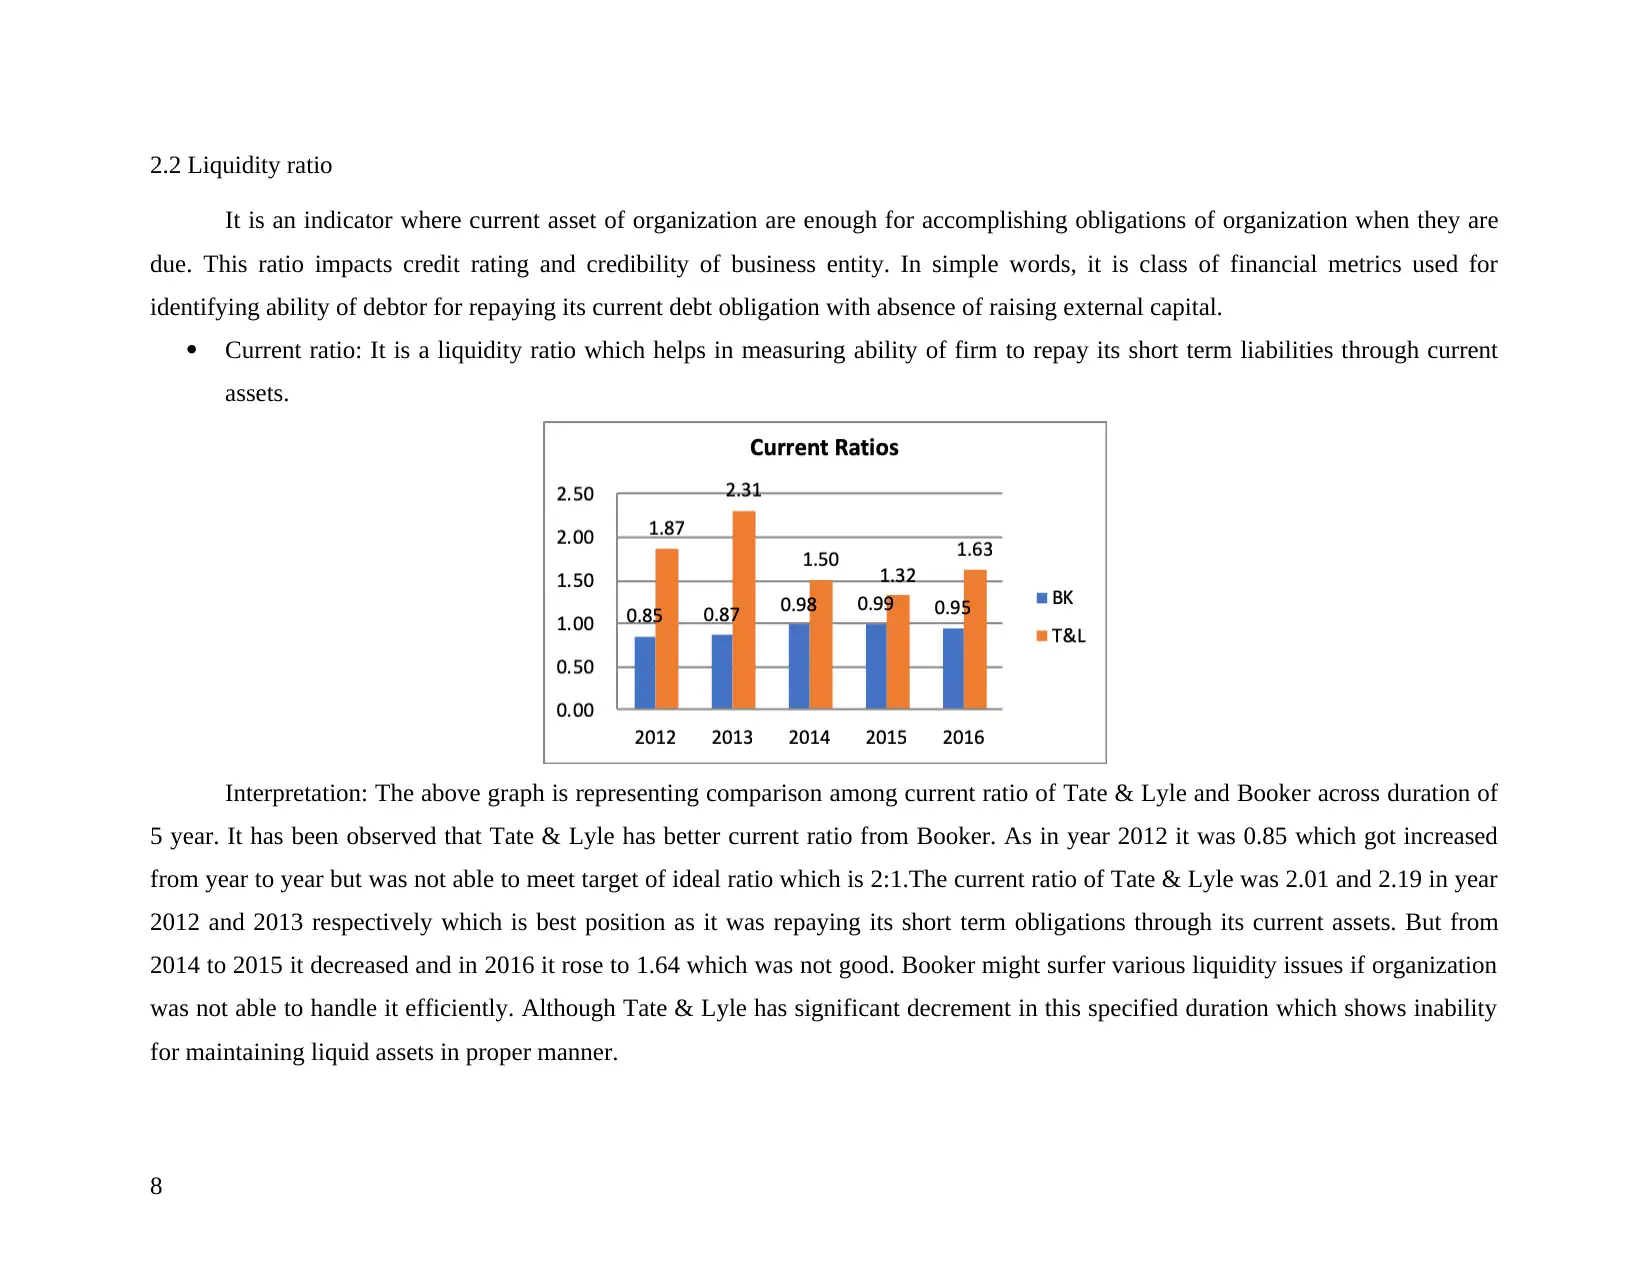
Current ratio: It is a liquidity ratio which helps in measuring ability of firm to repay its short term liabilities through current
assets.
Interpretation: The above graph is representing comparison among current ratio of Tate & Lyle and Booker across duration of
5 year. It has been observed that Tate & Lyle has better current ratio from Booker. As in year 2012 it was 0.85 which got increased
from year to year but was not able to meet target of ideal ratio which is 2:1.The current ratio of Tate & Lyle was 2.01 and 2.19 in year
2012 and 2013 respectively which is best position as it was repaying its short term obligations through its current assets. But from
2014 to 2015 it decreased and in 2016 it rose to 1.64 which was not good. Booker might surfer various liquidity issues if organization
was not able to handle it efficiently. Although Tate & Lyle has significant decrement in this specified duration which shows inability
for maintaining liquid assets in proper manner.
8
It is an indicator where current asset of organization are enough for accomplishing obligations of organization when they are
due. This ratio impacts credit rating and credibility of business entity. In simple words, it is class of financial metrics used for
identifying ability of debtor for repaying its current debt obligation with absence of raising external capital.
Current ratio: It is a liquidity ratio which helps in measuring ability of firm to repay its short term liabilities through current
assets.
Interpretation: The above graph is representing comparison among current ratio of Tate & Lyle and Booker across duration of
5 year. It has been observed that Tate & Lyle has better current ratio from Booker. As in year 2012 it was 0.85 which got increased
from year to year but was not able to meet target of ideal ratio which is 2:1.The current ratio of Tate & Lyle was 2.01 and 2.19 in year
2012 and 2013 respectively which is best position as it was repaying its short term obligations through its current assets. But from
2014 to 2015 it decreased and in 2016 it rose to 1.64 which was not good. Booker might surfer various liquidity issues if organization
was not able to handle it efficiently. Although Tate & Lyle has significant decrement in this specified duration which shows inability
for maintaining liquid assets in proper manner.
8
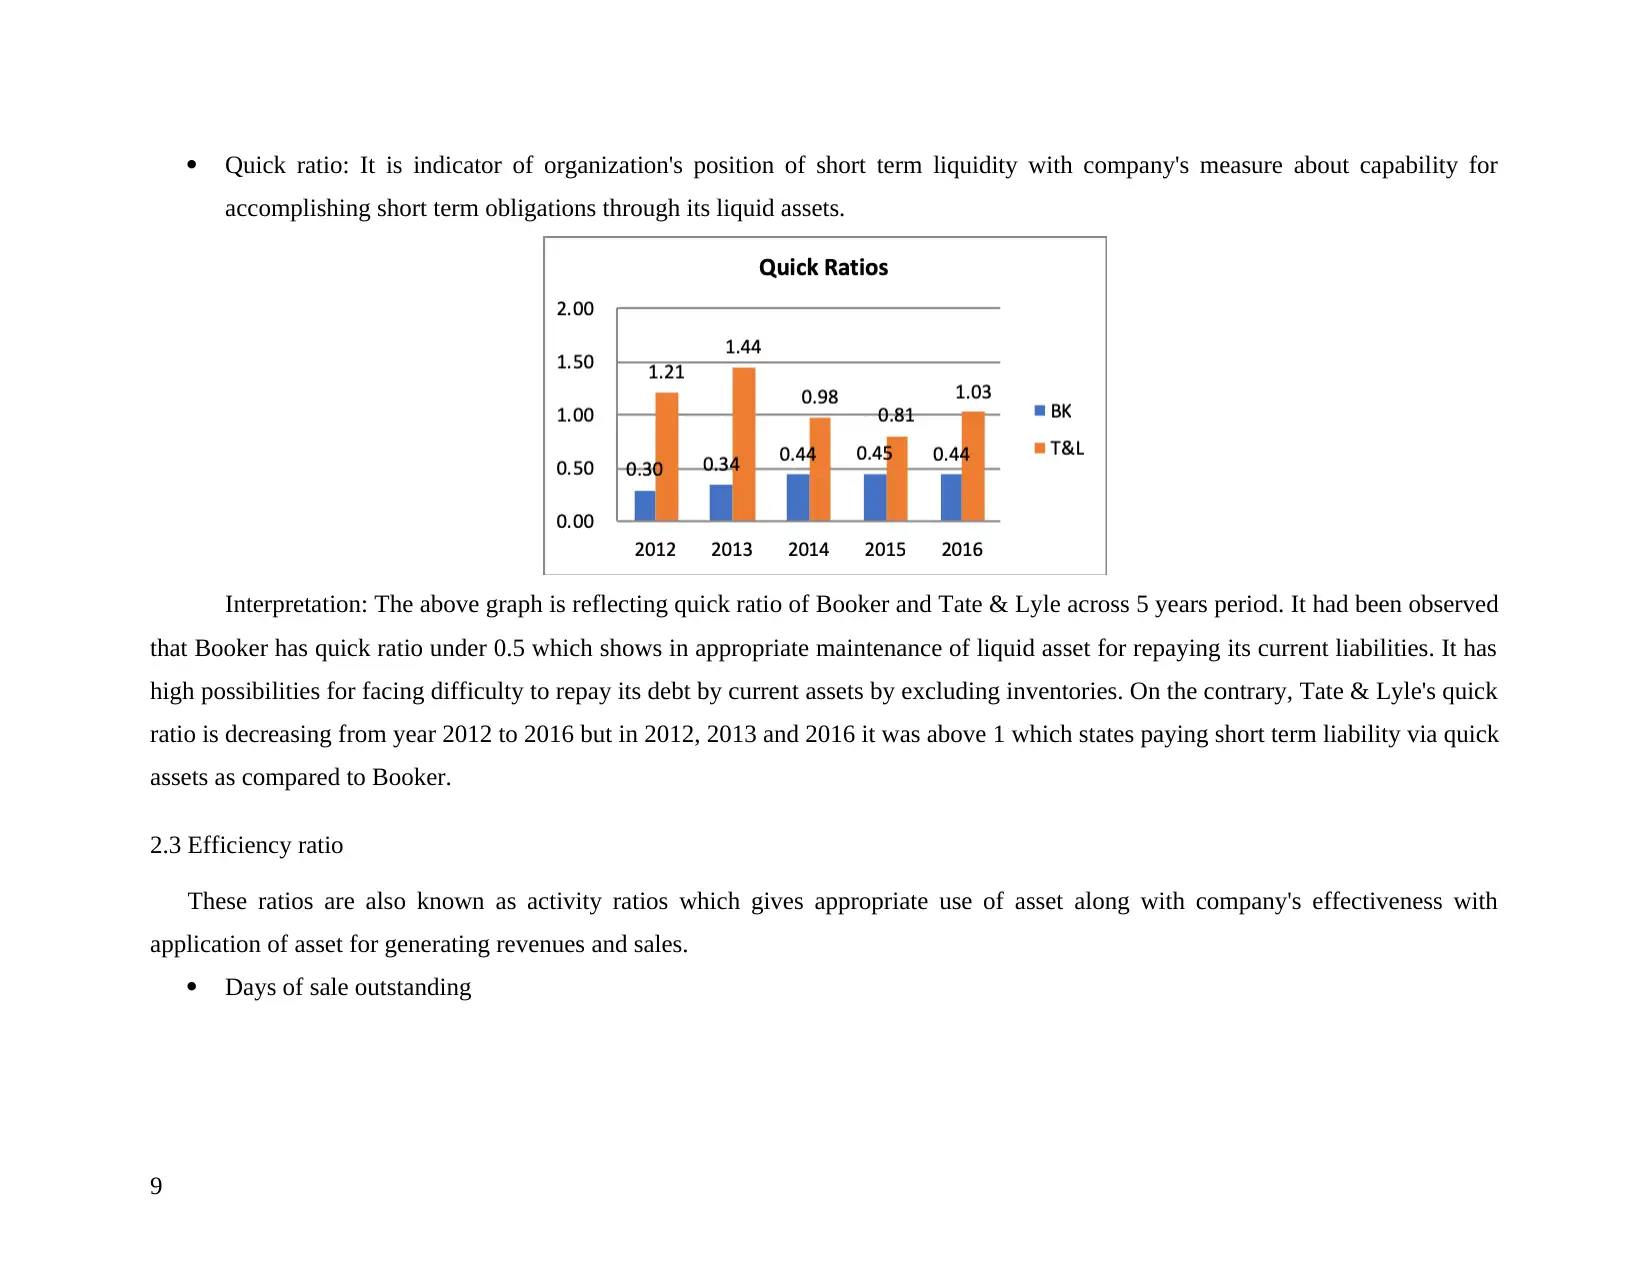
Quick ratio: It is indicator of organization's position of short term liquidity with company's measure about capability for
accomplishing short term obligations through its liquid assets.
Interpretation: The above graph is reflecting quick ratio of Booker and Tate & Lyle across 5 years period. It had been observed
that Booker has quick ratio under 0.5 which shows in appropriate maintenance of liquid asset for repaying its current liabilities. It has
high possibilities for facing difficulty to repay its debt by current assets by excluding inventories. On the contrary, Tate & Lyle's quick
ratio is decreasing from year 2012 to 2016 but in 2012, 2013 and 2016 it was above 1 which states paying short term liability via quick
assets as compared to Booker.
2.3 Efficiency ratio
These ratios are also known as activity ratios which gives appropriate use of asset along with company's effectiveness with
application of asset for generating revenues and sales.
Days of sale outstanding
9
⊘ This is a preview!⊘
Do you want full access?
Subscribe today to unlock all pages.
Trusted by 1+ million students worldwide
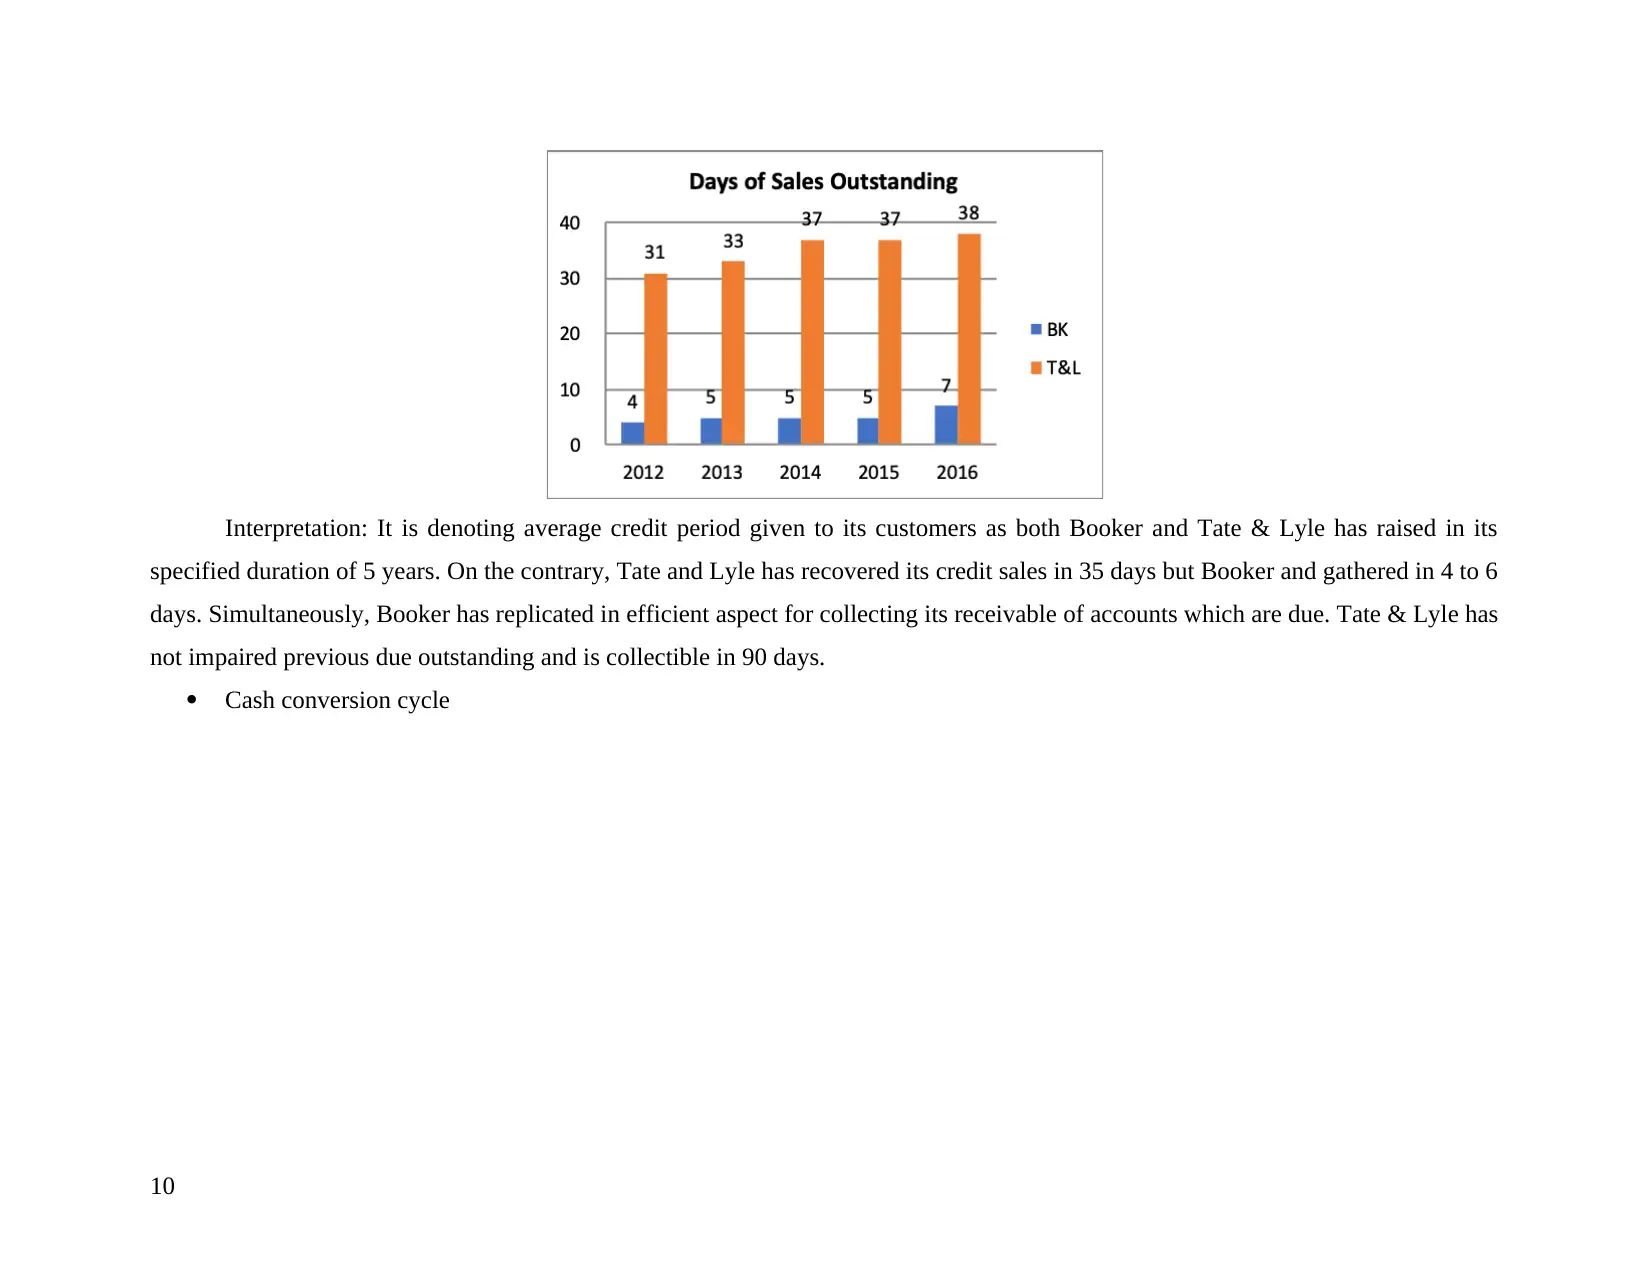
Interpretation: It is denoting average credit period given to its customers as both Booker and Tate & Lyle has raised in its
specified duration of 5 years. On the contrary, Tate and Lyle has recovered its credit sales in 35 days but Booker and gathered in 4 to 6
days. Simultaneously, Booker has replicated in efficient aspect for collecting its receivable of accounts which are due. Tate & Lyle has
not impaired previous due outstanding and is collectible in 90 days.
Cash conversion cycle
10
Paraphrase This Document
Need a fresh take? Get an instant paraphrase of this document with our AI Paraphraser
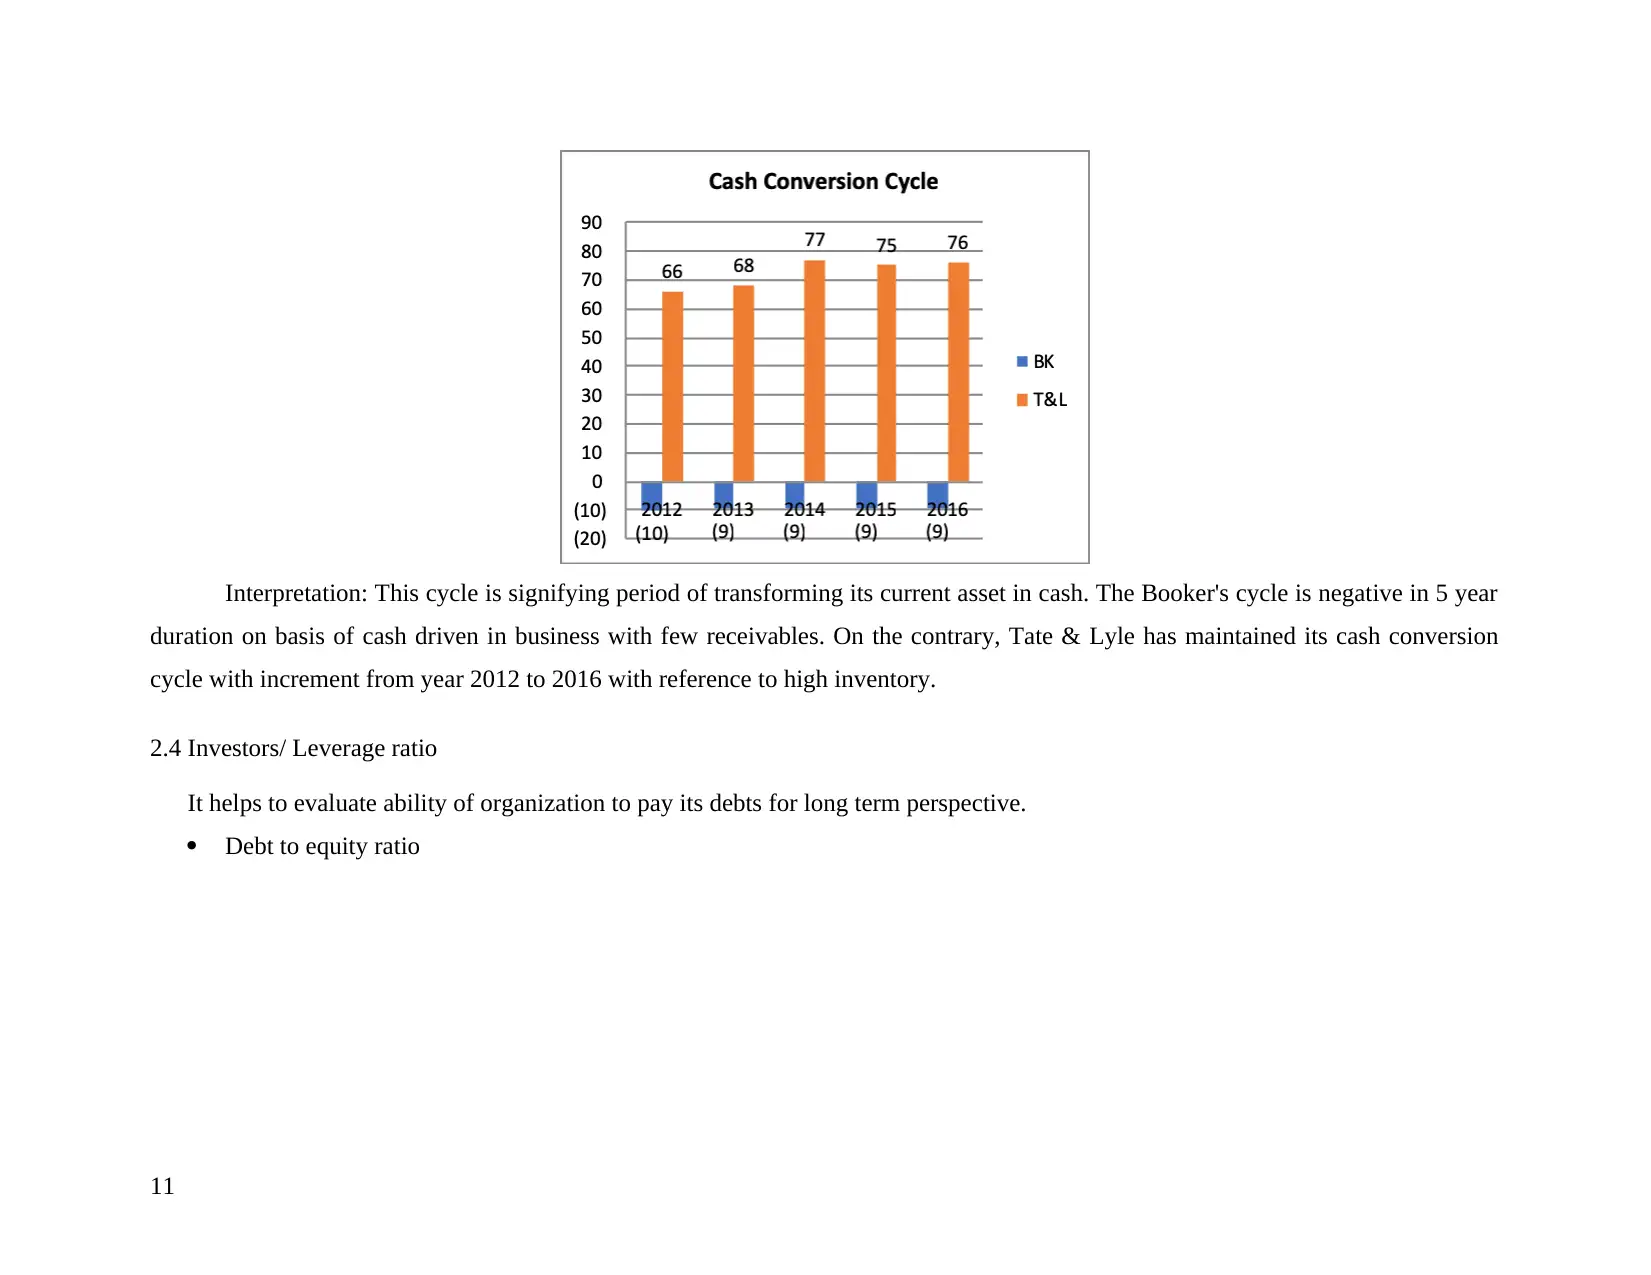
Interpretation: This cycle is signifying period of transforming its current asset in cash. The Booker's cycle is negative in 5 year
duration on basis of cash driven in business with few receivables. On the contrary, Tate & Lyle has maintained its cash conversion
cycle with increment from year 2012 to 2016 with reference to high inventory.
2.4 Investors/ Leverage ratio
It helps to evaluate ability of organization to pay its debts for long term perspective.
Debt to equity ratio
11
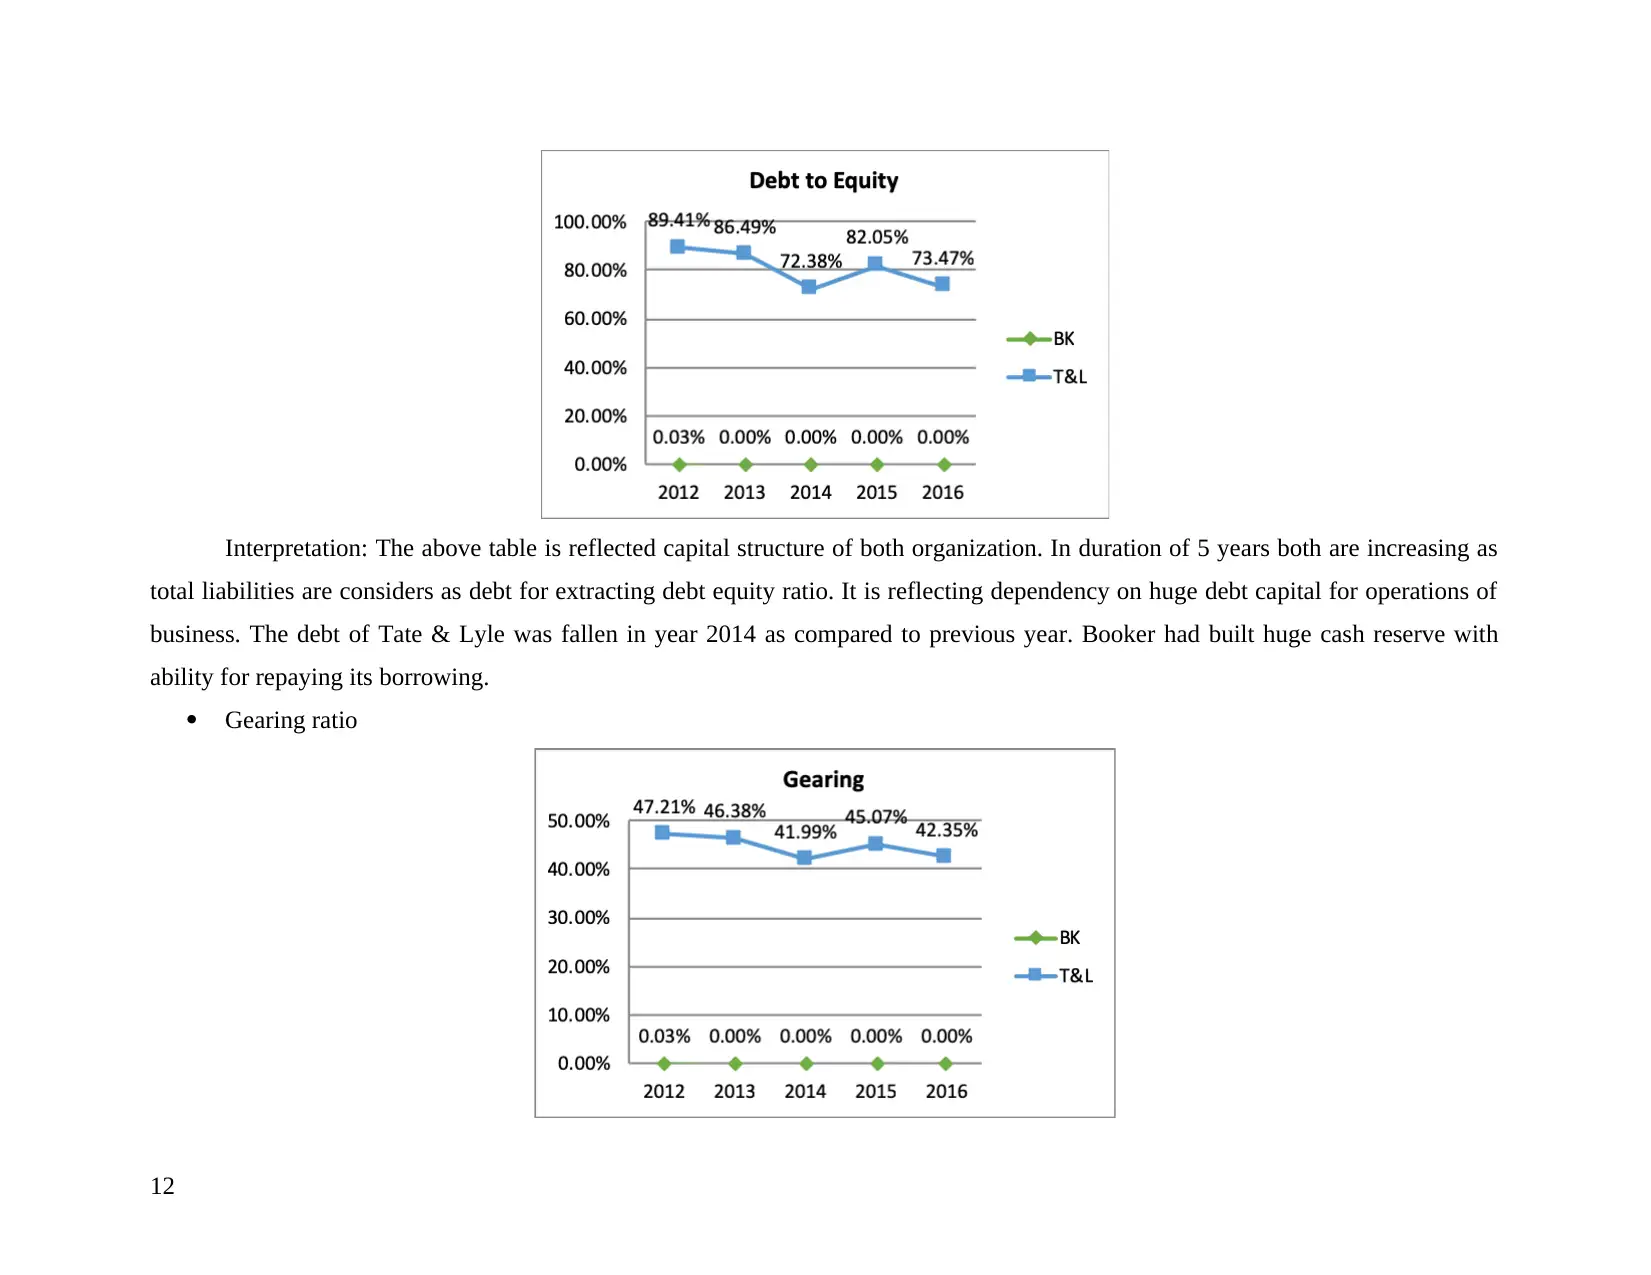
Interpretation: The above table is reflected capital structure of both organization. In duration of 5 years both are increasing as
total liabilities are considers as debt for extracting debt equity ratio. It is reflecting dependency on huge debt capital for operations of
business. The debt of Tate & Lyle was fallen in year 2014 as compared to previous year. Booker had built huge cash reserve with
ability for repaying its borrowing.
Gearing ratio
12
⊘ This is a preview!⊘
Do you want full access?
Subscribe today to unlock all pages.
Trusted by 1+ million students worldwide
1 out of 57
Related Documents


Your All-in-One AI-Powered Toolkit for Academic Success.
+13062052269
info@desklib.com
Available 24*7 on WhatsApp / Email
![[object Object]](/_next/static/media/star-bottom.7253800d.svg)
Unlock your academic potential
Copyright © 2020–2026 A2Z Services. All Rights Reserved. Developed and managed by ZUCOL.