Strategic Financial Analysis Report
VerifiedAdded on 2020/02/14
|32
|4920
|422
Report
AI Summary
This report provides a comprehensive strategic financial analysis of Tate & Lyle Plc and Wolseley Plc, two companies in different sectors. The analysis utilizes various methods including ratio analysis (profitability, liquidity, efficiency, leverage, and investor ratios), common-size statements (vertical and horizontal analysis), DuPont analysis, and segmental analysis. The report compares the financial performance of both companies over a five-year period, interpreting the results and highlighting key strengths and weaknesses. Additionally, the report discusses contemporary methods such as the Capital Asset Pricing Model (CAPM), the Efficient Market Hypothesis (EMH), and Economic Value Added (EVA) for evaluating corporate performance. The advantages and disadvantages of each analytical technique are also examined. The conclusion summarizes the findings, indicating that while both companies are financially sound, Wolseley demonstrates more effective asset utilization and higher returns for investors. Recommendations for Tate & Lyle include optimizing asset utilization, controlling operational expenditures, and implementing effective pricing and expansion strategies.
Strategic Financial analysis
Paraphrase This Document
Need a fresh take? Get an instant paraphrase of this document with our AI Paraphraser
Table of Contents
INTRODUCTION................................................................................................................................3
SFA and its significance....................................................................................................................3
Objectives.........................................................................................................................................3
Company overview...........................................................................................................................3
Analysis methods..............................................................................................................................3
RATIO ANALYSIS..............................................................................................................................4
Profitability.......................................................................................................................................4
Liquidity...........................................................................................................................................8
Efficiency/activity.............................................................................................................................9
Leverage.........................................................................................................................................12
Investors..........................................................................................................................................13
COMMON-SIZE................................................................................................................................15
Vertical analysis..............................................................................................................................15
Horizontal analysis.........................................................................................................................15
Du-Pont analysis.............................................................................................................................15
Segmental analysis..........................................................................................................................15
ADVANATAGE AND DISADVANTAGE........................................................................................17
Ratio analysis..................................................................................................................................17
Common-size..................................................................................................................................17
Du-pont...........................................................................................................................................17
Segmental analysis..........................................................................................................................18
CONCLUSION AND RECOMMENDATION..................................................................................18
Conclusion......................................................................................................................................18
Recommendation............................................................................................................................18
CONTEMPORARY METHODS.......................................................................................................19
Capital-assets-pricing-model..........................................................................................................19
Efficient market hypothesis (EMH)................................................................................................19
Economic value added....................................................................................................................19
REFERENCES...................................................................................................................................20
APPENDIX........................................................................................................................................22
INTRODUCTION
SFA and its significance
In the modern corporate world, companies are require to examine and interpret their
performance as well as financial health so as to frame better strategies and make solid decisions for the
success. SFA make use of both the internal as well as external resources for the performance evaluation
and enable managers to manage their cost of capital, creditworthiness/liquidity, financial risk and
optimal utilization of business assets (Vogiatzi, 2015). This process involves identifying, measuring,
monitoring and evaluating financial risk by adopting various techniques like horizontal, vertical and
ratio analysis method. It is very important for the directors and decision-making authority to assess and
analyze their financial performance and make better decisions to achieve set goals.
Objectives
The aim of the present assignment is to illustrate the answers with worked examples of dynamic
analysis of 2 companies. In this regard emphasizes is given on financial performance evaluation of two
companies, named Tate & Lyle Plc and its competitor, Wolseley Plc. In order to make both the internal
and external analysis, ratio analysis and horizontal and vertical analysis of SOPI, SOFP and SOCF have
been done. In addition to this, importance of contemporary methods like CAPM, EMH and EVA will
be discussed to measure corporate performance. Moreover, the report also highlight the major
shortcomings associated with associated contemporary analysis techniques like ratio analysis,
horizontal analysis of SOPI, SOFP and SOCF, Du-pont and segmental analysis of Tate & Lyle Plc and
Wolseley Plc. In addition to this, importance of contemporary methods like CAPM, EMH and EVA will
be discussed to measure corporate performance.
Company overview
Tate & Lyle (T&L) is a UK-based public limited company founded in the year 1921, listed on
LSE and headquartered in London, England, UK. It is a global agriculture business which manufacture
variety of products like corn, tapico, oats and others using different ingredients henceforth, operates in
food processing industry. Another company that has been chosen for comparative analysis is Wolseley
plc that is a multinational material distribution company for construction of building. It is one of the
leading distributors of heating and plumbing products in the world. Moreover, its product portfolio
consists of pipe, air conditioning, heating, ventilating, plumbing, waterworks and refrigeration and
carrying out operations in UK, US, Canada, Denmark and other geographical region.
⊘ This is a preview!⊘
Do you want full access?
Subscribe today to unlock all pages.
Trusted by 1+ million students worldwide
Analysis methods
Key performance indicators (KPIs) common-size statement, ratio analysis and Du-pont analysis
technique have been used for the performance evaluation. Moreover, trend analysis will be done by
applying horizontal analysis method, in which, performance will be evaluated by comparing current
performance with the base year to determine that whether it has been increased or decreased.
RATIO ANALYSIS
This is considered as an effective way to measure corporate performance by computing different
ratios. Moreover, it also helps to examine performance over the years via comparing ratios of current
year with the previous. In such respect, number of ratios has been computed regarding profitability,
solvency, assets utilization efficiency and liquidity position to assess that whether company’s
performance has been increased or decreased (Masubuchi, 2013). In addition to this, comparative
evaluation assists decision-maker to identify such company that is performing excellent in the market.
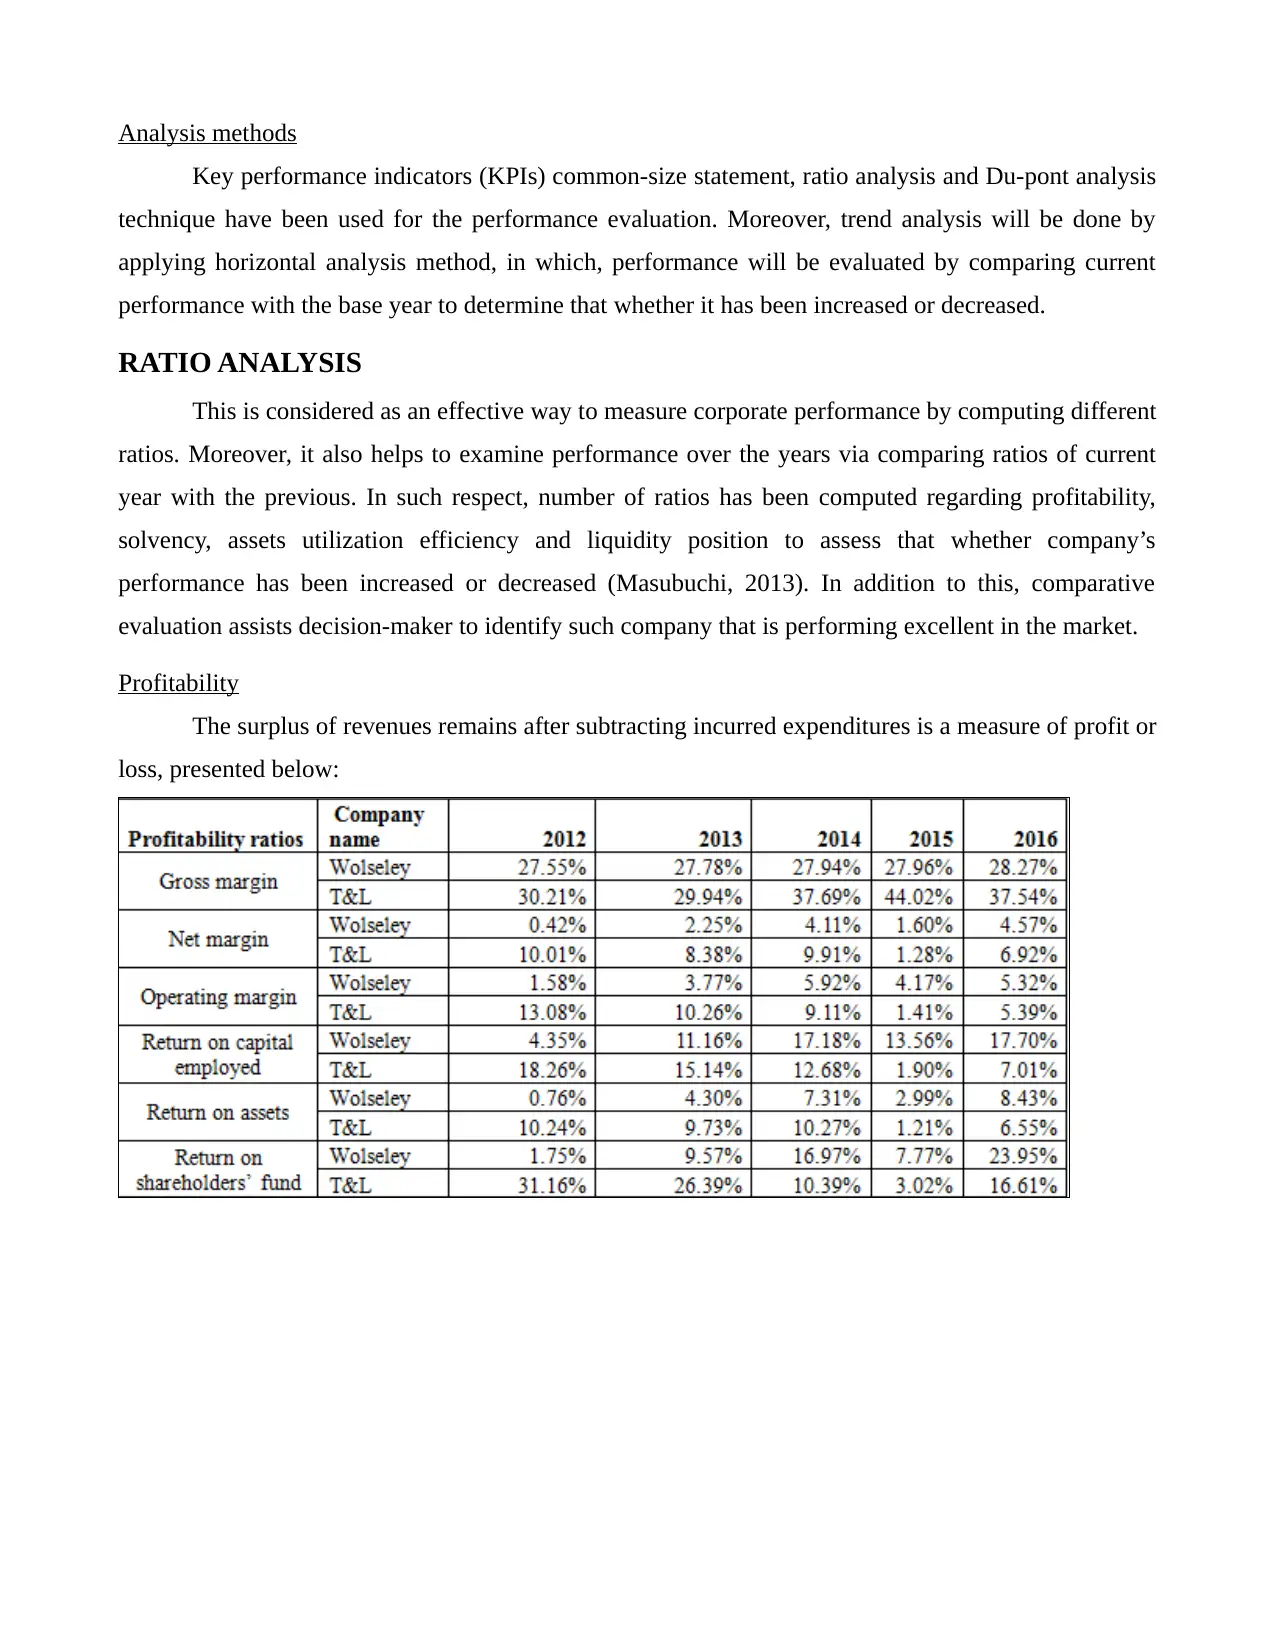
Profitability
The surplus of revenues remains after subtracting incurred expenditures is a measure of profit or
loss, presented below:
Key performance indicators (KPIs) common-size statement, ratio analysis and Du-pont analysis
technique have been used for the performance evaluation. Moreover, trend analysis will be done by
applying horizontal analysis method, in which, performance will be evaluated by comparing current
performance with the base year to determine that whether it has been increased or decreased.
RATIO ANALYSIS
This is considered as an effective way to measure corporate performance by computing different
ratios. Moreover, it also helps to examine performance over the years via comparing ratios of current
year with the previous. In such respect, number of ratios has been computed regarding profitability,
solvency, assets utilization efficiency and liquidity position to assess that whether company’s
performance has been increased or decreased (Masubuchi, 2013). In addition to this, comparative
evaluation assists decision-maker to identify such company that is performing excellent in the market.
Profitability
The surplus of revenues remains after subtracting incurred expenditures is a measure of profit or
loss, presented below:
Paraphrase This Document
Need a fresh take? Get an instant paraphrase of this document with our AI Paraphraser
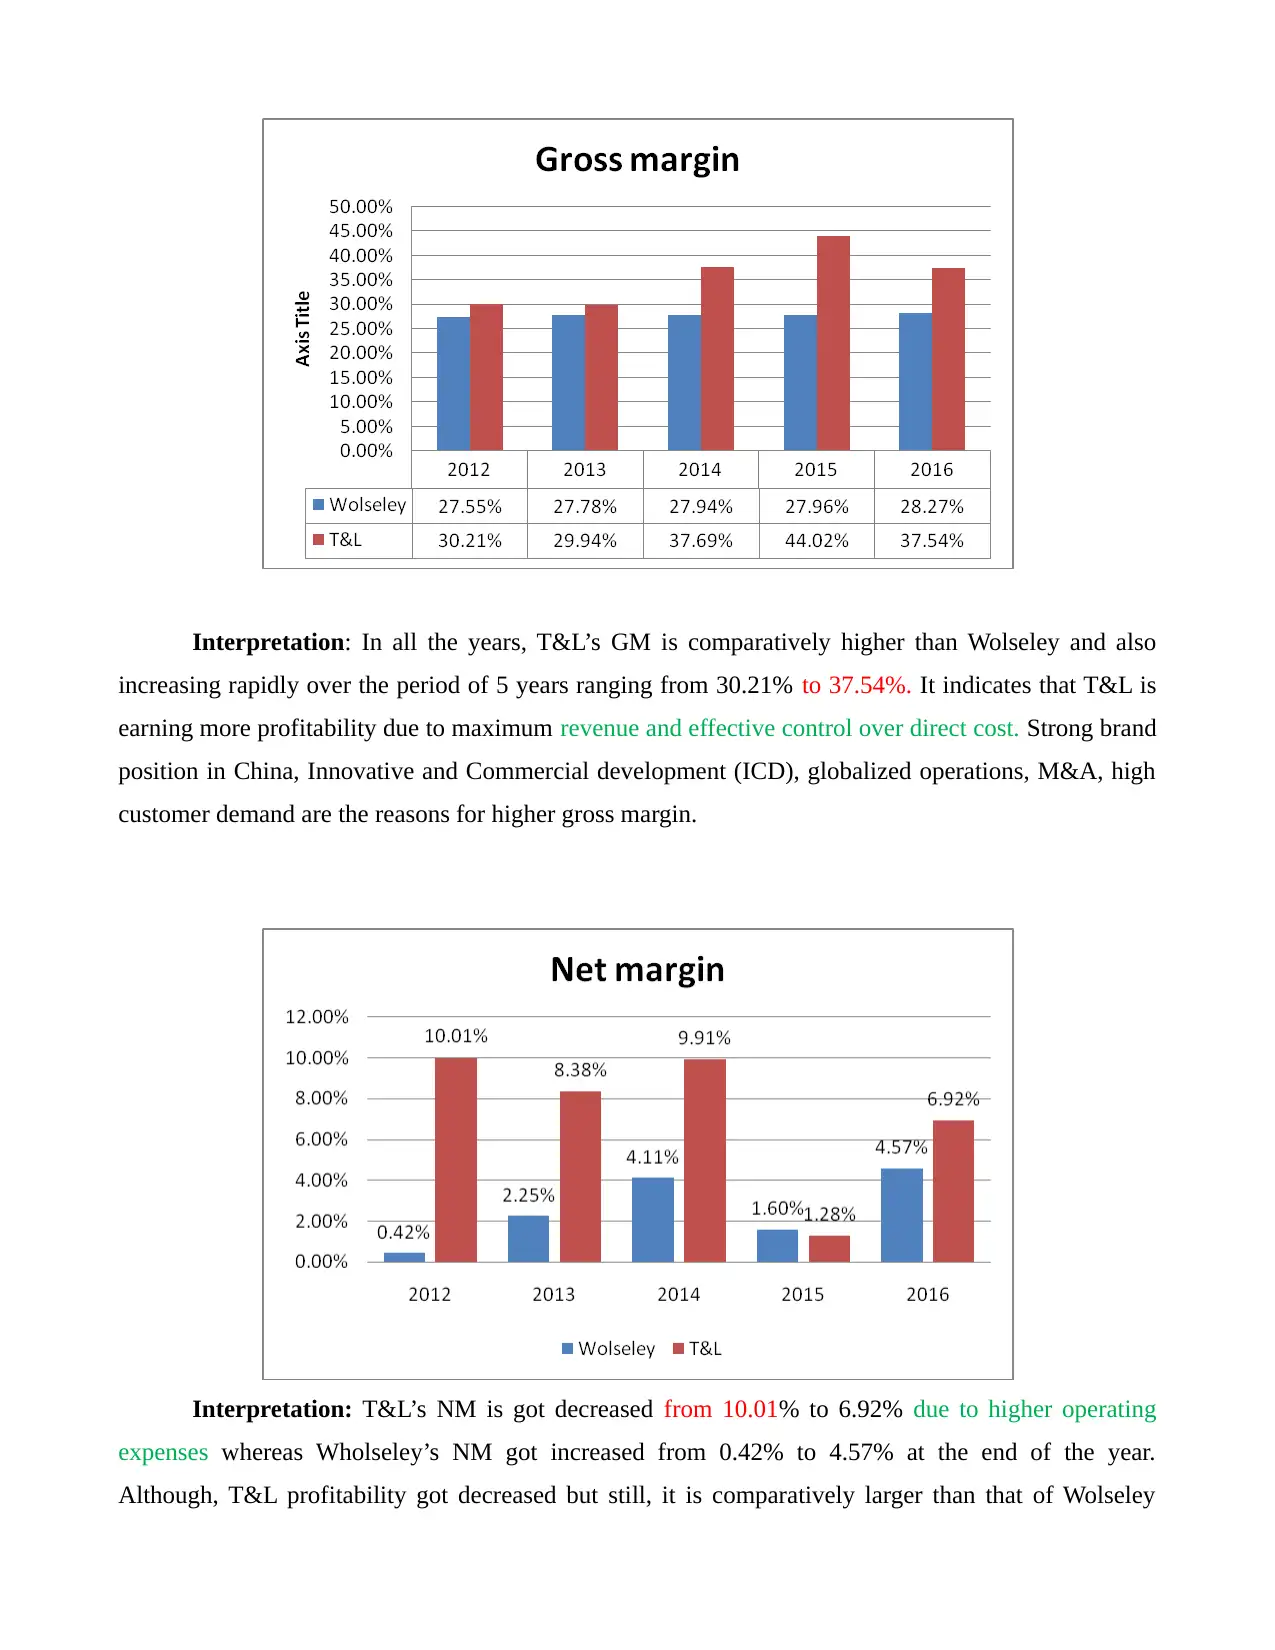
Interpretation: In all the years, T&L’s GM is comparatively higher than Wolseley and also
increasing rapidly over the period of 5 years ranging from 30.21% to 37.54%. It indicates that T&L is
earning more profitability due to maximum revenue and effective control over direct cost. Strong brand
position in China, Innovative and Commercial development (ICD), globalized operations, M&A, high
customer demand are the reasons for higher gross margin.
Interpretation: T&L’s NM is got decreased from 10.01% to 6.92% due to higher operating
expenses whereas Wholseley’s NM got increased from 0.42% to 4.57% at the end of the year.
Although, T&L profitability got decreased but still, it is comparatively larger than that of Wolseley
representing that company is earning more yield on their sales turnover and operating well in the
market (Catita and et.al., 2014). Firm Tough market competition, external market forces and volatility
in market conditions are the reasons for decline in performance.
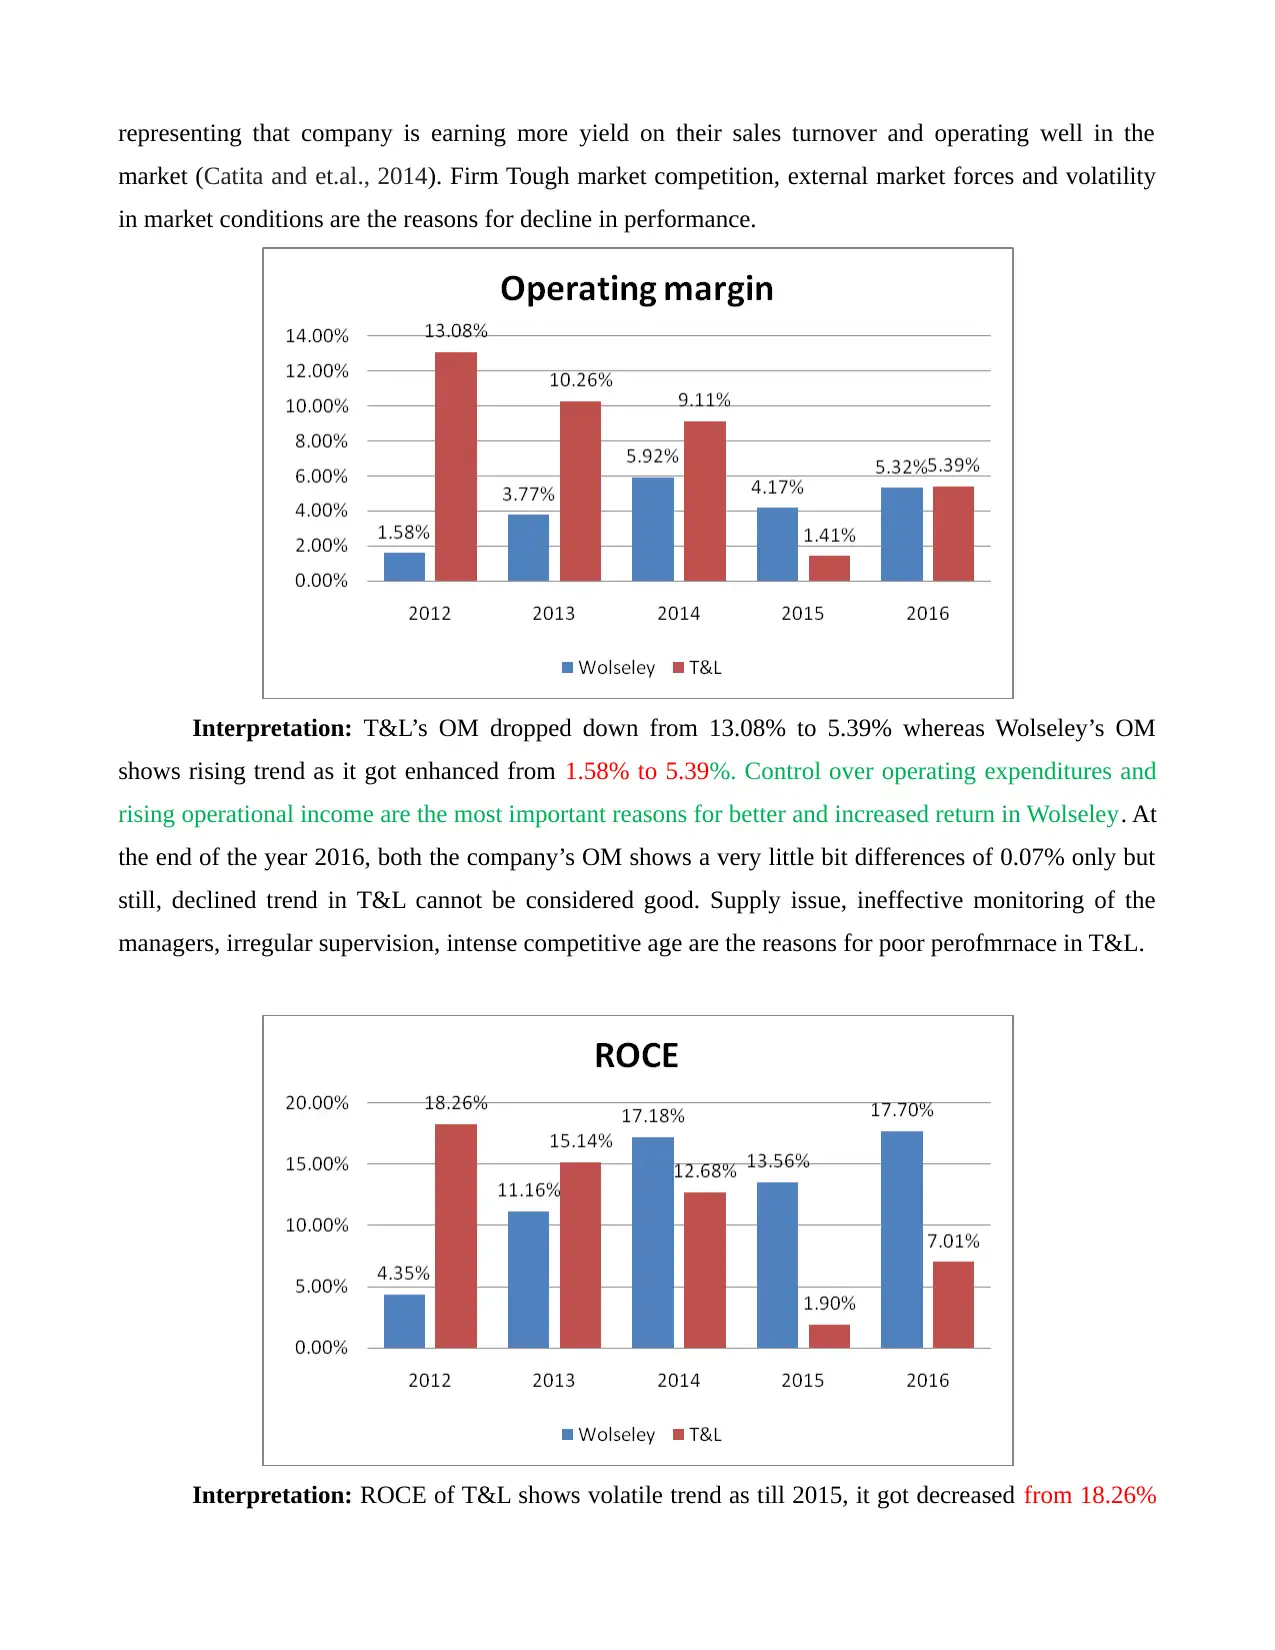
Interpretation: T&L’s OM dropped down from 13.08% to 5.39% whereas Wolseley’s OM
shows rising trend as it got enhanced from 1.58% to 5.39%. Control over operating expenditures and
rising operational income are the most important reasons for better and increased return in Wolseley. At
the end of the year 2016, both the company’s OM shows a very little bit differences of 0.07% only but
still, declined trend in T&L cannot be considered good. Supply issue, ineffective monitoring of the
managers, irregular supervision, intense competitive age are the reasons for poor perofmrnace in T&L.
Interpretation: ROCE of T&L shows volatile trend as till 2015, it got decreased from 18.26%
market (Catita and et.al., 2014). Firm Tough market competition, external market forces and volatility
in market conditions are the reasons for decline in performance.
Interpretation: T&L’s OM dropped down from 13.08% to 5.39% whereas Wolseley’s OM
shows rising trend as it got enhanced from 1.58% to 5.39%. Control over operating expenditures and
rising operational income are the most important reasons for better and increased return in Wolseley. At
the end of the year 2016, both the company’s OM shows a very little bit differences of 0.07% only but
still, declined trend in T&L cannot be considered good. Supply issue, ineffective monitoring of the
managers, irregular supervision, intense competitive age are the reasons for poor perofmrnace in T&L.
Interpretation: ROCE of T&L shows volatile trend as till 2015, it got decreased from 18.26%
⊘ This is a preview!⊘
Do you want full access?
Subscribe today to unlock all pages.
Trusted by 1+ million students worldwide
to 1.90% whereas in the next year, it got enhanced to 7.01% which is good. However, on the contrary
to this, Wolseley’s return got improved from 4.35% to 17.70% in the year 2016. Volatility in revenues,
cost and operational expenditures are the factors responsible for changes in ROCE and currently, it is
higher in Wolseley representing that it is earning greater return on their total capital employed in the
business (Verschoor, 2015).
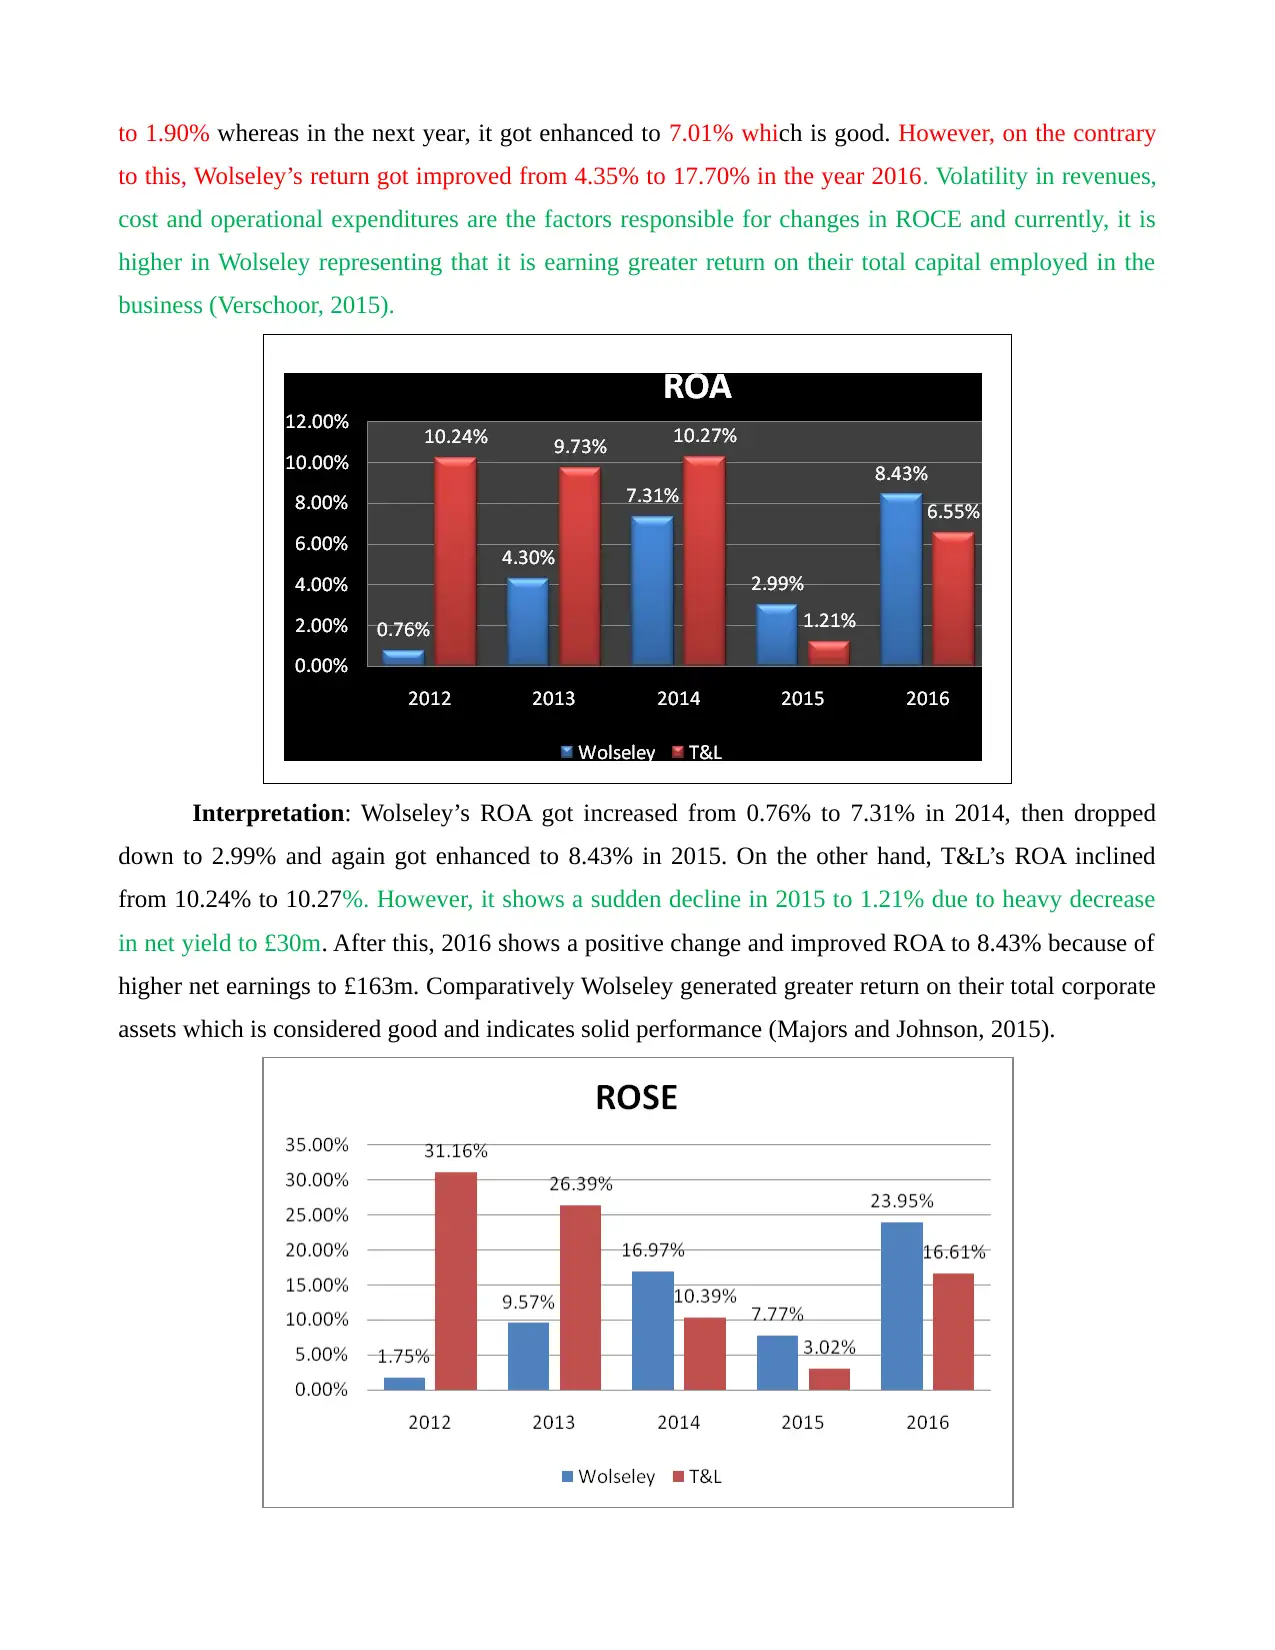
Interpretation: Wolseley’s ROA got increased from 0.76% to 7.31% in 2014, then dropped
down to 2.99% and again got enhanced to 8.43% in 2015. On the other hand, T&L’s ROA inclined
from 10.24% to 10.27%. However, it shows a sudden decline in 2015 to 1.21% due to heavy decrease
in net yield to £30m. After this, 2016 shows a positive change and improved ROA to 8.43% because of
higher net earnings to £163m. Comparatively Wolseley generated greater return on their total corporate
assets which is considered good and indicates solid performance (Majors and Johnson, 2015).
to this, Wolseley’s return got improved from 4.35% to 17.70% in the year 2016. Volatility in revenues,
cost and operational expenditures are the factors responsible for changes in ROCE and currently, it is
higher in Wolseley representing that it is earning greater return on their total capital employed in the
business (Verschoor, 2015).
Interpretation: Wolseley’s ROA got increased from 0.76% to 7.31% in 2014, then dropped
down to 2.99% and again got enhanced to 8.43% in 2015. On the other hand, T&L’s ROA inclined
from 10.24% to 10.27%. However, it shows a sudden decline in 2015 to 1.21% due to heavy decrease
in net yield to £30m. After this, 2016 shows a positive change and improved ROA to 8.43% because of
higher net earnings to £163m. Comparatively Wolseley generated greater return on their total corporate
assets which is considered good and indicates solid performance (Majors and Johnson, 2015).
Paraphrase This Document
Need a fresh take? Get an instant paraphrase of this document with our AI Paraphraser
Interpretation: Wolseley’s ROSF got inclined from to 7.77% to 23.95%. This happened
because firm earn good amount of profit in its business but its equity remain stable. However, T&L’s
ratio shows a continuous decreasing trend from 31.16% to 3.02% in 2015, but in 2015, it imrpoved to
16.61%. This happened because firm make fresh issue of shares in the market. Although improved
ratio is a good sign indicating that in 2016, both the company are offering greater return to their
shareholders, but still, greater ROA in Wolseley demonstrating that its investors are generating more
yield.
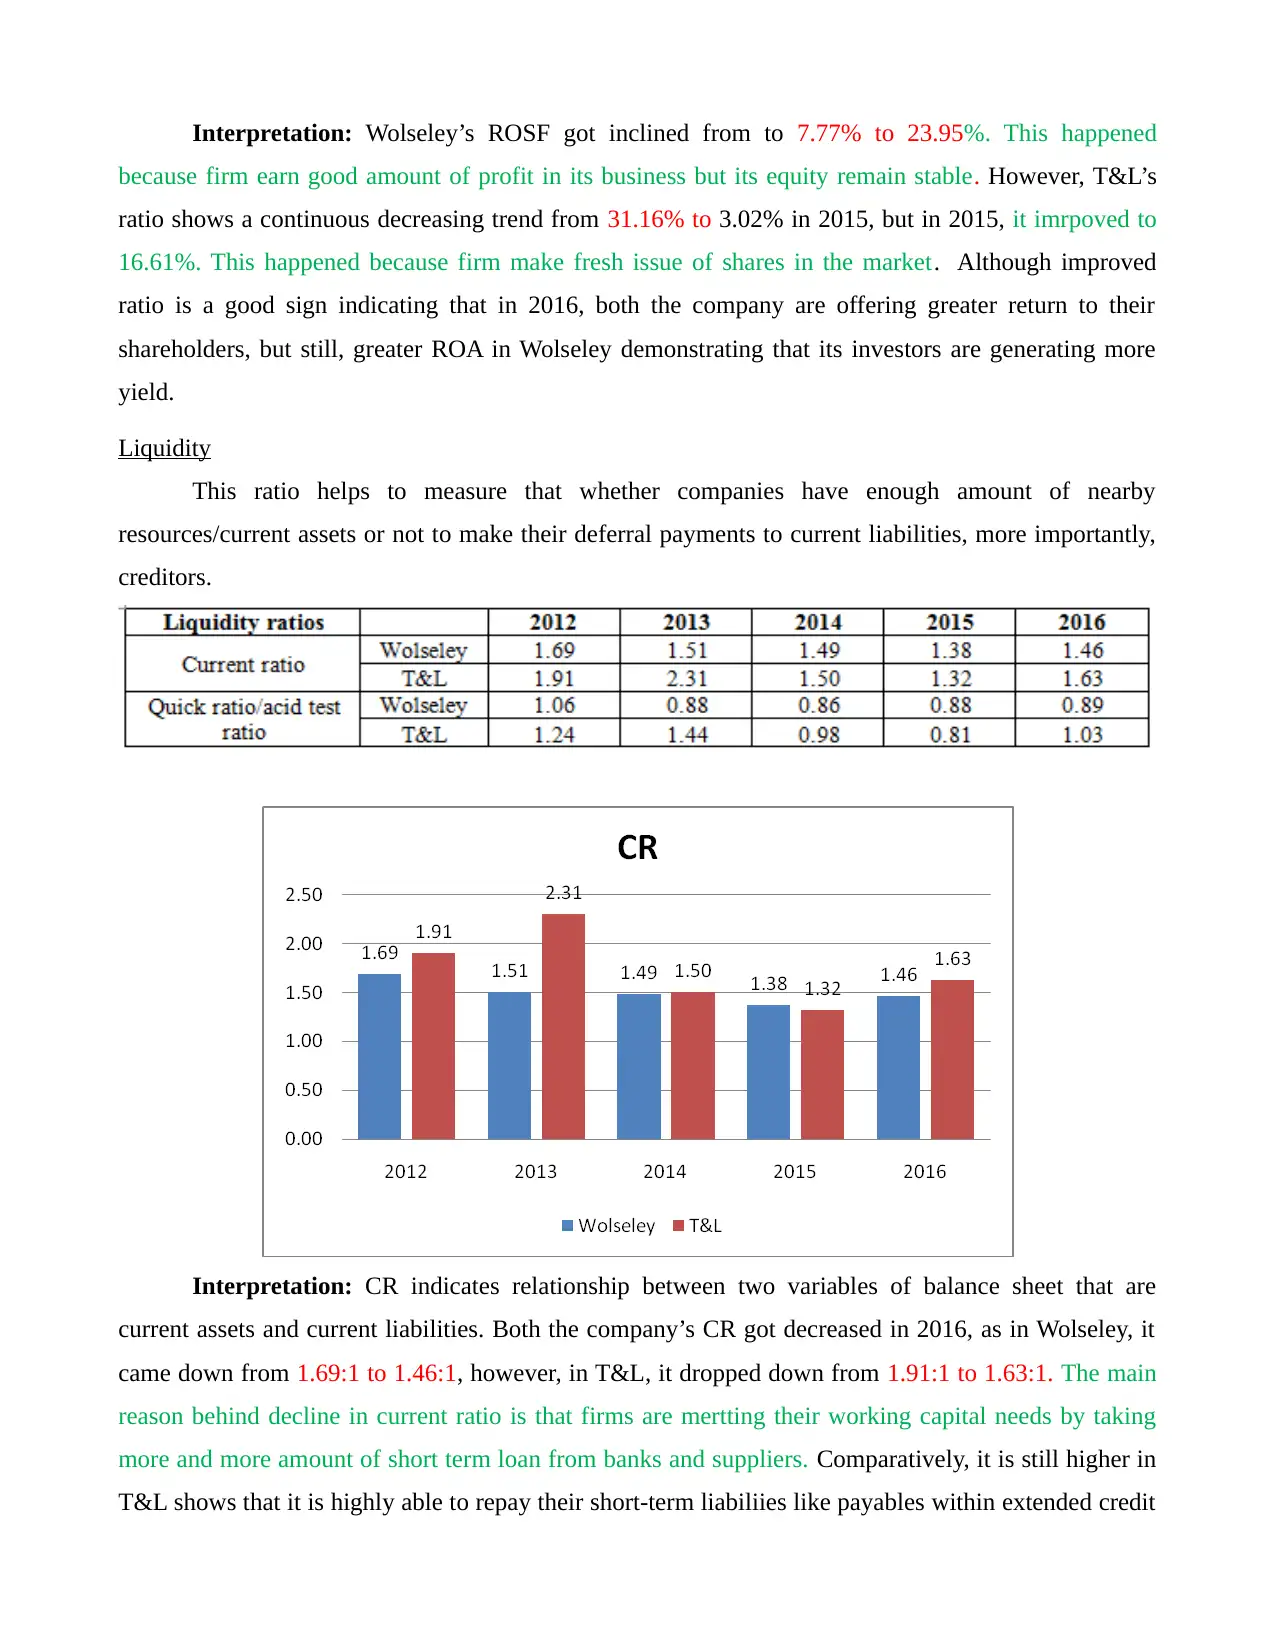
Liquidity
This ratio helps to measure that whether companies have enough amount of nearby
resources/current assets or not to make their deferral payments to current liabilities, more importantly,
creditors.
Interpretation: CR indicates relationship between two variables of balance sheet that are
current assets and current liabilities. Both the company’s CR got decreased in 2016, as in Wolseley, it
came down from 1.69:1 to 1.46:1, however, in T&L, it dropped down from 1.91:1 to 1.63:1. The main
reason behind decline in current ratio is that firms are mertting their working capital needs by taking
more and more amount of short term loan from banks and suppliers. Comparatively, it is still higher in
T&L shows that it is highly able to repay their short-term liabiliies like payables within extended credit
because firm earn good amount of profit in its business but its equity remain stable. However, T&L’s
ratio shows a continuous decreasing trend from 31.16% to 3.02% in 2015, but in 2015, it imrpoved to
16.61%. This happened because firm make fresh issue of shares in the market. Although improved
ratio is a good sign indicating that in 2016, both the company are offering greater return to their
shareholders, but still, greater ROA in Wolseley demonstrating that its investors are generating more
yield.
Liquidity
This ratio helps to measure that whether companies have enough amount of nearby
resources/current assets or not to make their deferral payments to current liabilities, more importantly,
creditors.
Interpretation: CR indicates relationship between two variables of balance sheet that are
current assets and current liabilities. Both the company’s CR got decreased in 2016, as in Wolseley, it
came down from 1.69:1 to 1.46:1, however, in T&L, it dropped down from 1.91:1 to 1.63:1. The main
reason behind decline in current ratio is that firms are mertting their working capital needs by taking
more and more amount of short term loan from banks and suppliers. Comparatively, it is still higher in
T&L shows that it is highly able to repay their short-term liabiliies like payables within extended credit
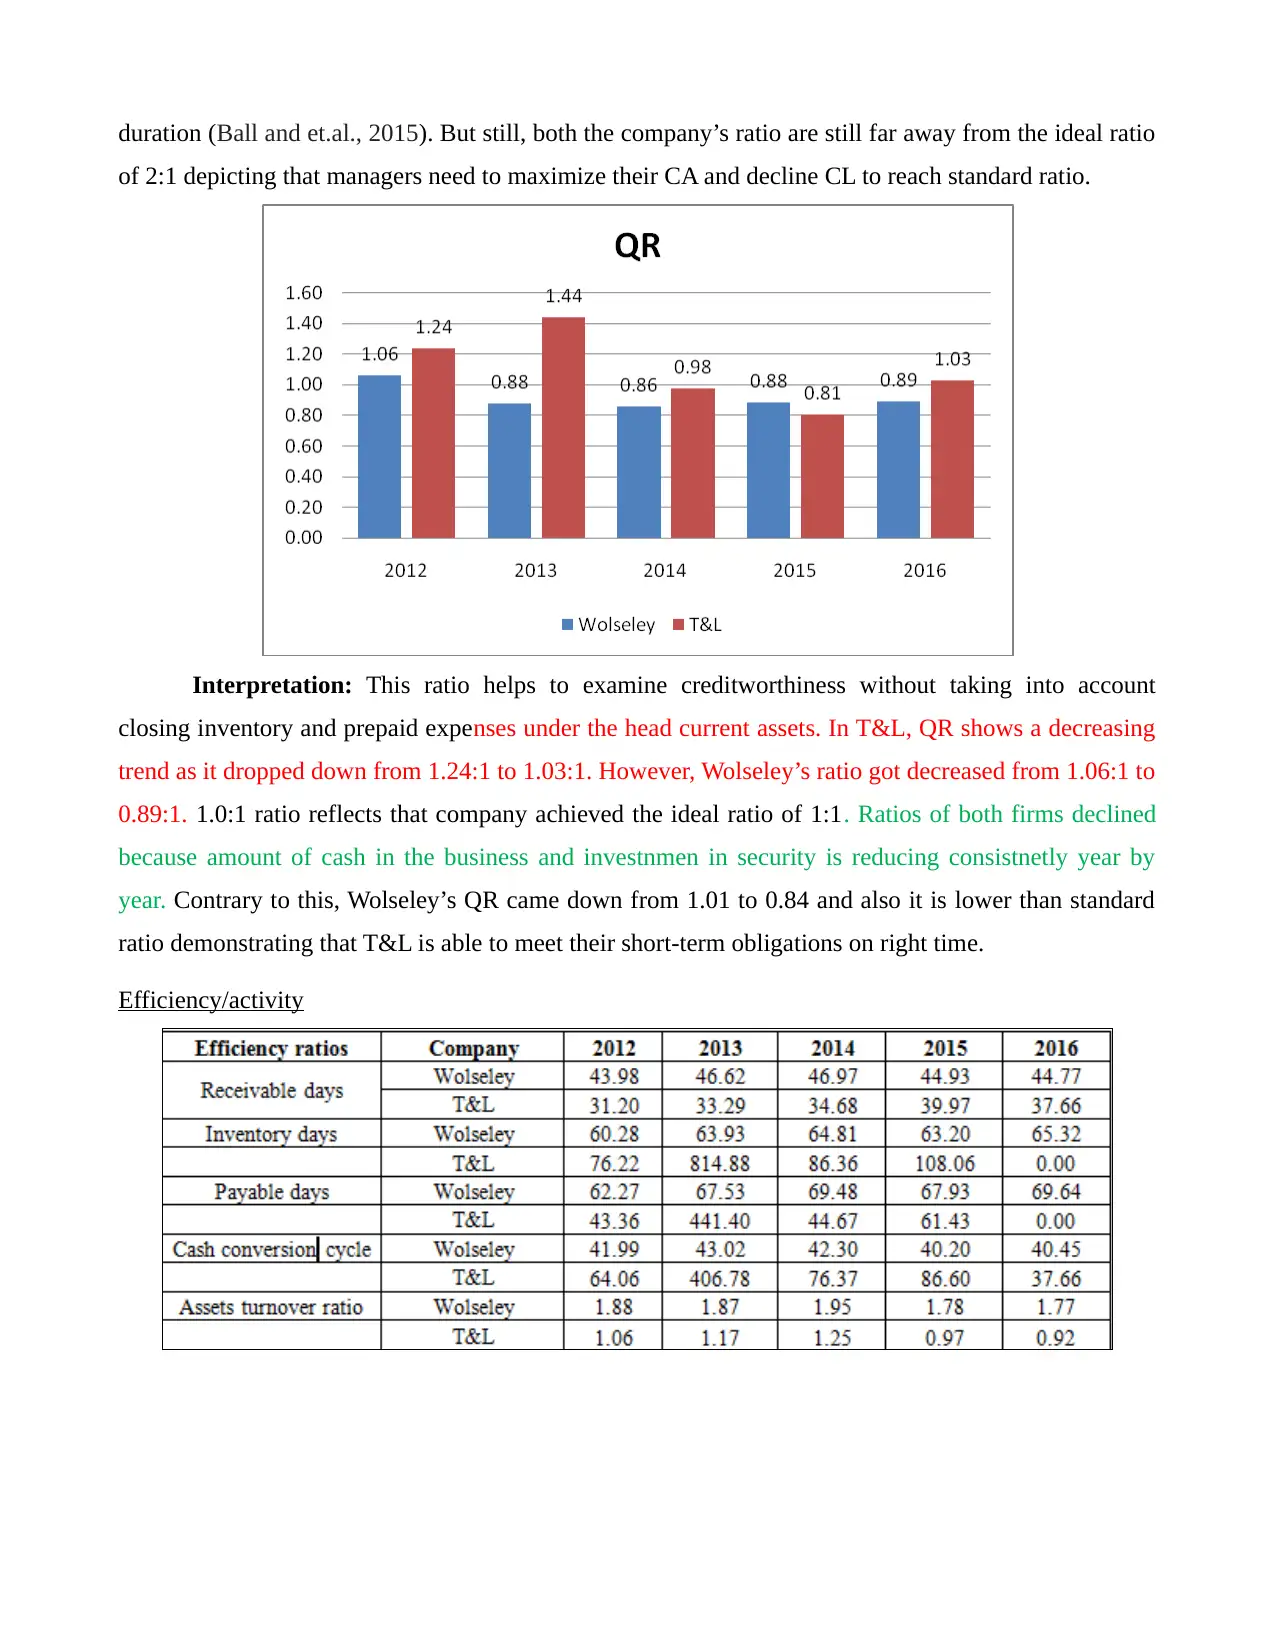
duration (Ball and et.al., 2015). But still, both the company’s ratio are still far away from the ideal ratio
of 2:1 depicting that managers need to maximize their CA and decline CL to reach standard ratio.
Interpretation: This ratio helps to examine creditworthiness without taking into account
closing inventory and prepaid expenses under the head current assets. In T&L, QR shows a decreasing
trend as it dropped down from 1.24:1 to 1.03:1. However, Wolseley’s ratio got decreased from 1.06:1 to
0.89:1. 1.0:1 ratio reflects that company achieved the ideal ratio of 1:1. Ratios of both firms declined
because amount of cash in the business and investnmen in security is reducing consistnetly year by
year. Contrary to this, Wolseley’s QR came down from 1.01 to 0.84 and also it is lower than standard
ratio demonstrating that T&L is able to meet their short-term obligations on right time.
Efficiency/activity
⊘ This is a preview!⊘
Do you want full access?
Subscribe today to unlock all pages.
Trusted by 1+ million students worldwide
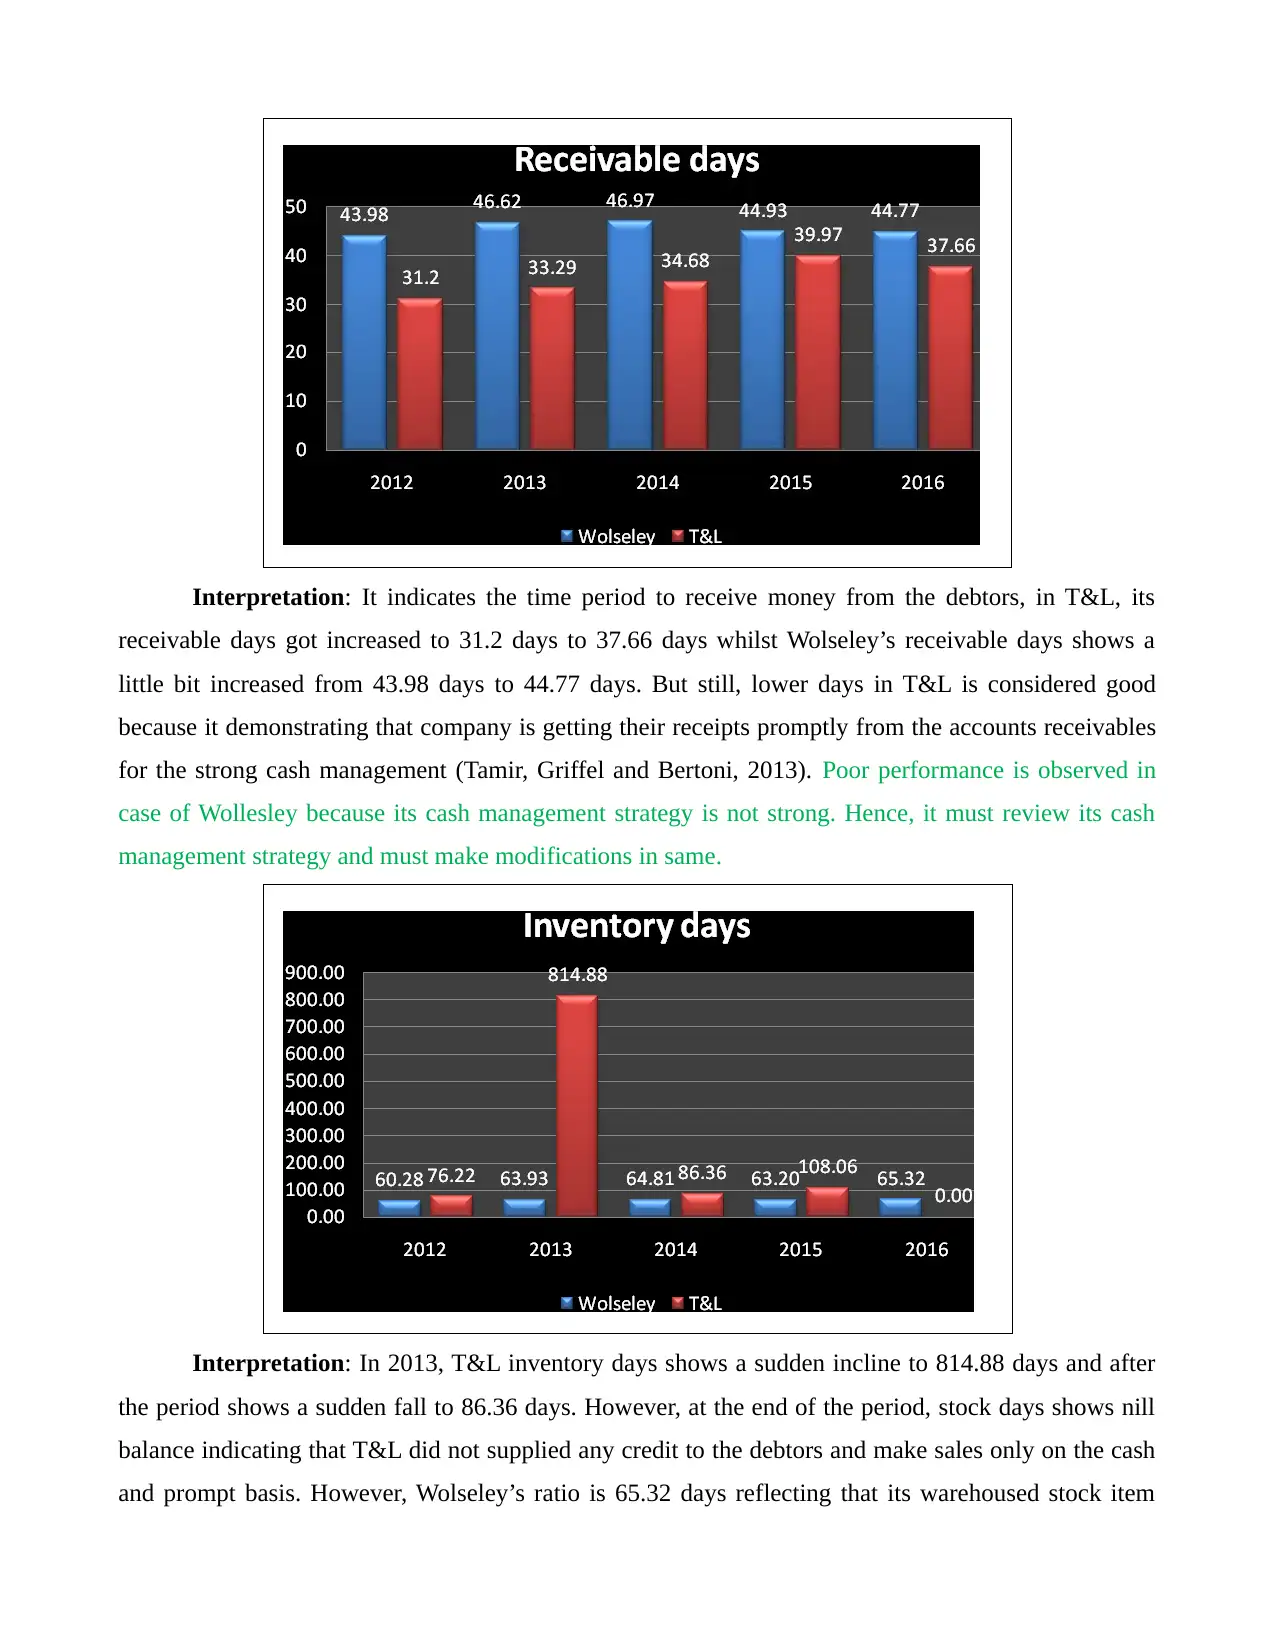
Interpretation: It indicates the time period to receive money from the debtors, in T&L, its
receivable days got increased to 31.2 days to 37.66 days whilst Wolseley’s receivable days shows a
little bit increased from 43.98 days to 44.77 days. But still, lower days in T&L is considered good
because it demonstrating that company is getting their receipts promptly from the accounts receivables
for the strong cash management (Tamir, Griffel and Bertoni, 2013). Poor performance is observed in
case of Wollesley because its cash management strategy is not strong. Hence, it must review its cash
management strategy and must make modifications in same.
Interpretation: In 2013, T&L inventory days shows a sudden incline to 814.88 days and after
the period shows a sudden fall to 86.36 days. However, at the end of the period, stock days shows nill
balance indicating that T&L did not supplied any credit to the debtors and make sales only on the cash
and prompt basis. However, Wolseley’s ratio is 65.32 days reflecting that its warehoused stock item
Paraphrase This Document
Need a fresh take? Get an instant paraphrase of this document with our AI Paraphraser
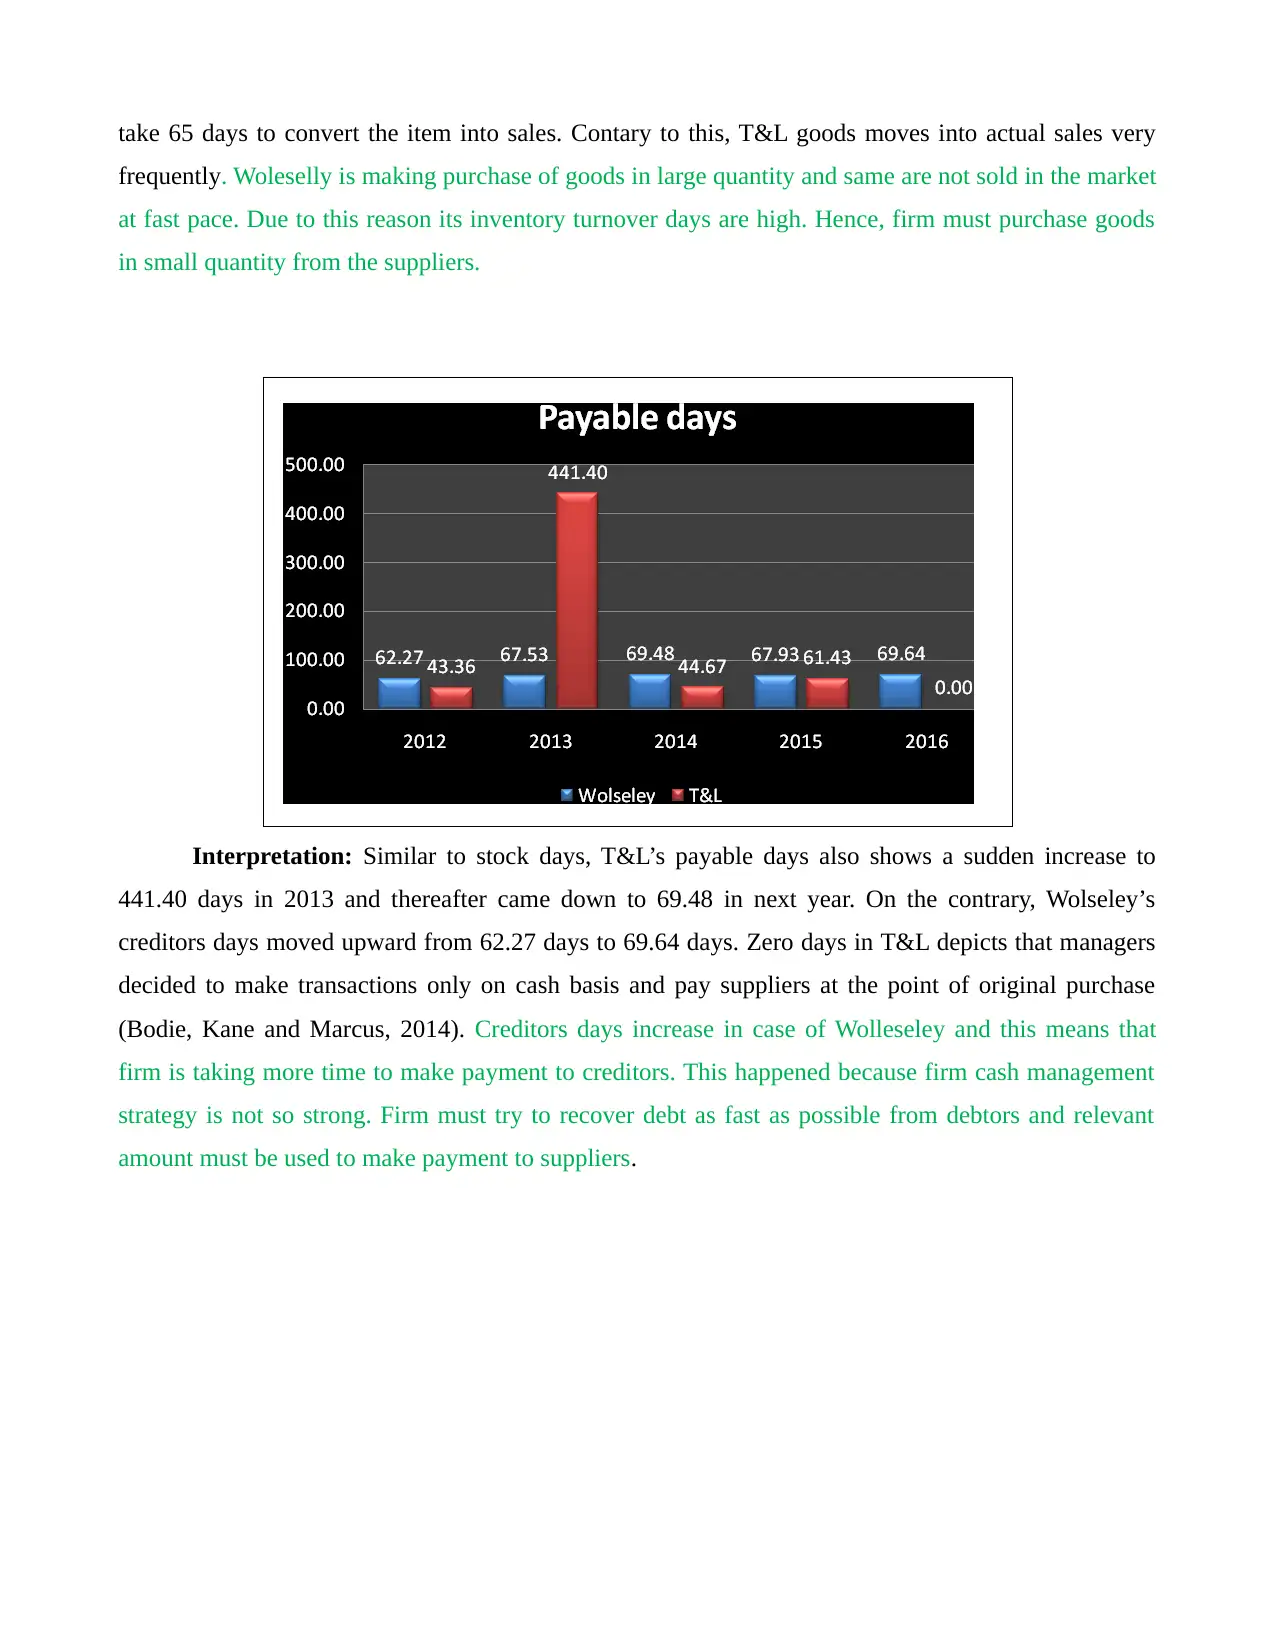
take 65 days to convert the item into sales. Contary to this, T&L goods moves into actual sales very
frequently. Woleselly is making purchase of goods in large quantity and same are not sold in the market
at fast pace. Due to this reason its inventory turnover days are high. Hence, firm must purchase goods
in small quantity from the suppliers.
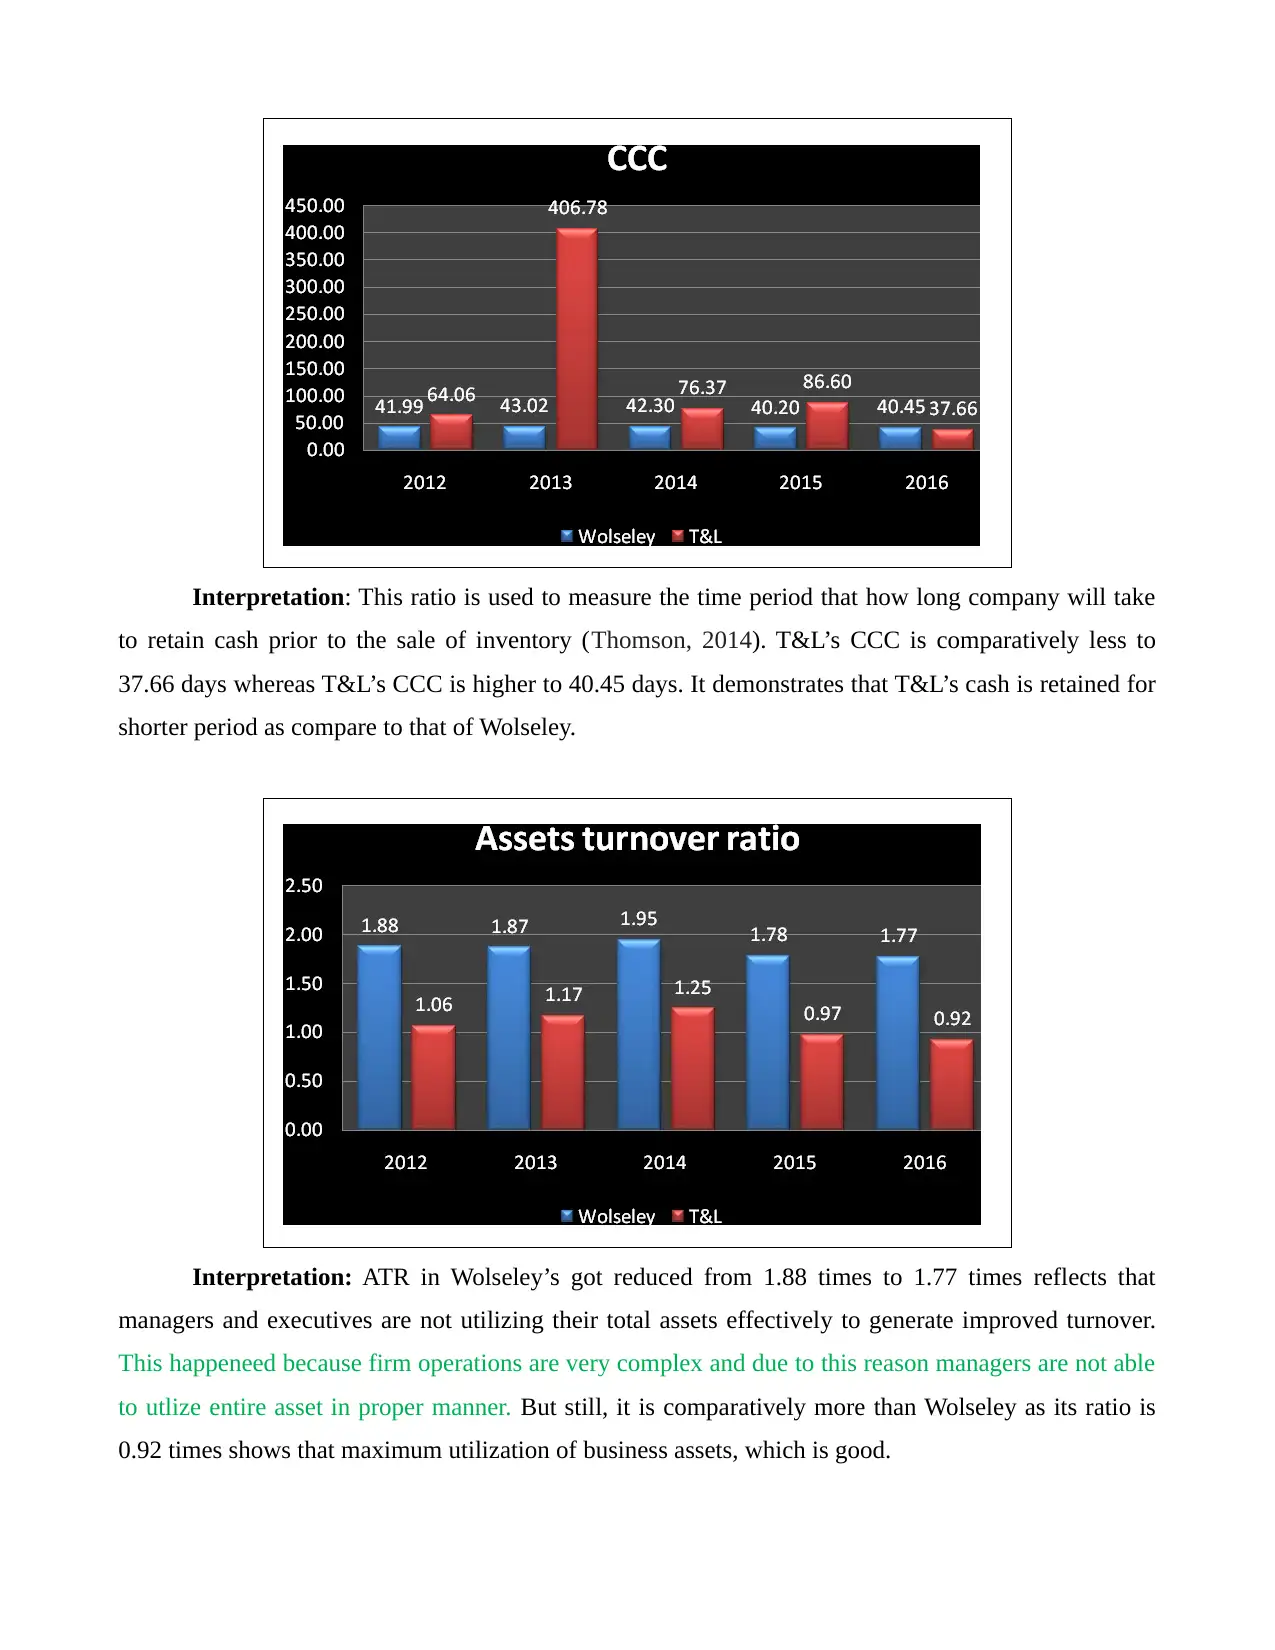
Interpretation: Similar to stock days, T&L’s payable days also shows a sudden increase to
441.40 days in 2013 and thereafter came down to 69.48 in next year. On the contrary, Wolseley’s
creditors days moved upward from 62.27 days to 69.64 days. Zero days in T&L depicts that managers
decided to make transactions only on cash basis and pay suppliers at the point of original purchase
(Bodie, Kane and Marcus, 2014). Creditors days increase in case of Wolleseley and this means that
firm is taking more time to make payment to creditors. This happened because firm cash management
strategy is not so strong. Firm must try to recover debt as fast as possible from debtors and relevant
amount must be used to make payment to suppliers.
frequently. Woleselly is making purchase of goods in large quantity and same are not sold in the market
at fast pace. Due to this reason its inventory turnover days are high. Hence, firm must purchase goods
in small quantity from the suppliers.
Interpretation: Similar to stock days, T&L’s payable days also shows a sudden increase to
441.40 days in 2013 and thereafter came down to 69.48 in next year. On the contrary, Wolseley’s
creditors days moved upward from 62.27 days to 69.64 days. Zero days in T&L depicts that managers
decided to make transactions only on cash basis and pay suppliers at the point of original purchase
(Bodie, Kane and Marcus, 2014). Creditors days increase in case of Wolleseley and this means that
firm is taking more time to make payment to creditors. This happened because firm cash management
strategy is not so strong. Firm must try to recover debt as fast as possible from debtors and relevant
amount must be used to make payment to suppliers.
Interpretation: This ratio is used to measure the time period that how long company will take
to retain cash prior to the sale of inventory (Thomson, 2014). T&L’s CCC is comparatively less to
37.66 days whereas T&L’s CCC is higher to 40.45 days. It demonstrates that T&L’s cash is retained for
shorter period as compare to that of Wolseley.
Interpretation: ATR in Wolseley’s got reduced from 1.88 times to 1.77 times reflects that
managers and executives are not utilizing their total assets effectively to generate improved turnover.
This happeneed because firm operations are very complex and due to this reason managers are not able
to utlize entire asset in proper manner. But still, it is comparatively more than Wolseley as its ratio is
0.92 times shows that maximum utilization of business assets, which is good.
⊘ This is a preview!⊘
Do you want full access?
Subscribe today to unlock all pages.
Trusted by 1+ million students worldwide
1 out of 32
Related Documents


Your All-in-One AI-Powered Toolkit for Academic Success.
+13062052269
info@desklib.com
Available 24*7 on WhatsApp / Email
![[object Object]](/_next/static/media/star-bottom.7253800d.svg)
Unlock your academic potential
Copyright © 2020–2026 A2Z Services. All Rights Reserved. Developed and managed by ZUCOL.