Strategic Financial Analysis Report
VerifiedAdded on 2020/01/28
|36
|5153
|120
Report
AI Summary
This report provides a detailed strategic financial analysis of two companies, Wolseley and Booker. It employs various analytical techniques, including ratio analysis (profitability, liquidity, efficiency, solvency, and investor ratios), horizontal analysis, vertical analysis, and the DuPont model. The analysis covers multiple years of financial statements (income statement, balance sheet, and cash flow statement) for both companies. The report interprets the results of each analysis, comparing the performance of Wolseley and Booker. Furthermore, it discusses the advantages and disadvantages of each analytical method used. Contemporary methods such as the CAPM model, efficient market hypothesis, and economic value added (EVA) are also briefly introduced. The report concludes with recommendations for improving the financial performance of Booker based on the findings of the analysis.

STRATEGIC FINANCIAL
ANALYSIS
ANALYSIS
Paraphrase This Document
Need a fresh take? Get an instant paraphrase of this document with our AI Paraphraser
TABLE OF CONTENTS
INTRODUCTION...........................................................................................................................1
Strategic financial analysis and its importance......................................................................1
Objectives...............................................................................................................................1
Overview of companies..........................................................................................................1
Methods of analysis................................................................................................................1
RATIO ANALYSIS.........................................................................................................................1
Profitability Ratios..................................................................................................................2
Liquidity Ratios......................................................................................................................6
Efficiency ratios......................................................................................................................8
Solvency ratio.......................................................................................................................12
Investor ratio.........................................................................................................................13
COMMON –SIZE..........................................................................................................................15
Horizontal.............................................................................................................................15
Vertical analysis...................................................................................................................16
Du-Pont.................................................................................................................................16
Segmental revenues..............................................................................................................17
ADVANTAGE AND DISADVANTAGE....................................................................................17
Ratio analysis........................................................................................................................17
Du-Pont.................................................................................................................................18
Segmental.............................................................................................................................18
CONCLUSION & RECOMMENDATIONS................................................................................18
Conclusion............................................................................................................................18
Recommendation..................................................................................................................19
CONTEMPROARY METHODS..................................................................................................19
CAPM model........................................................................................................................19
Efficient market hypothesis..................................................................................................19
Economic value added (EVA)..............................................................................................20
REFERENCES..............................................................................................................................21
APPENDIX....................................................................................................................................23
Wolseley’s ratio analysis......................................................................................................23
Booker’s ratio analysis.........................................................................................................24
Wolseley’s vertical analysis of income statement................................................................25
Wolseley’s vertical analysis of balance sheet......................................................................25
Wolseley’s vertical analysis of cash flow statement............................................................27
Booker’s vertical analysis of income statement...................................................................27
Booker’s vertical analysis of balance sheet..........................................................................28
Booker’s vertical analysis of statement of cash flows..........................................................29
Wolseley’s horizontal analysis of statement of income statement.......................................30
Wolseley’s horizontal analysis of statement of balance sheet..............................................30
Wolseley’s horizontal analysis of statement of cash flows..................................................31
Booker’s horizontal analysis of income statement...............................................................31
Booker’s horizontal analysis of balance sheet......................................................................32
Booker’s horizontal analysis of statement of cash flows.....................................................33
⊘ This is a preview!⊘
Do you want full access?
Subscribe today to unlock all pages.
Trusted by 1+ million students worldwide
INTRODUCTION
Strategic financial analysis and its importance
Strategic financial analysis (SFA) regards to the process of analyzing business financial
performance and thereby makes right decisions at the right time to drive success. There are
number of tools and techniques available to the entrepreneur such as ratio analysis, horizontal
and vertical analysis and many others. SFA is of utmost importance for the manager to determine
and assess their financial difficulties, so that, managers, directors and executives can make
qualitative decisions for accomplishing the defined targets and objectives.
Objectives
The report targeted at analysing the financial position and operational performance of two
existing companies, Wolseley and Booker. The report will make financial analysis of both the
companies by applying ratio analysis and horizontal as well as vertical analysis of all the
necessary financial accounts profitability statement, cash flow statement and balance sheet.
Moreover, it will also analyse the limitations of all the methods. Besides this, contemporary
techniques like Capital Assets pricing Model, Efficient Market Hypothesis and Economic Value
Added will be analysed that how these techniques can assist business to examine and evaluate
their success and operational excellence.
Overview of companies
Booker group is operating in food sector that offers variety of products and services to
buyers including grocers, restaurants and pub etc. Another organization is Wolseley deals in the
construction of buildings.
Methods of analysis
Ratio analysis will be used to determine relationship between various elements of
financial statement. However, horizontal analysis will be used to examine volatility trend over
the years whereas vertical analysis technique will be incorporated to determine the relationship
of each and every element from the revenues and total assets. Besides this, Du-pont model and
segmental reports will be prepared for in-depth analysis of business performance.
RATIO ANALYSIS
Ratio analysis may be defined as a tool which helps in analyzing the financial statements
of the business organization in an effectual way. By this, financial health, performance and
position of the firm can be measured in against to the competitor. Besides this, by evaluating the
1
Paraphrase This Document
Need a fresh take? Get an instant paraphrase of this document with our AI Paraphraser
own performance in against to the competitors business unit can take suitable decision for the
improvement purposs (Xu and et.al., 2014). The ratio analysis includes different types of ratios
by which analyser can interpret about the financial position of company. The different ratios are
such as Profitability, liquidity, efficiency, solvency, gearing etc.
Profitability Ratios
Profitability ratios: This ratio helps in analyzing the profit margin generated by the firm
during the time frame over the expenses (Boer 2011). Hence, by making analysis of such ratio
business unit can take significant action or measure for enhancing the profit level.
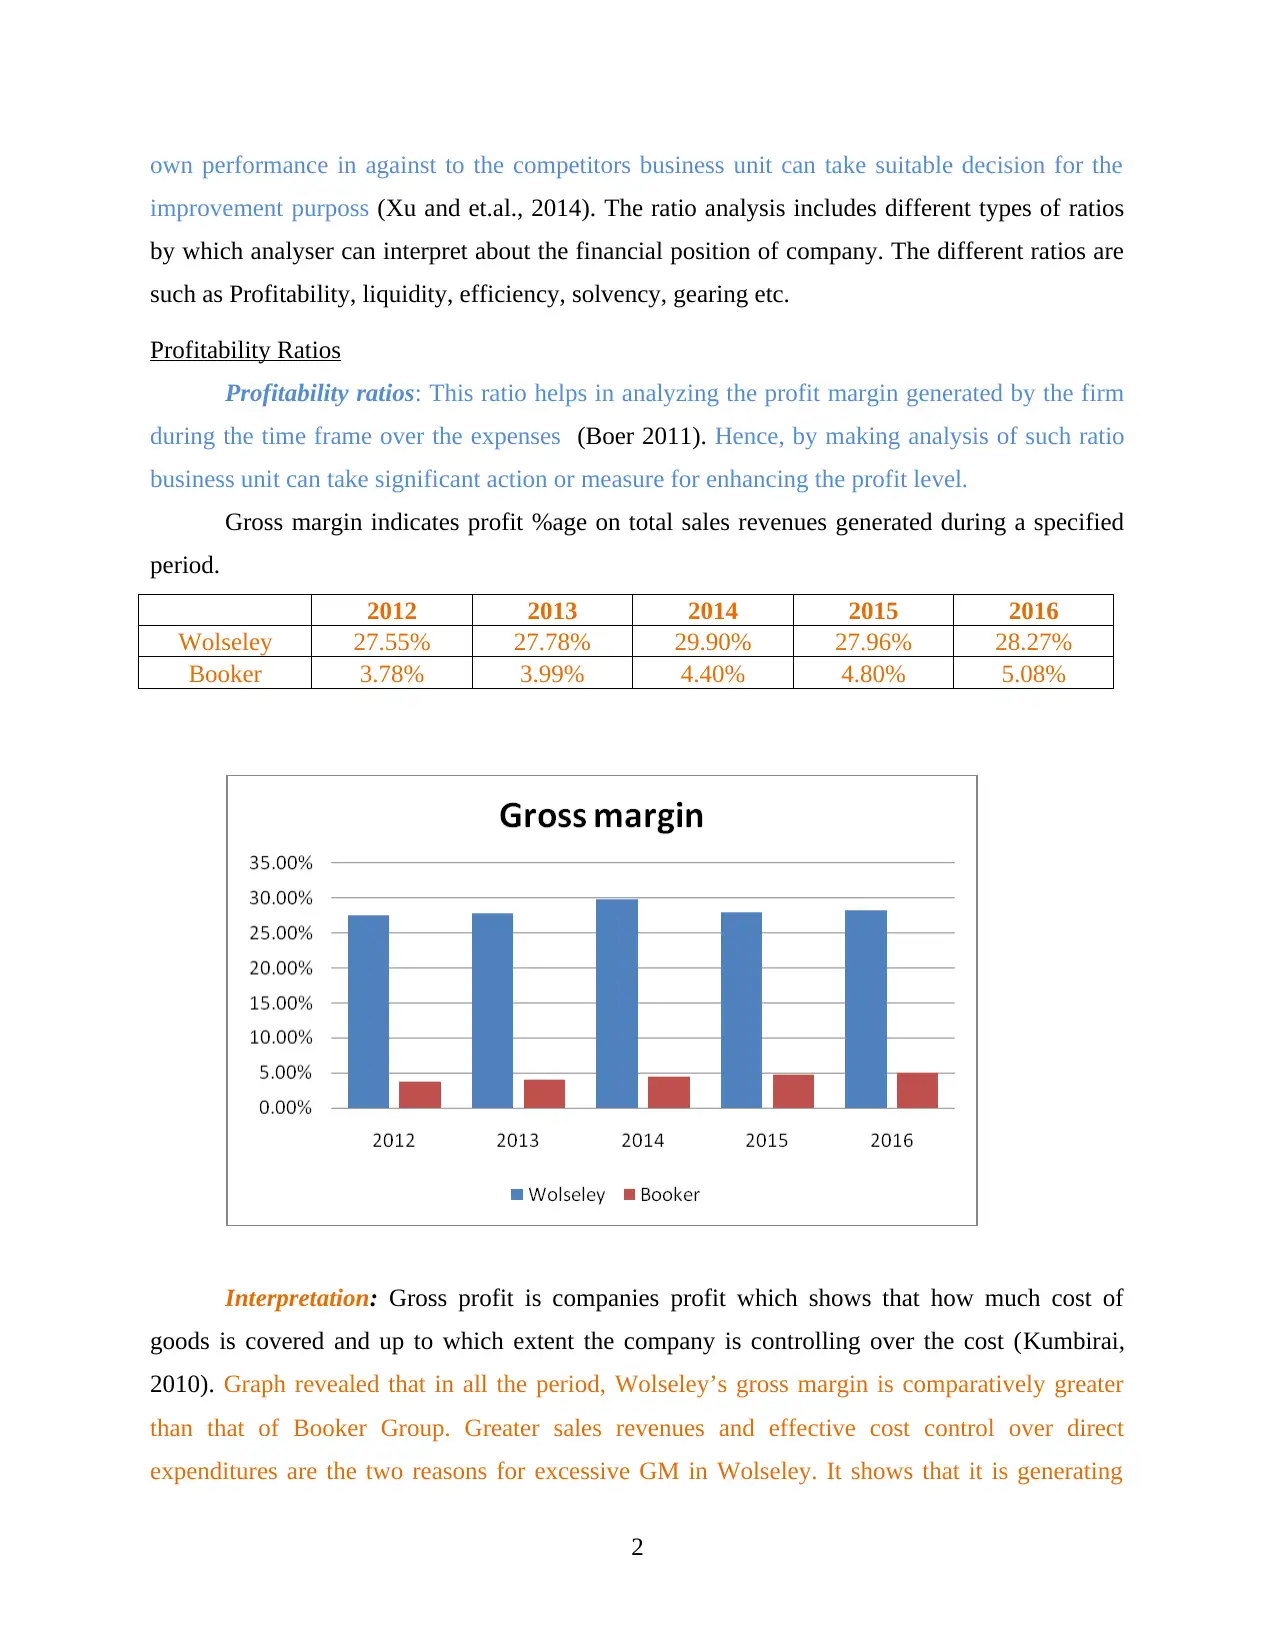
Gross margin indicates profit %age on total sales revenues generated during a specified
period.
2012 2013 2014 2015 2016
Wolseley 27.55% 27.78% 29.90% 27.96% 28.27%
Booker 3.78% 3.99% 4.40% 4.80% 5.08%
Interpretation: Gross profit is companies profit which shows that how much cost of
goods is covered and up to which extent the company is controlling over the cost (Kumbirai,
2010). Graph revealed that in all the period, Wolseley’s gross margin is comparatively greater
than that of Booker Group. Greater sales revenues and effective cost control over direct
expenditures are the two reasons for excessive GM in Wolseley. It shows that it is generating
2
improvement purposs (Xu and et.al., 2014). The ratio analysis includes different types of ratios
by which analyser can interpret about the financial position of company. The different ratios are
such as Profitability, liquidity, efficiency, solvency, gearing etc.
Profitability Ratios
Profitability ratios: This ratio helps in analyzing the profit margin generated by the firm
during the time frame over the expenses (Boer 2011). Hence, by making analysis of such ratio
business unit can take significant action or measure for enhancing the profit level.
Gross margin indicates profit %age on total sales revenues generated during a specified
period.
2012 2013 2014 2015 2016
Wolseley 27.55% 27.78% 29.90% 27.96% 28.27%
Booker 3.78% 3.99% 4.40% 4.80% 5.08%
Interpretation: Gross profit is companies profit which shows that how much cost of
goods is covered and up to which extent the company is controlling over the cost (Kumbirai,
2010). Graph revealed that in all the period, Wolseley’s gross margin is comparatively greater
than that of Booker Group. Greater sales revenues and effective cost control over direct
expenditures are the two reasons for excessive GM in Wolseley. It shows that it is generating
2
enough return on their turnover and performing excellent than Booker. In the year 2016,
Wolseley’s GM is 28.27% whilst in case of Booker, it is only 5.08% represent that first company
is performing better as it is generating higher return through adding a mark-up on cost of sale.
Thus, business unit needs to make effort in relation to enhancing the sales level through the
means of advertisement.
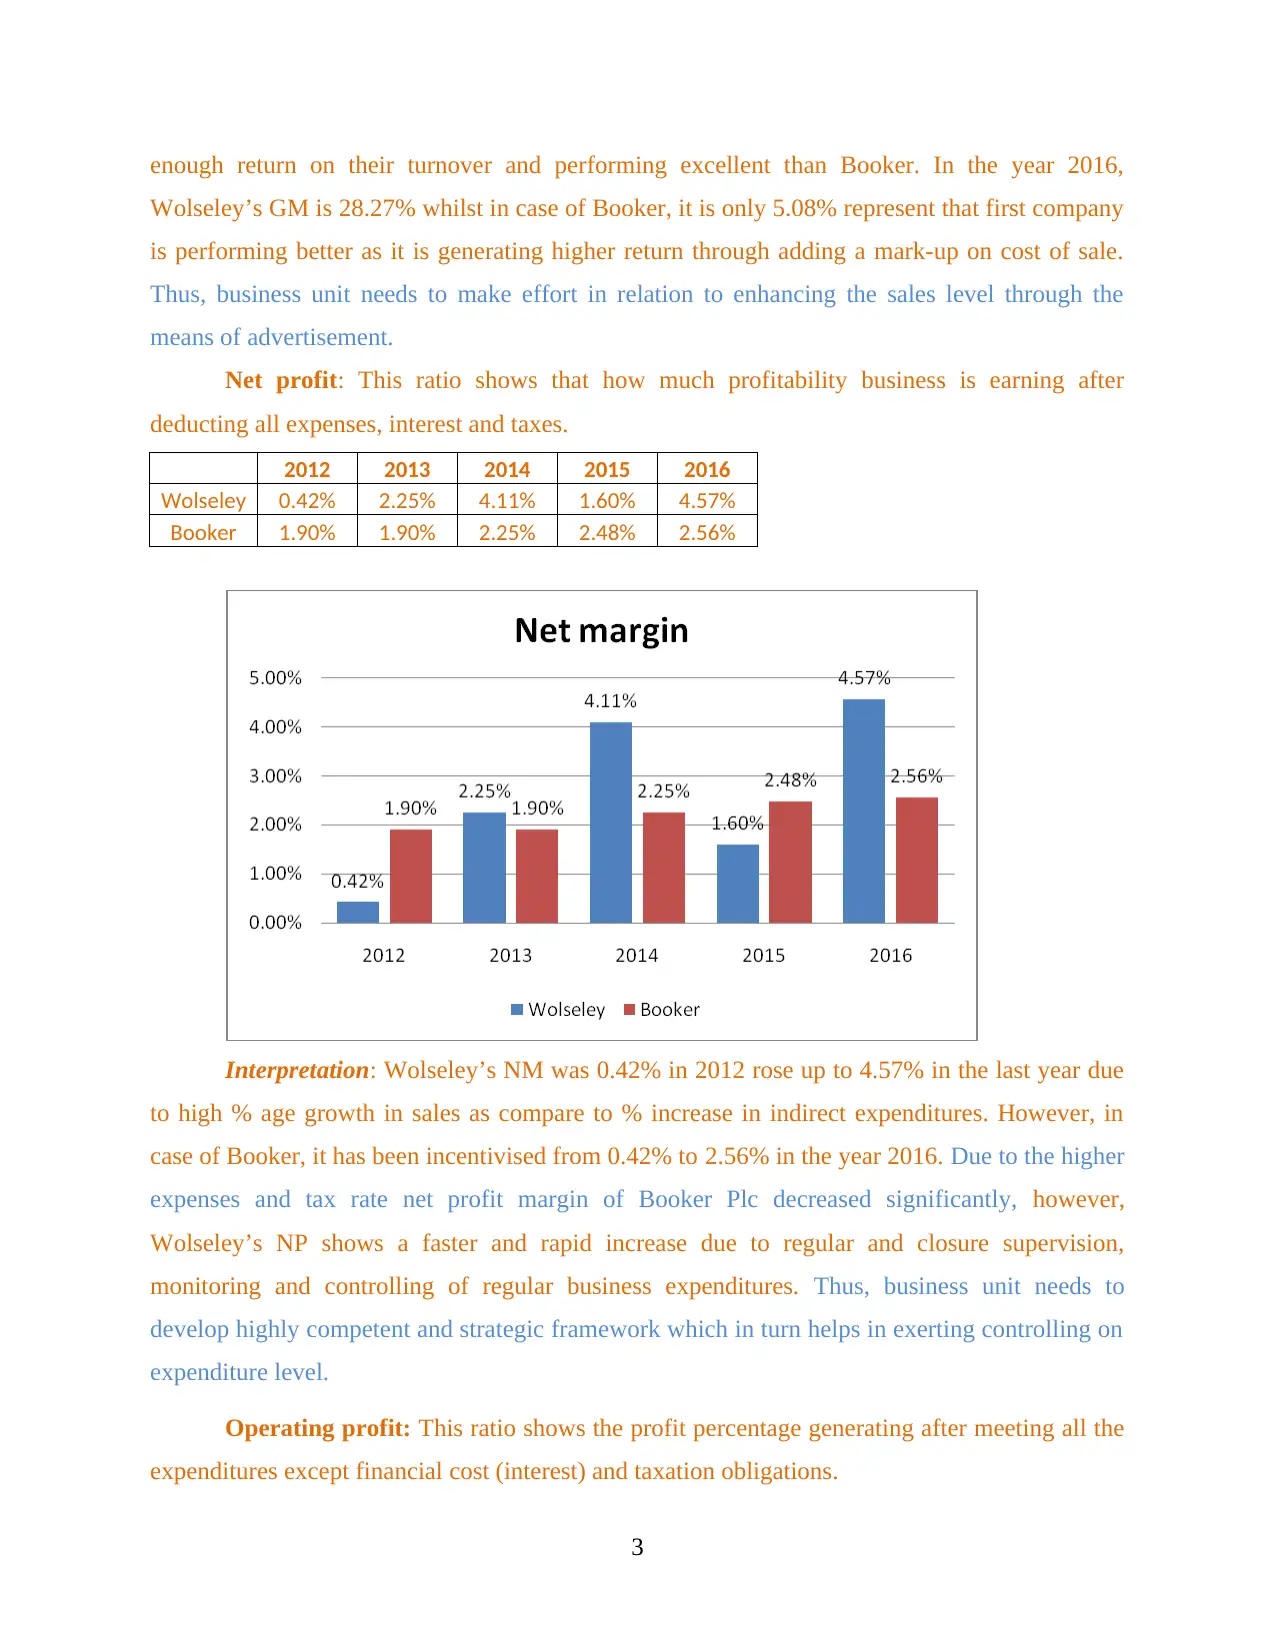
Net profit: This ratio shows that how much profitability business is earning after
deducting all expenses, interest and taxes.
2012 2013 2014 2015 2016
Wolseley 0.42% 2.25% 4.11% 1.60% 4.57%
Booker 1.90% 1.90% 2.25% 2.48% 2.56%
Interpretation: Wolseley’s NM was 0.42% in 2012 rose up to 4.57% in the last year due
to high % age growth in sales as compare to % increase in indirect expenditures. However, in
case of Booker, it has been incentivised from 0.42% to 2.56% in the year 2016. Due to the higher
expenses and tax rate net profit margin of Booker Plc decreased significantly, however,
Wolseley’s NP shows a faster and rapid increase due to regular and closure supervision,
monitoring and controlling of regular business expenditures. Thus, business unit needs to
develop highly competent and strategic framework which in turn helps in exerting controlling on
expenditure level.
Operating profit: This ratio shows the profit percentage generating after meeting all the
expenditures except financial cost (interest) and taxation obligations.
3
Wolseley’s GM is 28.27% whilst in case of Booker, it is only 5.08% represent that first company
is performing better as it is generating higher return through adding a mark-up on cost of sale.
Thus, business unit needs to make effort in relation to enhancing the sales level through the
means of advertisement.
Net profit: This ratio shows that how much profitability business is earning after
deducting all expenses, interest and taxes.
2012 2013 2014 2015 2016
Wolseley 0.42% 2.25% 4.11% 1.60% 4.57%
Booker 1.90% 1.90% 2.25% 2.48% 2.56%
Interpretation: Wolseley’s NM was 0.42% in 2012 rose up to 4.57% in the last year due
to high % age growth in sales as compare to % increase in indirect expenditures. However, in
case of Booker, it has been incentivised from 0.42% to 2.56% in the year 2016. Due to the higher
expenses and tax rate net profit margin of Booker Plc decreased significantly, however,
Wolseley’s NP shows a faster and rapid increase due to regular and closure supervision,
monitoring and controlling of regular business expenditures. Thus, business unit needs to
develop highly competent and strategic framework which in turn helps in exerting controlling on
expenditure level.
Operating profit: This ratio shows the profit percentage generating after meeting all the
expenditures except financial cost (interest) and taxation obligations.
3
⊘ This is a preview!⊘
Do you want full access?
Subscribe today to unlock all pages.
Trusted by 1+ million students worldwide
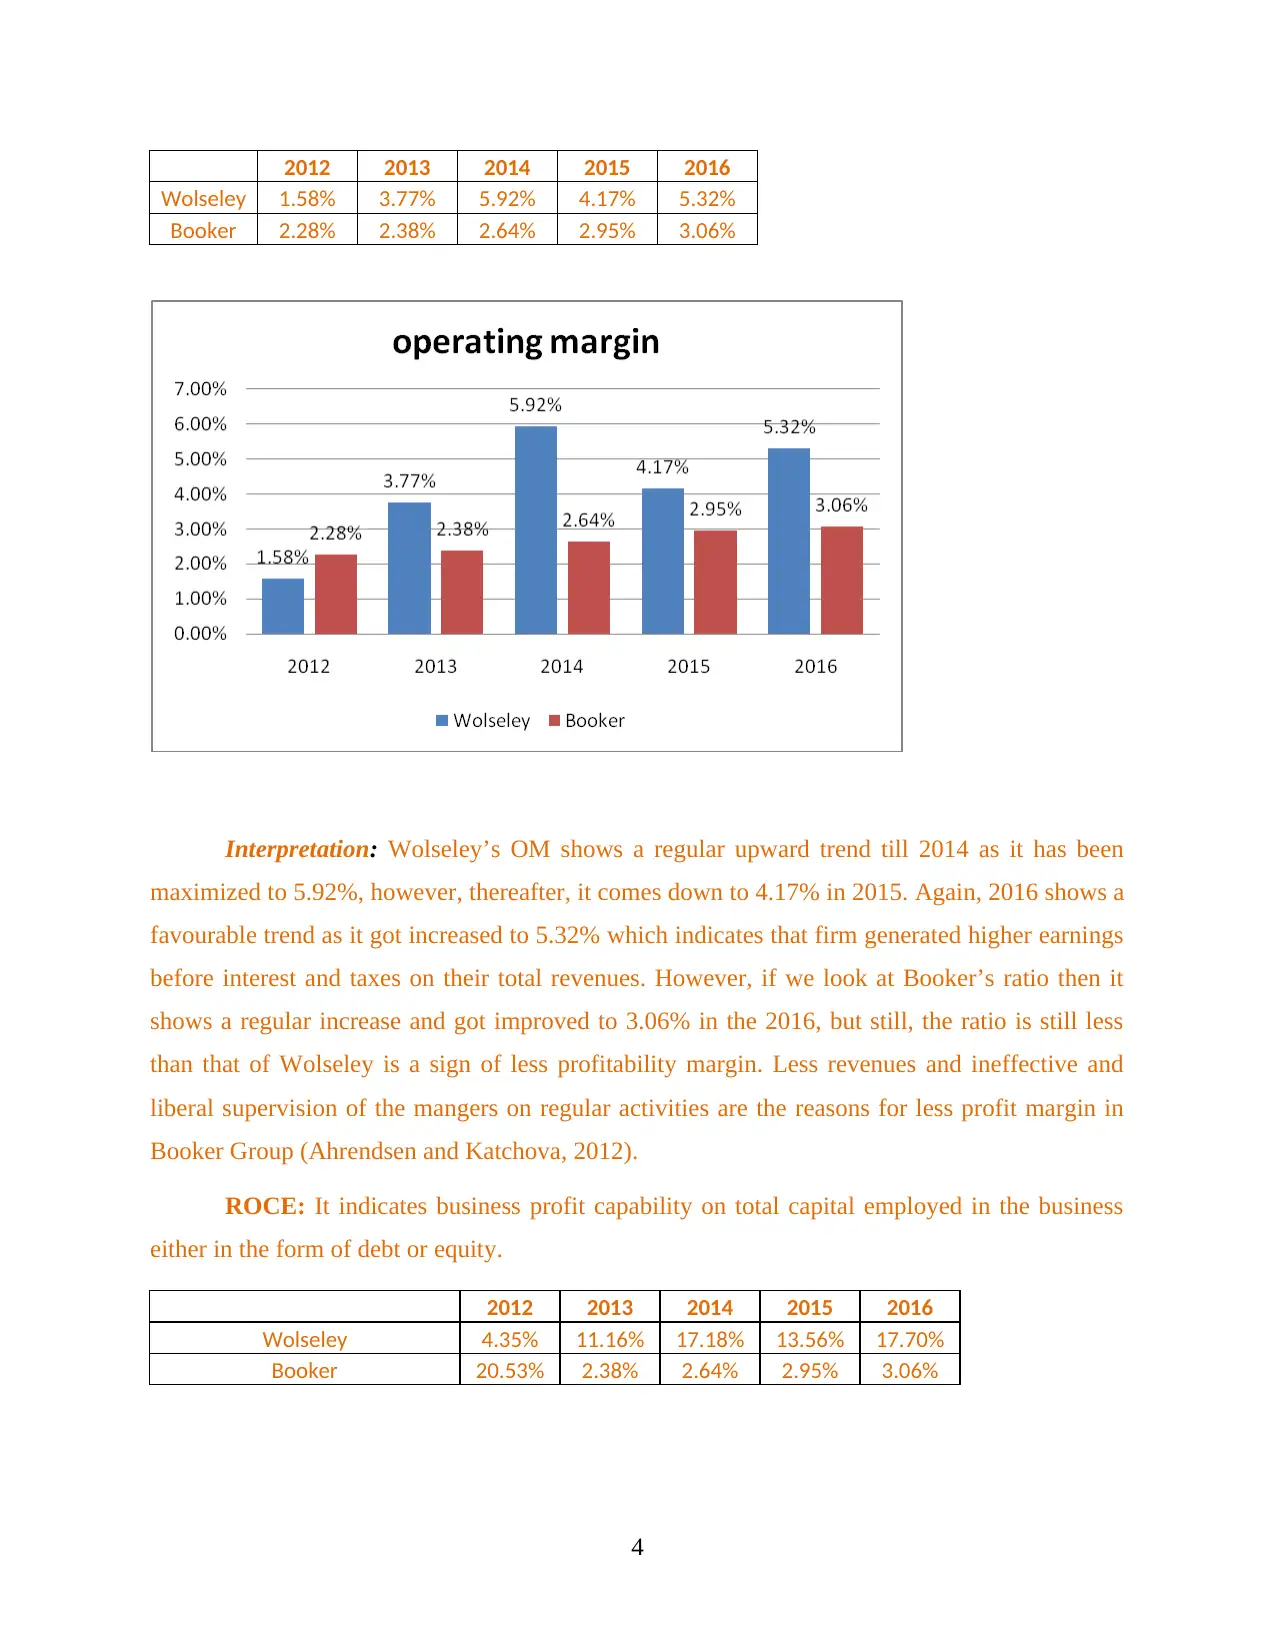
2012 2013 2014 2015 2016
Wolseley 1.58% 3.77% 5.92% 4.17% 5.32%
Booker 2.28% 2.38% 2.64% 2.95% 3.06%
Interpretation: Wolseley’s OM shows a regular upward trend till 2014 as it has been
maximized to 5.92%, however, thereafter, it comes down to 4.17% in 2015. Again, 2016 shows a
favourable trend as it got increased to 5.32% which indicates that firm generated higher earnings
before interest and taxes on their total revenues. However, if we look at Booker’s ratio then it
shows a regular increase and got improved to 3.06% in the 2016, but still, the ratio is still less
than that of Wolseley is a sign of less profitability margin. Less revenues and ineffective and
liberal supervision of the mangers on regular activities are the reasons for less profit margin in
Booker Group (Ahrendsen and Katchova, 2012).
ROCE: It indicates business profit capability on total capital employed in the business
either in the form of debt or equity.
2012 2013 2014 2015 2016
Wolseley 4.35% 11.16% 17.18% 13.56% 17.70%
Booker 20.53% 2.38% 2.64% 2.95% 3.06%
4
Paraphrase This Document
Need a fresh take? Get an instant paraphrase of this document with our AI Paraphraser
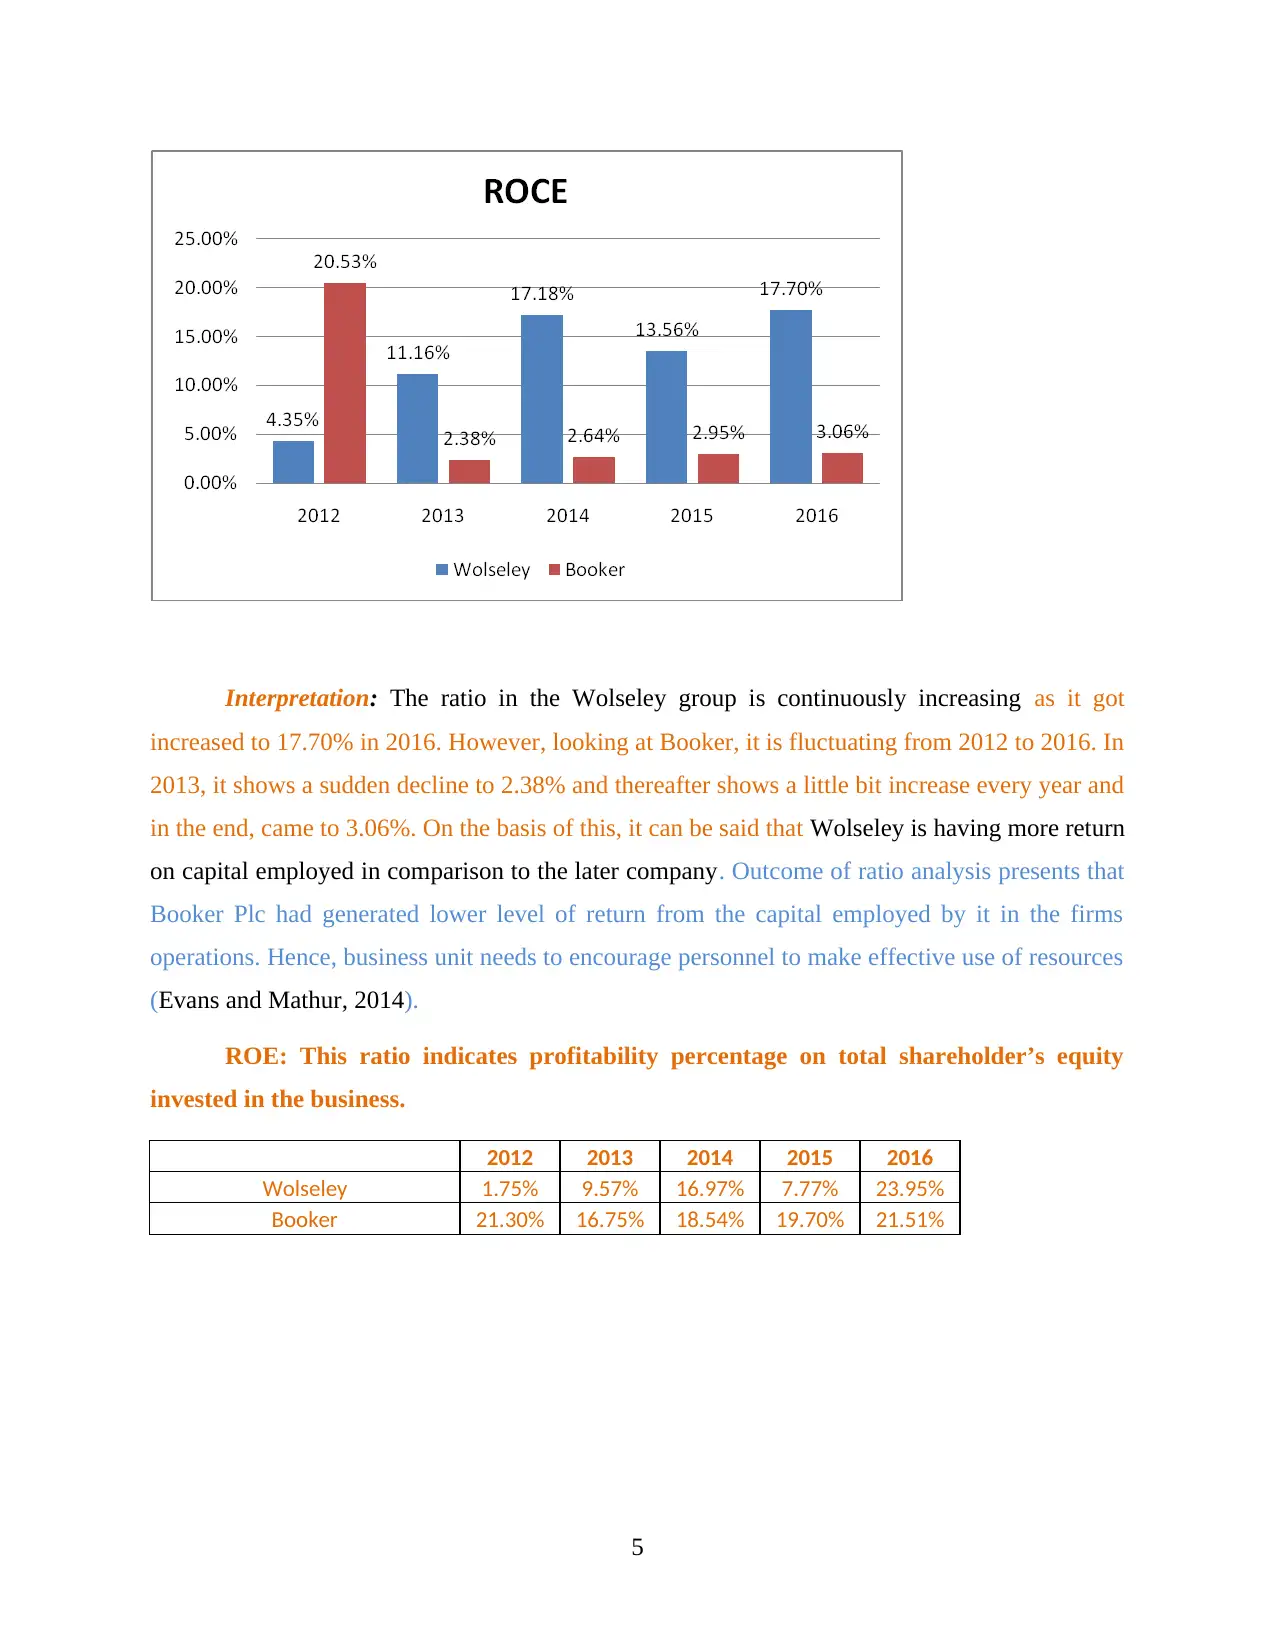
Interpretation: The ratio in the Wolseley group is continuously increasing as it got
increased to 17.70% in 2016. However, looking at Booker, it is fluctuating from 2012 to 2016. In
2013, it shows a sudden decline to 2.38% and thereafter shows a little bit increase every year and
in the end, came to 3.06%. On the basis of this, it can be said that Wolseley is having more return
on capital employed in comparison to the later company. Outcome of ratio analysis presents that
Booker Plc had generated lower level of return from the capital employed by it in the firms
operations. Hence, business unit needs to encourage personnel to make effective use of resources
(Evans and Mathur, 2014).
ROE: This ratio indicates profitability percentage on total shareholder’s equity
invested in the business.
2012 2013 2014 2015 2016
Wolseley 1.75% 9.57% 16.97% 7.77% 23.95%
Booker 21.30% 16.75% 18.54% 19.70% 21.51%
5
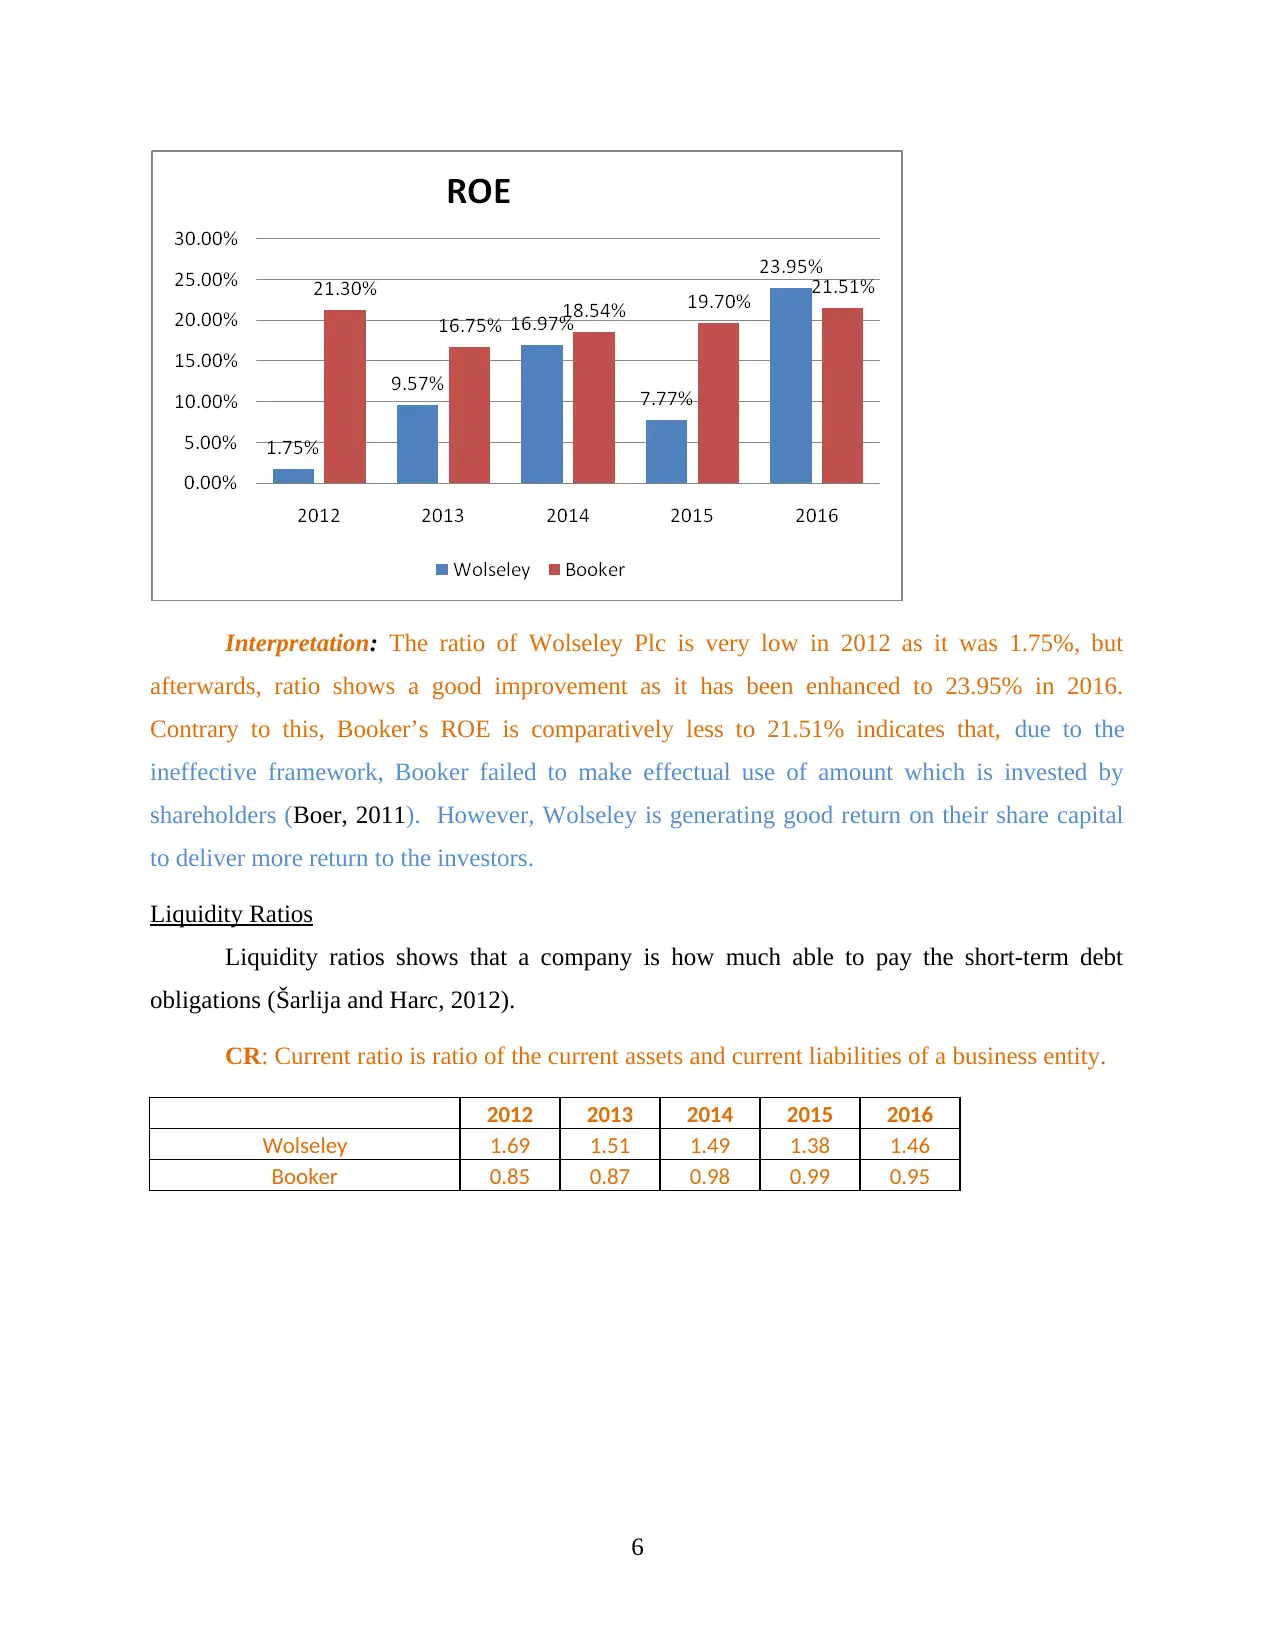
Interpretation: The ratio of Wolseley Plc is very low in 2012 as it was 1.75%, but
afterwards, ratio shows a good improvement as it has been enhanced to 23.95% in 2016.
Contrary to this, Booker’s ROE is comparatively less to 21.51% indicates that, due to the
ineffective framework, Booker failed to make effectual use of amount which is invested by
shareholders (Boer, 2011). However, Wolseley is generating good return on their share capital
to deliver more return to the investors.
Liquidity Ratios
Liquidity ratios shows that a company is how much able to pay the short-term debt
obligations (Šarlija and Harc, 2012).
CR: Current ratio is ratio of the current assets and current liabilities of a business entity.
2012 2013 2014 2015 2016
Wolseley 1.69 1.51 1.49 1.38 1.46
Booker 0.85 0.87 0.98 0.99 0.95
6
⊘ This is a preview!⊘
Do you want full access?
Subscribe today to unlock all pages.
Trusted by 1+ million students worldwide
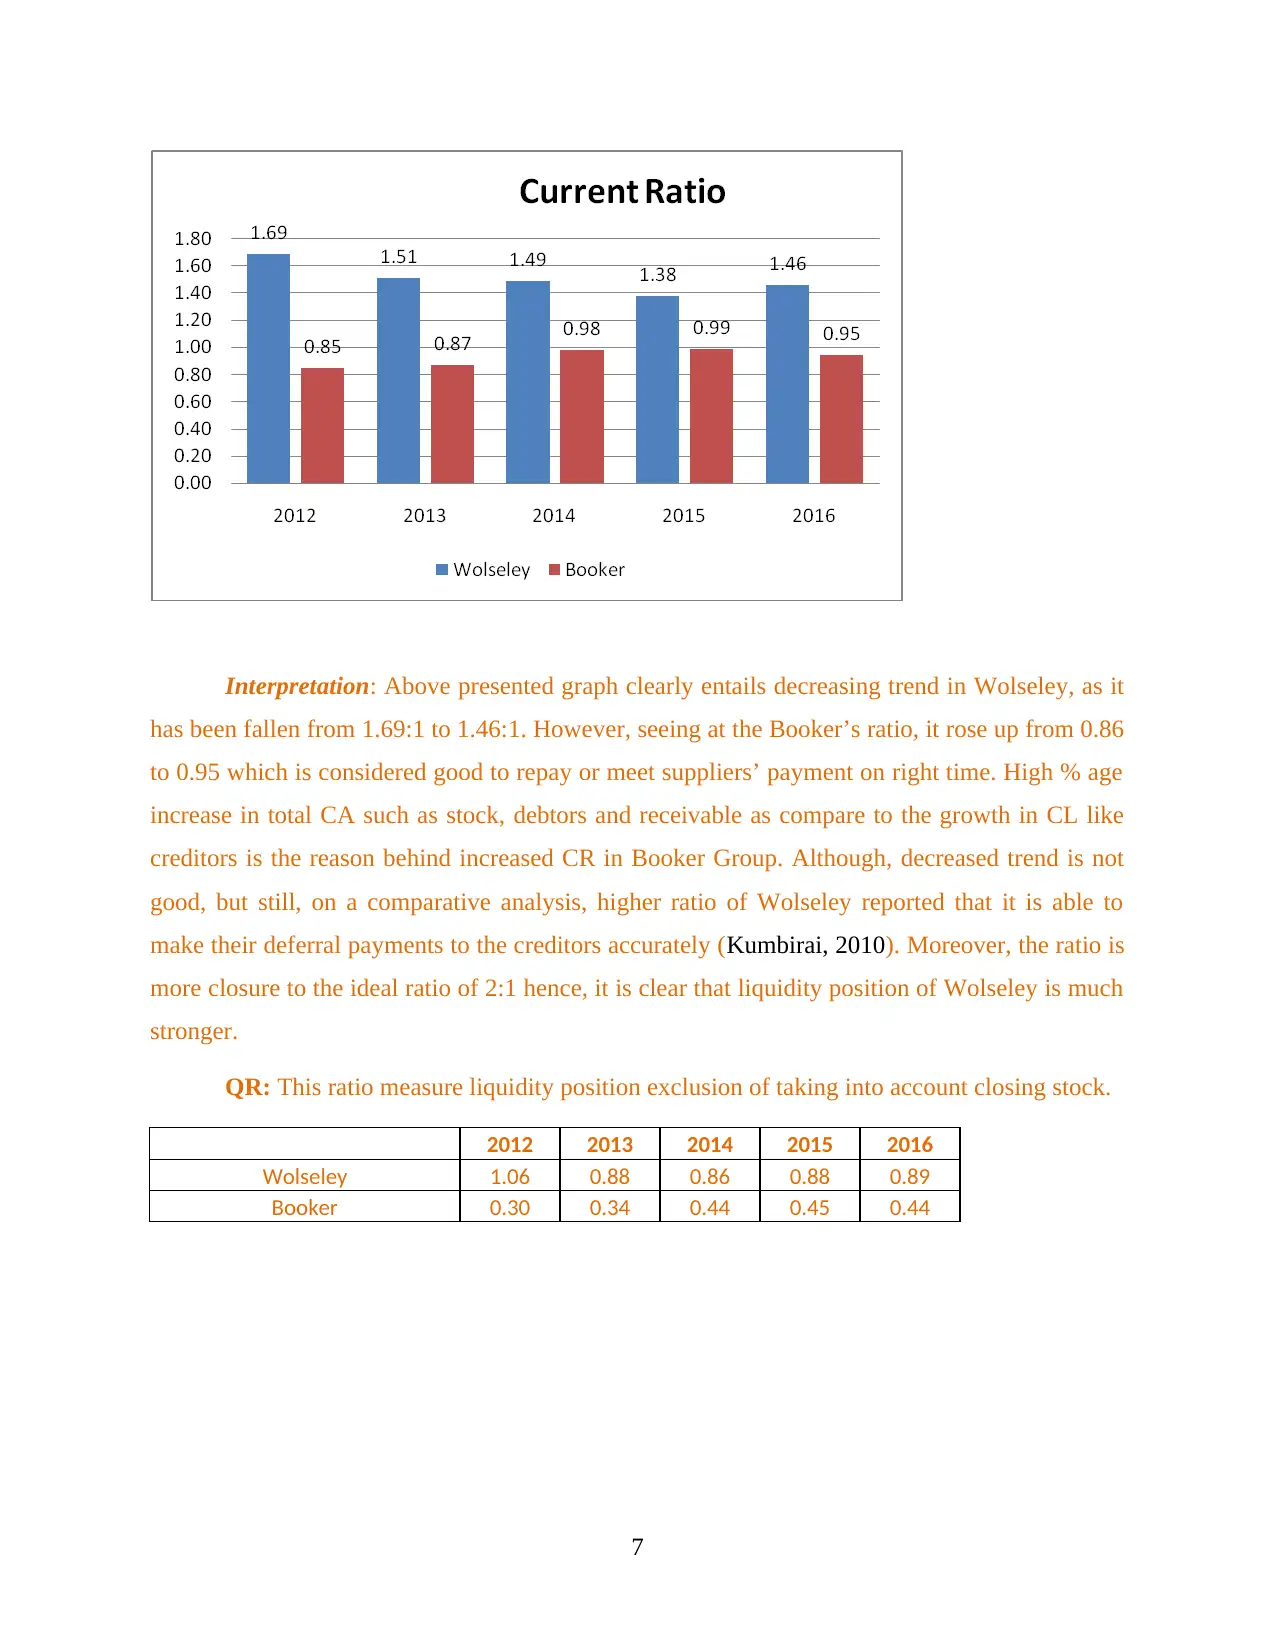
Interpretation: Above presented graph clearly entails decreasing trend in Wolseley, as it
has been fallen from 1.69:1 to 1.46:1. However, seeing at the Booker’s ratio, it rose up from 0.86
to 0.95 which is considered good to repay or meet suppliers’ payment on right time. High % age
increase in total CA such as stock, debtors and receivable as compare to the growth in CL like
creditors is the reason behind increased CR in Booker Group. Although, decreased trend is not
good, but still, on a comparative analysis, higher ratio of Wolseley reported that it is able to
make their deferral payments to the creditors accurately (Kumbirai, 2010). Moreover, the ratio is
more closure to the ideal ratio of 2:1 hence, it is clear that liquidity position of Wolseley is much
stronger.
QR: This ratio measure liquidity position exclusion of taking into account closing stock.
2012 2013 2014 2015 2016
Wolseley 1.06 0.88 0.86 0.88 0.89
Booker 0.30 0.34 0.44 0.45 0.44
7
Paraphrase This Document
Need a fresh take? Get an instant paraphrase of this document with our AI Paraphraser
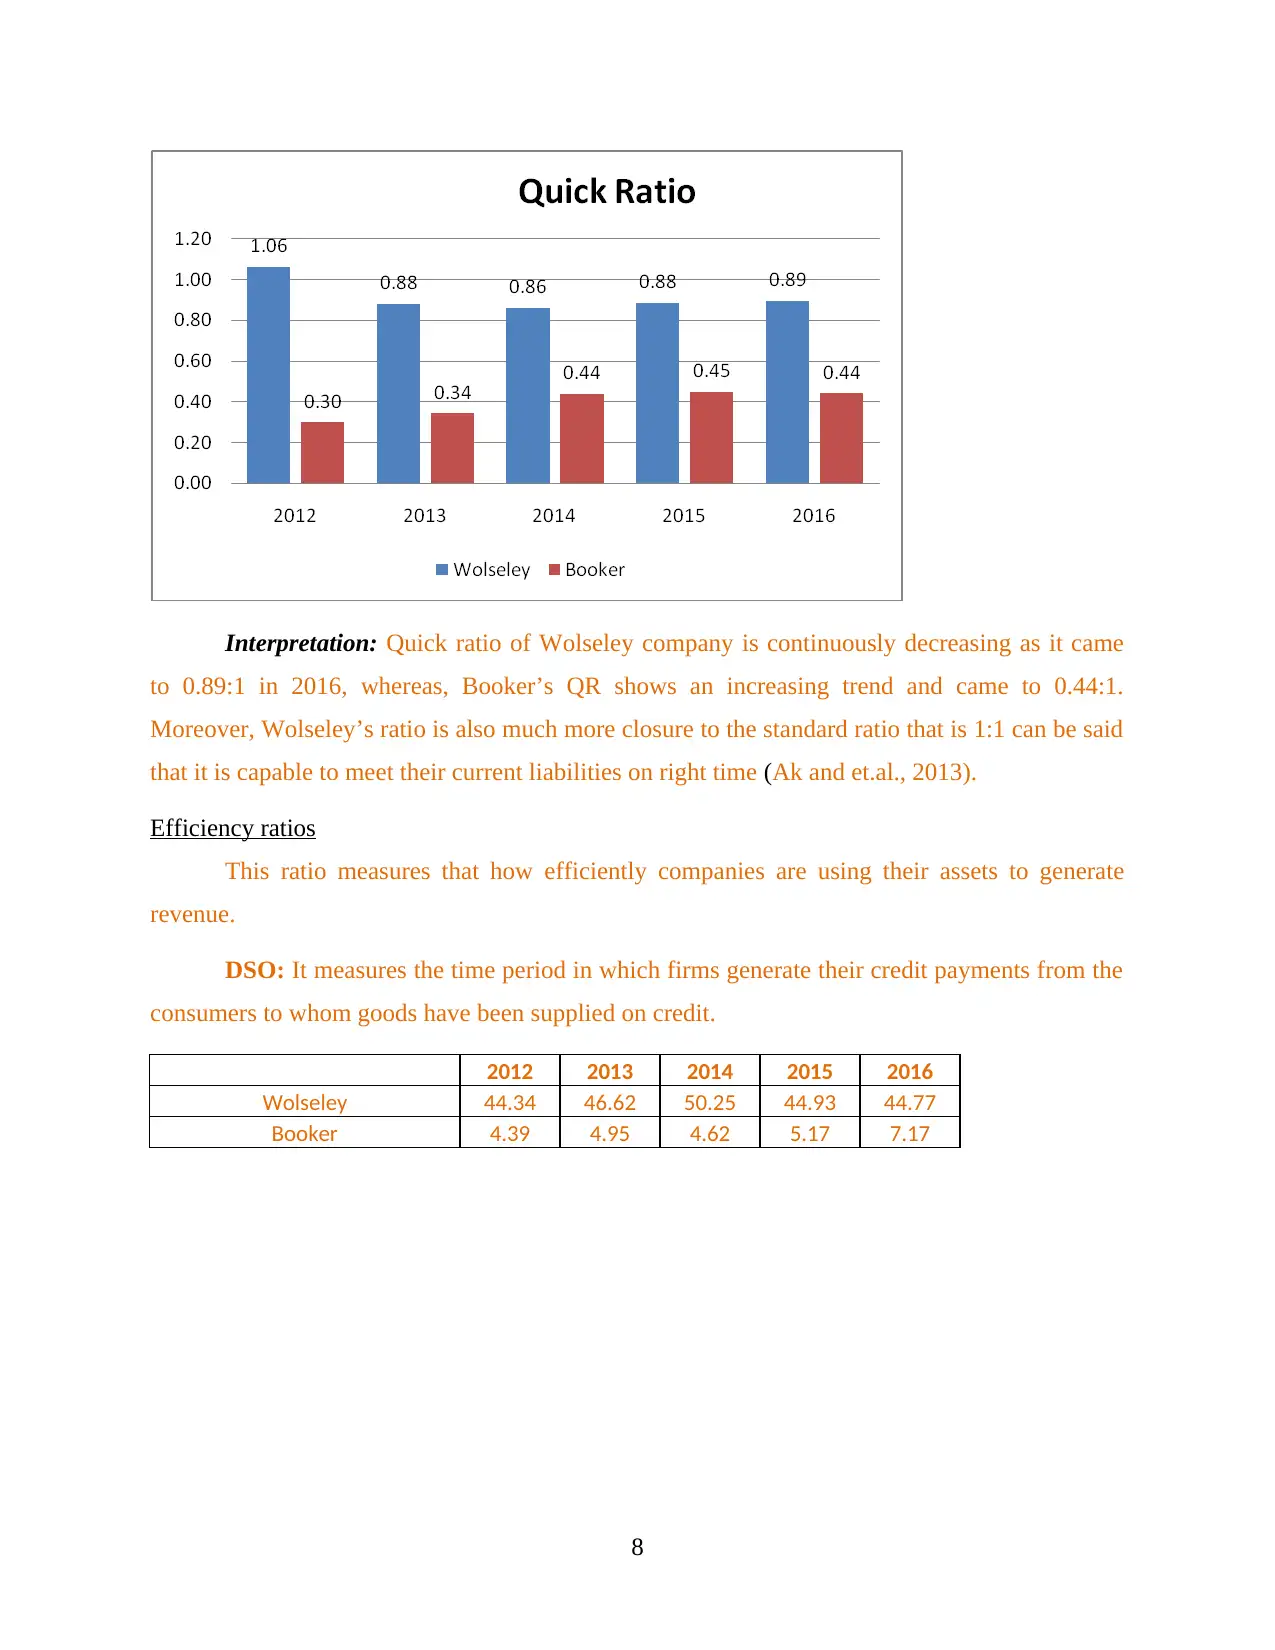
Interpretation: Quick ratio of Wolseley company is continuously decreasing as it came
to 0.89:1 in 2016, whereas, Booker’s QR shows an increasing trend and came to 0.44:1.
Moreover, Wolseley’s ratio is also much more closure to the standard ratio that is 1:1 can be said
that it is capable to meet their current liabilities on right time (Ak and et.al., 2013).
Efficiency ratios
This ratio measures that how efficiently companies are using their assets to generate
revenue.
DSO: It measures the time period in which firms generate their credit payments from the
consumers to whom goods have been supplied on credit.
2012 2013 2014 2015 2016
Wolseley 44.34 46.62 50.25 44.93 44.77
Booker 4.39 4.95 4.62 5.17 7.17
8
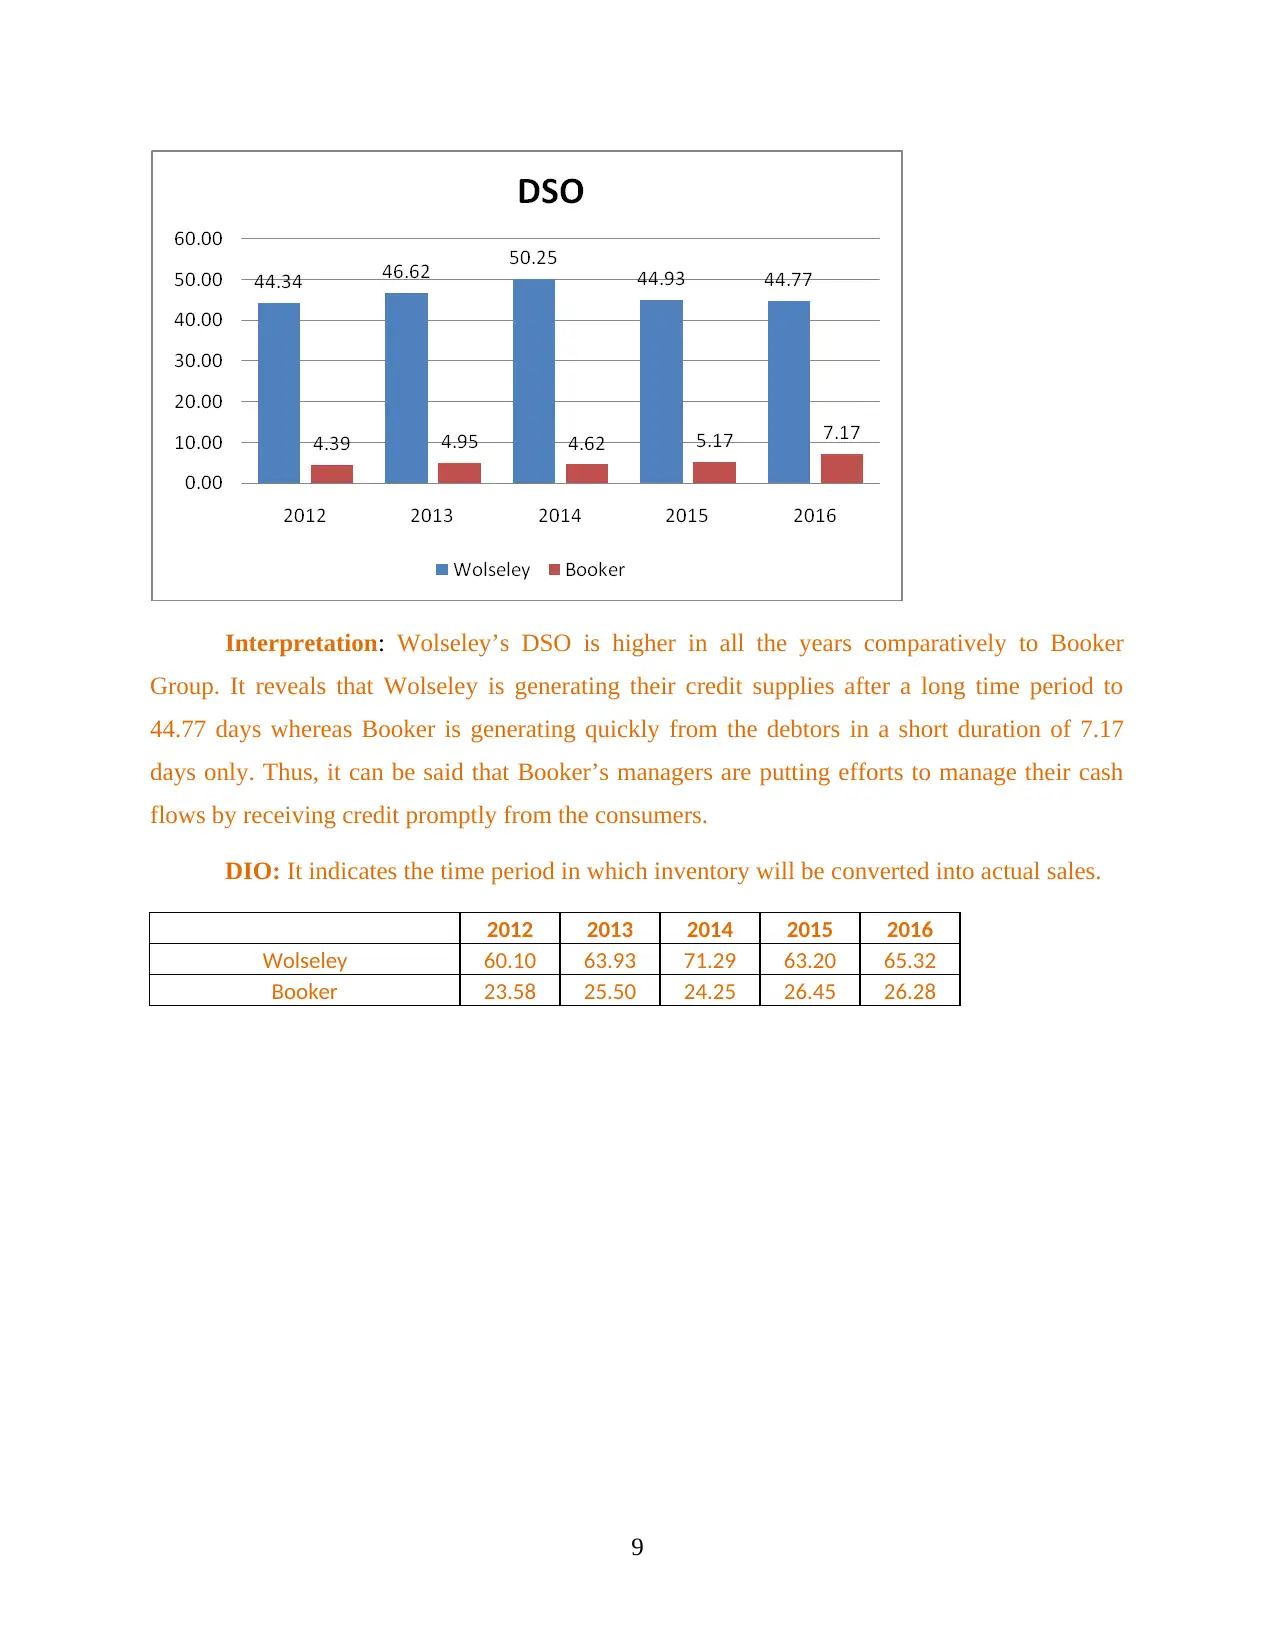
Interpretation: Wolseley’s DSO is higher in all the years comparatively to Booker
Group. It reveals that Wolseley is generating their credit supplies after a long time period to
44.77 days whereas Booker is generating quickly from the debtors in a short duration of 7.17
days only. Thus, it can be said that Booker’s managers are putting efforts to manage their cash
flows by receiving credit promptly from the consumers.
DIO: It indicates the time period in which inventory will be converted into actual sales.
2012 2013 2014 2015 2016
Wolseley 60.10 63.93 71.29 63.20 65.32
Booker 23.58 25.50 24.25 26.45 26.28
9
⊘ This is a preview!⊘
Do you want full access?
Subscribe today to unlock all pages.
Trusted by 1+ million students worldwide
1 out of 36
Related Documents


Your All-in-One AI-Powered Toolkit for Academic Success.
+13062052269
info@desklib.com
Available 24*7 on WhatsApp / Email
![[object Object]](/_next/static/media/star-bottom.7253800d.svg)
Unlock your academic potential
Copyright © 2020–2026 A2Z Services. All Rights Reserved. Developed and managed by ZUCOL.