Strategic Management Accounting Report: Performance Analysis
VerifiedAdded on 2023/05/23
|17
|4586
|404
Report
AI Summary
This comprehensive report delves into the realm of Strategic Management Accounting, offering a detailed exploration of performance management and measurement. It begins by defining and illustrating the practical application of these tools, emphasizing their role in enhancing overall performance control across various perspectives. The report then presents a practical example of costing calculations utilizing the contribution margin method, demonstrating its utility in optimizing production planning under resource constraints. Furthermore, it provides a thorough review of Activity-Based Costing (ABC) practices, highlighting their advantages and suitability within the service industry. The report also covers divisional performance management, including financial and non-financial metrics like ROI, RI, and EVA, and concludes with case studies illustrating practical applications of the concepts discussed, such as Rockwater's use of a balanced scorecard and the evaluation of a coaching program at Britvic.
Strategic
Management
Accounting
Lecturer: Dr Le Thi Thu
Student: Nguyen Minh Sang
Management
Accounting
Lecturer: Dr Le Thi Thu
Student: Nguyen Minh Sang
Paraphrase This Document
Need a fresh take? Get an instant paraphrase of this document with our AI Paraphraser
Table of content
Table of content 2
Introduction 3
PART I - QUESTION 1 4
1. Strategic performance management 4
a. Definition 4
b. Importance 4
c. Implementing SPM 4
d. Challenges 5
e. Case study 5
2. Managerial performance measurement 5
a. Definition 5
b. Importance 6
c. Implementation 6
d. Challenges 6
e. Case study 7
3. Divisional performance management 7
a. Definition 7
b. Importance 7
c. Implementation 7
d. Challenges 8
PART II - QUESTION 3 10
1. Summary 10
2. Production plan 10
3. Evaluation of a production growth project 12
a. Quantitatively 12
b. Qualitatively 12
4. Activity based costing in service industry 13
REFERENCE 14
APPENDIX 16
APPENDIX 1. 16
2
Introduction
This report demonstrates some basic understanding in the field of Strategic management
accounting. First, it defines and gives some instructions on the use of performance
management and measurement. These tools are applied to give the ability to better control
their performance as a whole, whether from what perspective. Secondly, this report did an
example calculation of costing using the contribution margin method. This method helps
manufacturers choose a suitable production plan given limited resources. Finally, this report
reviews the Activity-based Costing practice, its benefits, and why it is suitable to be used in
the service industry.
3
⊘ This is a preview!⊘
Do you want full access?
Subscribe today to unlock all pages.
Trusted by 1+ million students worldwide
PART I - QUESTION 1
1. Strategic performance management
a. Definition
Strategic performance management (SPM) is the process for improving performance
assessment, monitoring, and improvement at a strategic level. It integrates personnel with the
overall corporate strategy by establishing clear objectives and expectations, providing
leadership, and communicating effectively to ensure a same goal being established to
everyone. SPM is a proven method for accomplishing corporate objectives (Basumallick,
2020).
b. Importance
Strategic performance management breaks down silos by creating a common language for
everyone in a company so that they can engage transparently and efficiently to each other and
to corporate goals. As a result, disorganization, wasted time, and competing interests are
reduced, and employee engagement is increased (Jackson, 2023). Given this, employees are
more productive because they are driven by motives other than personal ones. Also, middle
managers are fully informed of the expectations of their departments, leading to
empowerment and efficient management.
c. Implementing SPM
A Strategic performance management system usually involves the use of metrics and tools
like Balanced Scorecard (BSC), Bench-marking, and/or Strategy maps, but BSC is the most
popular among all (Basumallick, 2020). BSC is a performance indicator used to pinpoint,
enhance, and manage a company's numerous operations and outcomes. It measures 4 metrics
(1) learning and growth, (2) business operations, (3) customers, and (4) finances. Using BSC,
businesses can combine data into a single report, provide information on service and quality
in addition to financial performance, and aid in efficiency improvements (Tarver, Brock, and
Rathburn, 2023).
It is notable that there is no set of guaranteed metrics, changing objectives will lead to
changing metrics, too. However, businesses can base on some characteristics to develop a
good metrics system (Chandrashekhar et al., 2017). First, metrics must be in conformance
with strategic objectives (both current and future) and must be adaptable to smaller business
units, even to individual employees. Also, businesses should aggregate the indicators to some
extent so that the majority of employees may access the information appropriately. Last but
not least, businesses should start using metrics as soon as they have enough data rather than
waiting for a flawless one.
4
Paraphrase This Document
Need a fresh take? Get an instant paraphrase of this document with our AI Paraphraser
d. Challenges
Implementing SPM presents some challenges because it touches on accountability and
incentives. The first hurdle is executive alignment, which requires leaders to agree on
tracking, reporting, and adhering to performance standards. Top management must take
ownership of the effort and ensure that executives embrace the new or modified KPIs. This is
why sometimes it takes a SPM system 2 to 3 years to fit in (Chandrashekhar et al., 2017).
Finally, executives must avoid becoming overwhelmed by data by focusing on the "metrics
that matter." Typically, just five to eight strategic objectives should be selected in order to
manage them in the most practicable methods (Chandrashekhar et al., 2017). Due to these
factors, the metrics chosen should be as open and inclusive as possible, and careful
consideration and attention should be given to syndication and gaining executive buy-in.
e. Case study
In the 1980s, Rockwater led the world in underwater engineering and building. Customers'
behavior then was changing from choosing a provider based on price to choosing a one they
could trust. Rockwater, to survive, had to create a vision to "offer the greatest levels of safety
and quality". This vision then grew into a set of five objectives that were further summarized
in a balanced scorecard. The scorecard helped Rockwater's management in emphasizing a
process-based approach to operations, inspiring staff, and incorporating customer input into
daily operations. It led to agreement on the necessity of forming alliances with important
clients, the significance of lowering safety-related events, and the requirement for enhanced
project management at each stage. The scorecard was a crucial instrument for the business in
achieving its ultimate goal of dominating its sector (Kaplan and Norton, 1993).
The vision, objectives, and balanced scorecard of Rockwater can be found in appendix 1.
2. Managerial performance measurement
a. Definition
There are several definitions of “performance measurement” by authors worldwide (Moullin,
2007), but the definition of Moullin (2002, p.188) is applied in this writing. Moullin
described performance measurement as “the process of evaluating how well organizations are
managed and the value they deliver for customers and other stakeholders”. He argued that his
definition, compared to others, is more well-rounded because of the world “evaluating",
which implies data collection, interpretation, and analysis (Moullin, 2007). Given this and
some research, in this report, I define “managerial performance measurement” as “the process
of evaluating a business’s performance information to make improvements”.
It is worth noting here that “performance measurement” is different from “performance
management”. Simply put, the former tries to “track the progress of a strategy” while the
latter attempts to manage that strategy (Chow, 2017). At the highest level, performance
5
measurements measure an organization's overall development toward its vision and strategic
goals (Chandrashekhar et al., 2017).
b. Importance
To achieve goals, companies need to ensure that their performance is in conformance with
plans, and the main purpose of a performance measurement is to provide the data to do so. A
well-established performance measurement system assesses performance both quantitatively
and qualitatively to provide managers with easy-to-understand (Siddiqui, 2015). Such a good
system also increases engagement and accountability throughout an organization by making
people work together (Ontario, n.d.). Finally, the system may give invaluable data with which
many useful findings may be generated (Ontario, n.d.). This data can inform managers about
the lessons learned and best practices, communicate an organization’s story, or even
demonstrate the changing patterns for further performance analysis.
c. Implementation
Depending on the nature of a business, different tools and techniques can be used in
performance measurement. Employees must believe that these techniques of measurement,
known as performance evaluations, are fair and equitable. Those who deploy these tools
should select tools with the highest level of impartiality feasible (Gluck, n.d.).
Aside from BSC and Benchmarking(please see part 1, section 1c), 360 degree feedback is
one of the most often used performance evaluation technologies. This technology enables
managers to acquire anonymous feedback (and hence be honest) from those with whom they
often engage throughout the course of everyday operations. Management by objectives is
another option. Managers use this strategy to meet with direct reports, set short- and
long-term goals that align with the company's major objectives, and then assess their progress
at the end of the year.
d. Challenges
In applying performance measurements, proper analysis to choose the right metrics is
definitely the greatest roadblock. But even when a good set of metrics have been developed,
there are still common traps where managers easily find themselves dealt with (Likierman,
2009).
The first one is that although a performance measurement system is well developed, it does
not provide all information for a business to be competitive. They must also benchmark to
search for the best practices outhere and improve non-stop. The second one is being mistaken
on the use of such a system. We usually compare performance data with that in the past and
feel achieved or disappointed. The main purpose of it is determining whether the data
collected is promising for meeting goals, not compared to the past. The third and fourth
problems are presented in the data collection progress. The personnel providing the data may
try to hide data presenting poor results or fake it. For example, sales employees when asked
to take customers’ feedback on sales service may try to hide negative comments and only
6
⊘ This is a preview!⊘
Do you want full access?
Subscribe today to unlock all pages.
Trusted by 1+ million students worldwide
deliver the good ones. This is understandable since the better the result, the higher his or her
commission could be. Finally, the measuring system tends to develop slower than a business,
especially for the small ones. For example, performance in the first stage is all about survival,
but only 6 months later it can change to market expansion. Managers must always review the
metrics and make sure that they are in line with the company’s strategy, which can change
through time.
e. Case study
Well-built metrics demand a far more sophisticated and qualitative approach to evaluation.
For example, HR at the soft beverages firm Britvic evaluates a coaching program by
following participants for a year after they complete it. Instead of relying on survey questions
like "I learned a lot from the program," the efficacy is determined by comparing their career
paths to those of persons who did not get coaching (Likierman, 2009). Such program
administrators must anticipate the demands of the program's stakeholders, such as
participants or sponsors, and ensure that the syllabus satisfies goals.
3. Divisional performance management
a. Definition
Divisional performance management (DPM) is the process for enhancing business division
performance by monitoring, evaluating, and implementing necessary changes. It is worth
noting here that DPM is different from the division’s manager performance. Since there are
many factors not impacted by the manager (e.g. headquarter’s marketing budget for the
region where the division is at), it is not suitable and effective to do so (Drury and Shishini,
2005).
b. Importance
The first importance of DPM lies in the fact that it helps the division operate more effectively.
DPM helps to pinpoint inefficiencies and suggest changes to improve the situation. The
second benefit of DPM is that it ensures consistency in a corporation strategy
implementation. As stated, a division, working quite separately from the mother company,
can act in a way that only benefits itself. A well-established DPM system aligns the division’s
objectives with those of the corporation, preventing this from happening. Finally, the system
allows the division and the mother company to work together. This enhances employee
engagement and in turn helps both organizations.
c. Implementation
Divisional performance measurements can be based on both financial and non-financial data
(Drury and Shishini, 2005, p. 15).
● Financial
7
Paraphrase This Document
Need a fresh take? Get an instant paraphrase of this document with our AI Paraphraser
Return on investment (ROI) aids DPM by serving as a common denominator for comparing
percentage returns on investments of various amounts in disparate firms. (e.g. two divisions
serving the same purpose in different geological areas).
Experts in the field also recommend using Residual Income (RI), which may boost the
possibility of divisional managers investing in profitable initiatives. RI is even more flexible
since the different capital costs can be applied to assets with varying degrees of risk.
Finally, economic value added (EVA), which was developed from RI by Stern Stewart & Co,
is also frequently used (Drury and Shishini, 2005, p. 17). In comparison with RI, EVA can
incorporate strategic objectives into short-term management. EVA is calculated using
operational revenue after taxes, the needed investment, and the cost of the asset investment.
EVA can determine how corporate value might be created or lost. The goal of developing
EVA is to create an overall financial indicator that motivates senior management to focus on
delivering shareholder value.
● Non-financial
However, depending primarily on financial metrics might destabilize the broader strategic
goals. Experts recommended complementing DPM with non-financial measurements like
competitiveness, productivity, or adaptation to changes. Such non-financial measurements
should offer divisional managers with a more well-rounded view of what benefits look like.
In addition to the Balanced Scorecard, The Performance Prism is also a useful non-financial
measure. It is a framework for establishing multidimensional performance assessment
frameworks that includes five viewpoints (1) Stakeholder needs, (2) Our needs (3) Strategy
(4) Process, and (5) our Capabilities. It explains in detail how managers may use
measurement data to boost corporate performance. It has a far more complete picture of many
stakeholders, including as investors, consumers, and/or workers.
d. Challenges
The first and most important challenge facing DPM is rather related more to the nature of
divisionalized businesses. As stated, since the divisional managers are somewhat seen as
“owners”, they may have more interests in their divisions than the objectives of the mother
company. This might create major roadblocks for the cooperation of the division
implementing the overall strategy. Even conflicts may arise between the divisions regarding
resources allocation, and conflicts are 50% of the time destructive, not constructive.
Secondly, different DPM systems may be required for different divisions, even when those
divisions are purposely similar. Not only so, the factors of controllability and
uncontrollability also differ among divisions. This means the executive planners at the
mother company must be very careful when developing DPM systems for their divisions
(Kfknowledgebank, 2022).
8

9
⊘ This is a preview!⊘
Do you want full access?
Subscribe today to unlock all pages.
Trusted by 1+ million students worldwide
PART II - QUESTION 3
1. Summary
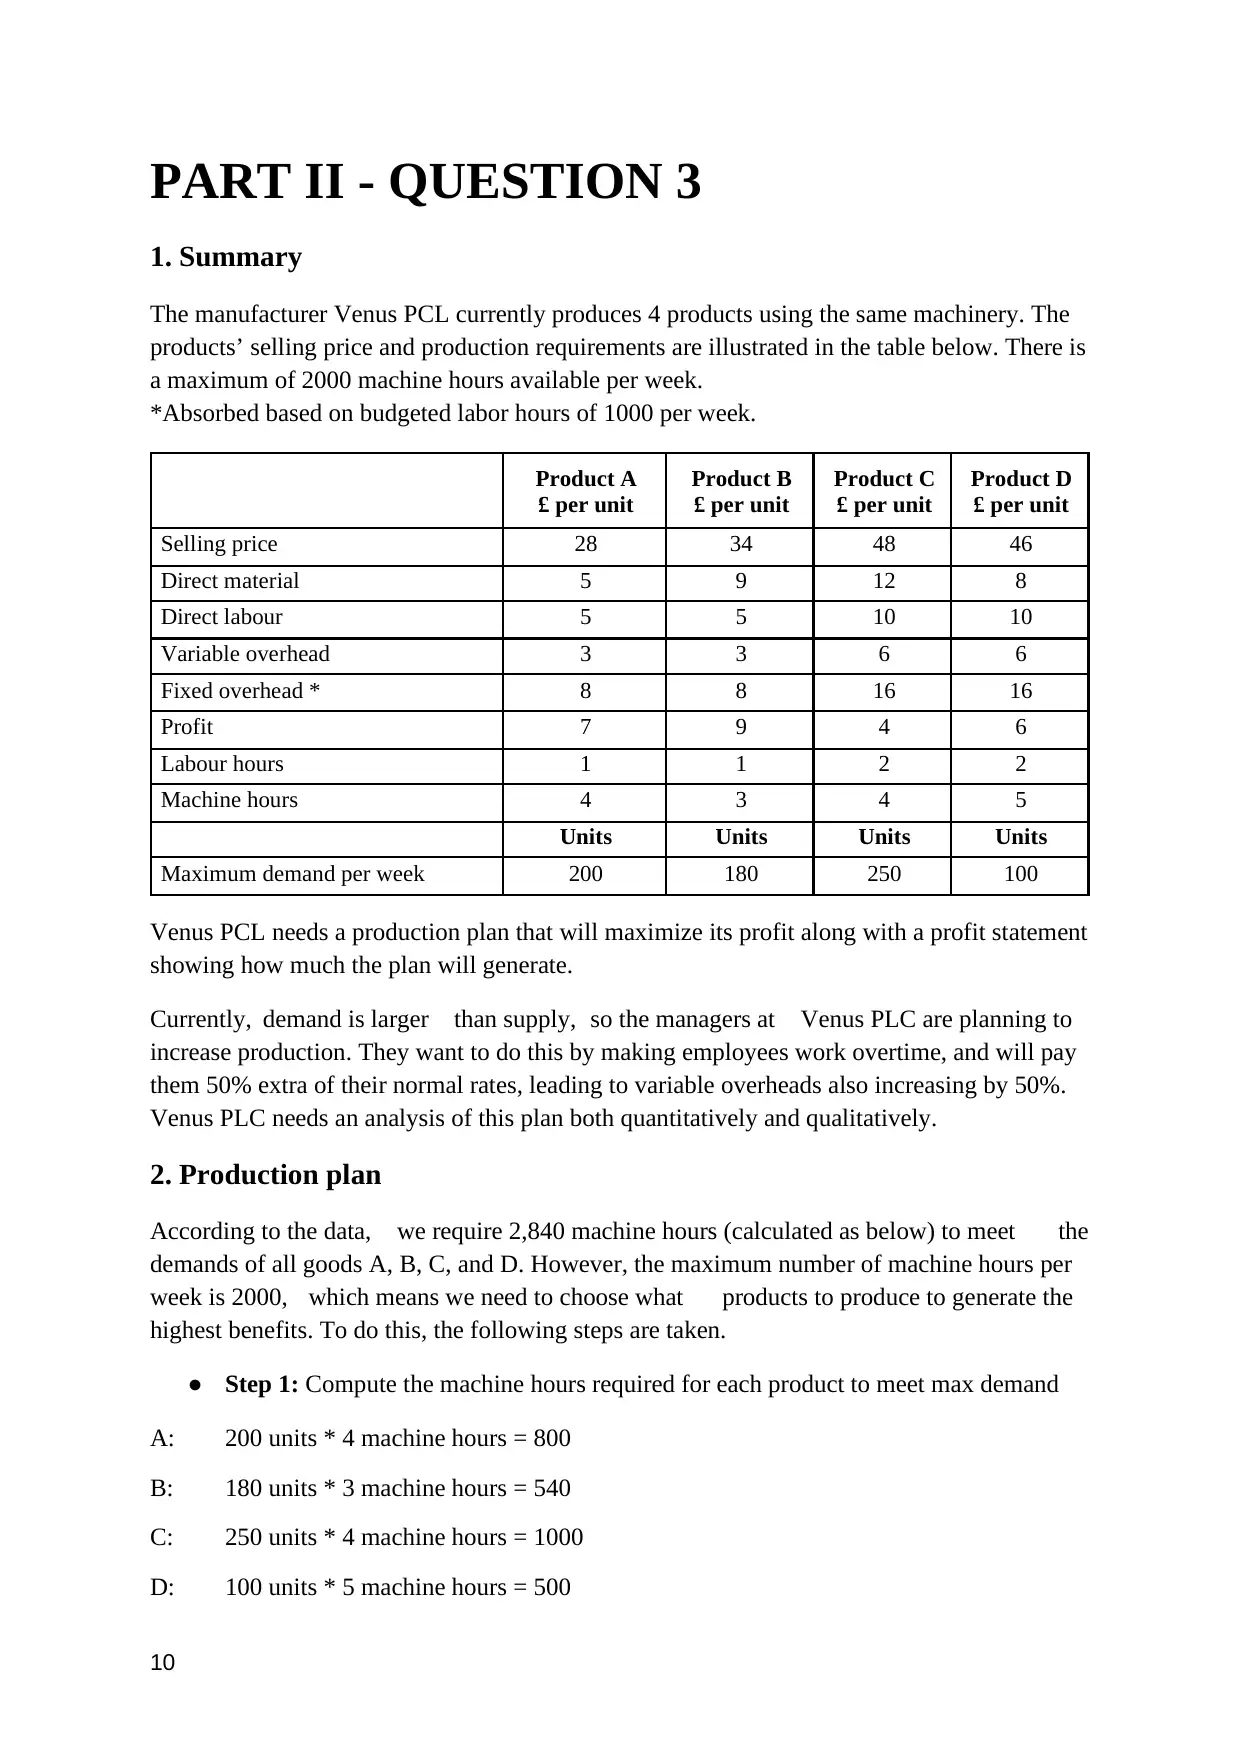
The manufacturer Venus PCL currently produces 4 products using the same machinery. The
products’ selling price and production requirements are illustrated in the table below. There is
a maximum of 2000 machine hours available per week.
*Absorbed based on budgeted labor hours of 1000 per week.
Product A
£ per unit
Product B
£ per unit
Product C
£ per unit
Product D
£ per unit
Selling price 28 34 48 46
Direct material 5 9 12 8
Direct labour 5 5 10 10
Variable overhead 3 3 6 6
Fixed overhead * 8 8 16 16
Profit 7 9 4 6
Labour hours 1 1 2 2
Machine hours 4 3 4 5
Units Units Units Units
Maximum demand per week 200 180 250 100
Venus PCL needs a production plan that will maximize its profit along with a profit statement
showing how much the plan will generate.
Currently, demand is larger than supply, so the managers at Venus PLC are planning to
increase production. They want to do this by making employees work overtime, and will pay
them 50% extra of their normal rates, leading to variable overheads also increasing by 50%.
Venus PLC needs an analysis of this plan both quantitatively and qualitatively.
2. Production plan
According to the data, we require 2,840 machine hours (calculated as below) to meet the
demands of all goods A, B, C, and D. However, the maximum number of machine hours per
week is 2000, which means we need to choose what products to produce to generate the
highest benefits. To do this, the following steps are taken.
● Step 1: Compute the machine hours required for each product to meet max demand
A: 200 units * 4 machine hours = 800
B: 180 units * 3 machine hours = 540
C: 250 units * 4 machine hours = 1000
D: 100 units * 5 machine hours = 500
10
1. Summary
The manufacturer Venus PCL currently produces 4 products using the same machinery. The
products’ selling price and production requirements are illustrated in the table below. There is
a maximum of 2000 machine hours available per week.
*Absorbed based on budgeted labor hours of 1000 per week.
Product A
£ per unit
Product B
£ per unit
Product C
£ per unit
Product D
£ per unit
Selling price 28 34 48 46
Direct material 5 9 12 8
Direct labour 5 5 10 10
Variable overhead 3 3 6 6
Fixed overhead * 8 8 16 16
Profit 7 9 4 6
Labour hours 1 1 2 2
Machine hours 4 3 4 5
Units Units Units Units
Maximum demand per week 200 180 250 100
Venus PCL needs a production plan that will maximize its profit along with a profit statement
showing how much the plan will generate.
Currently, demand is larger than supply, so the managers at Venus PLC are planning to
increase production. They want to do this by making employees work overtime, and will pay
them 50% extra of their normal rates, leading to variable overheads also increasing by 50%.
Venus PLC needs an analysis of this plan both quantitatively and qualitatively.
2. Production plan
According to the data, we require 2,840 machine hours (calculated as below) to meet the
demands of all goods A, B, C, and D. However, the maximum number of machine hours per
week is 2000, which means we need to choose what products to produce to generate the
highest benefits. To do this, the following steps are taken.
● Step 1: Compute the machine hours required for each product to meet max demand
A: 200 units * 4 machine hours = 800
B: 180 units * 3 machine hours = 540
C: 250 units * 4 machine hours = 1000
D: 100 units * 5 machine hours = 500
10
Paraphrase This Document
Need a fresh take? Get an instant paraphrase of this document with our AI Paraphraser
● Step 2: Calculate the products’ contribution margin
We take the difference between the products’ sales prices and their variable costs
A: 28 - 13 = 15£
B: 34 - 17 = 17£
C: 48 - 28 = 20£
D: 46 - 24 = 22£
● Step 3: Allocate machine hours to product based on their contribution margin ranking
We take the division the results above and their required machine hours to get their
contribution margin
A: 15 / 4 machine hours = 3.75£ 4th priority
B: 17 / 3 machine hours = 5.67£ 1st priority
C: 20 / 4 machine hours = 5.00£ 2nd priority
D: 22 / 5 machine hours = 4.40£ 3rd priority
Next, we orderly allocate the machine hours to the products with the largest contribution
margin until there is no machine hours left.
B: 540 machine hours (max demand met)
C: 1000 machine hours (max demand met)
D: 460 machine hours (2000 - 1000 - 540, hence max demand is not met)
A: 0 machine hours (we ran out of machine hours)
● Step 4: Calculate the number of production for each product
We take the division between the machine hours allocated for each product and the machine
hours that product needs.
A: 0 machine hours / 4 = 0 products
B: 540 machine hours / 3 = 180 products
C: 1000 machine hours / 4 = 250 products
D: 460 machine hours / 5 = 92 products
● Step 5: Compute the total profit
11
The total profit is calculated by multiplying the numbers of each product produced with their
profits.
A: 0 products * 7 = 0£
B: 180 products * 9 = 1620£
C: 250 products * 4 = 1000£
D: 92 products * 6 = 552£
Hence, the total profit for this production plan is 1620 + 552 + 1000 = 3172£
3. Evaluation of a production growth project
a. Quantitatively
● If the company wants to make its employees work overtime to compensate for the
missing demands, the additional money (aside from the original rates) the company
will have to pay:
D: 10*0.5*8 (add labor) + 6*0.5*8 (add variable overheads) = 64£
A: 5*0.5*200 (add labor) + 3*0.5*200 (add variable overheads) = 800£
● The total amount of additional revenue is:
A + D = 7*200 + 6*8 = 1448£
● The total amount of additional profit generated is:
1448 - 864 = 584£
● Based merely on the quantitative analysis, this plan is good.
b. Qualitatively
However, by also considering the qualitative aspects, we would see that the increase is not
worthwhile. The reasons for this argument are as follows.
● We must first consider that when we make employees work overtime, some of them
might not be strong enough to handle their work properly. This may lead to a decrease
in the product’s quality or employees morale
● Since the plan has not been implemented, there may be more costs that arise that
production managers are not aware of. For example, intense operation may make the
machines need maintenance sooner, this is also a cost to be consideed.
● Finally, this temporary plan might impact the overall strategy. For example, if the
higher managers need the plant instantly for other purposes, the production chain will
be disrupted.
12
⊘ This is a preview!⊘
Do you want full access?
Subscribe today to unlock all pages.
Trusted by 1+ million students worldwide
1 out of 17
Related Documents


Your All-in-One AI-Powered Toolkit for Academic Success.
+13062052269
info@desklib.com
Available 24*7 on WhatsApp / Email
![[object Object]](/_next/static/media/star-bottom.7253800d.svg)
Unlock your academic potential
Copyright © 2020–2026 A2Z Services. All Rights Reserved. Developed and managed by ZUCOL.