Strategic Management Report: Applying Strategic Management Tools
VerifiedAdded on 2023/06/16
|10
|2787
|217
Report
AI Summary
This report provides a strategic presentation analyzing the application of strategic management tools such as SWOT, Gap Analysis, PEST Analysis, and Five Forces Analysis to a business simulation. It examines the changes made over eight weeks, focusing on financial indicators like gross profit, operating expenses, net income, cash flow, and inventory. The analysis includes the impact of decisions related to production, pricing, and market strategies. Recommendations are provided based on whether the changes positively or negatively affected the company's earnings, with an emphasis on the third week's application of Porter's Five Forces as the most beneficial strategy.
Running head: STRATEGIC MANAGEMENT
Strategic Management
Name of Student:
Name of University:
Author’s Note:
Strategic Management
Name of Student:
Name of University:
Author’s Note:
Paraphrase This Document
Need a fresh take? Get an instant paraphrase of this document with our AI Paraphraser
1STRATEGIC MANAGEMENT
Table of Contents
Introduction......................................................................................................................................2
Application of five forces analysis..................................................................................................2
Application of Porter’s Generic Strategies......................................................................................2
Application of Gap Analysis...........................................................................................................3
Application of PEST analysis..........................................................................................................4
Application of SWOT......................................................................................................................5
Recommendations and Conclusion..................................................................................................6
References........................................................................................................................................7
2STRATEGIC MANAGEMENT
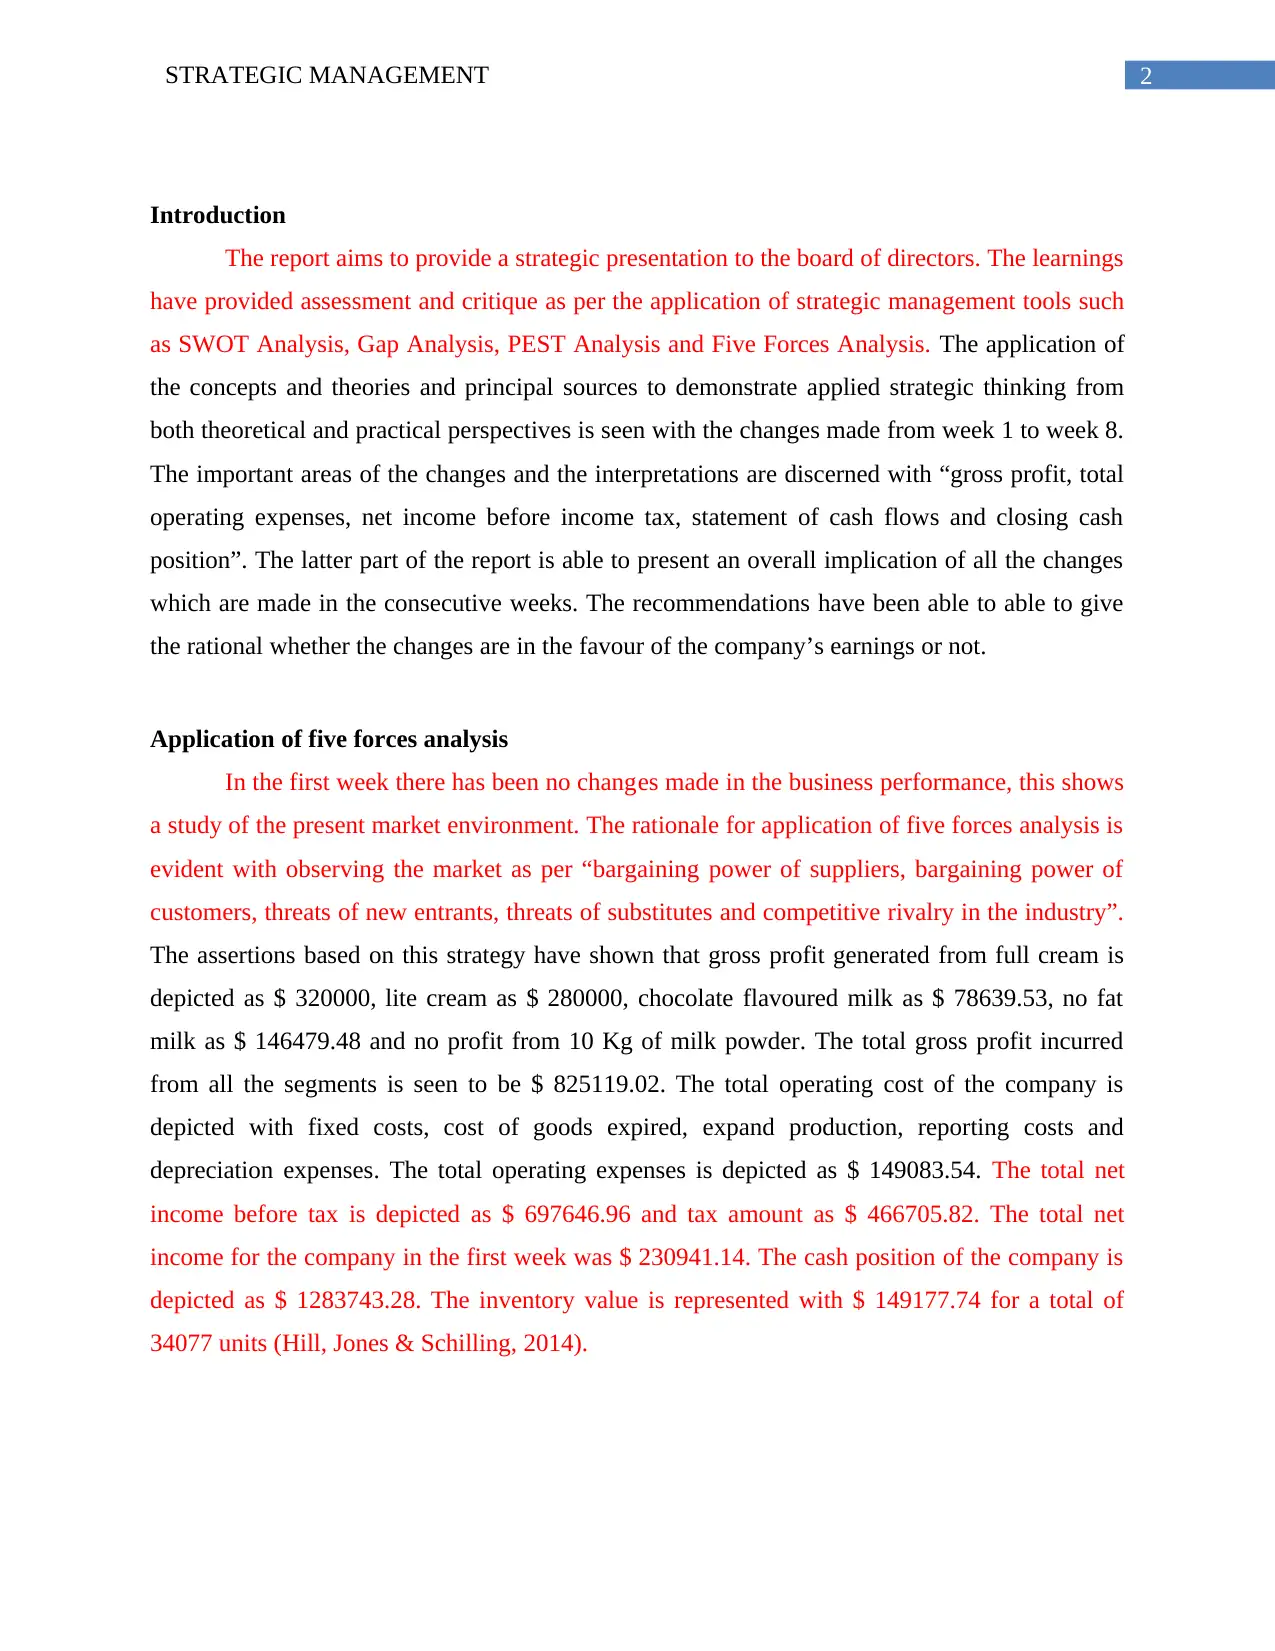
Introduction
The report aims to provide a strategic presentation to the board of directors. The learnings
have provided assessment and critique as per the application of strategic management tools such
as SWOT Analysis, Gap Analysis, PEST Analysis and Five Forces Analysis. The application of
the concepts and theories and principal sources to demonstrate applied strategic thinking from
both theoretical and practical perspectives is seen with the changes made from week 1 to week 8.
The important areas of the changes and the interpretations are discerned with “gross profit, total
operating expenses, net income before income tax, statement of cash flows and closing cash
position”. The latter part of the report is able to present an overall implication of all the changes
which are made in the consecutive weeks. The recommendations have been able to able to give
the rational whether the changes are in the favour of the company’s earnings or not.
Application of five forces analysis
In the first week there has been no changes made in the business performance, this shows
a study of the present market environment. The rationale for application of five forces analysis is
evident with observing the market as per “bargaining power of suppliers, bargaining power of
customers, threats of new entrants, threats of substitutes and competitive rivalry in the industry”.
The assertions based on this strategy have shown that gross profit generated from full cream is
depicted as $ 320000, lite cream as $ 280000, chocolate flavoured milk as $ 78639.53, no fat
milk as $ 146479.48 and no profit from 10 Kg of milk powder. The total gross profit incurred
from all the segments is seen to be $ 825119.02. The total operating cost of the company is
depicted with fixed costs, cost of goods expired, expand production, reporting costs and
depreciation expenses. The total operating expenses is depicted as $ 149083.54. The total net
income before tax is depicted as $ 697646.96 and tax amount as $ 466705.82. The total net
income for the company in the first week was $ 230941.14. The cash position of the company is
depicted as $ 1283743.28. The inventory value is represented with $ 149177.74 for a total of
34077 units (Hill, Jones & Schilling, 2014).
⊘ This is a preview!⊘
Do you want full access?
Subscribe today to unlock all pages.
Trusted by 1+ million students worldwide
3STRATEGIC MANAGEMENT
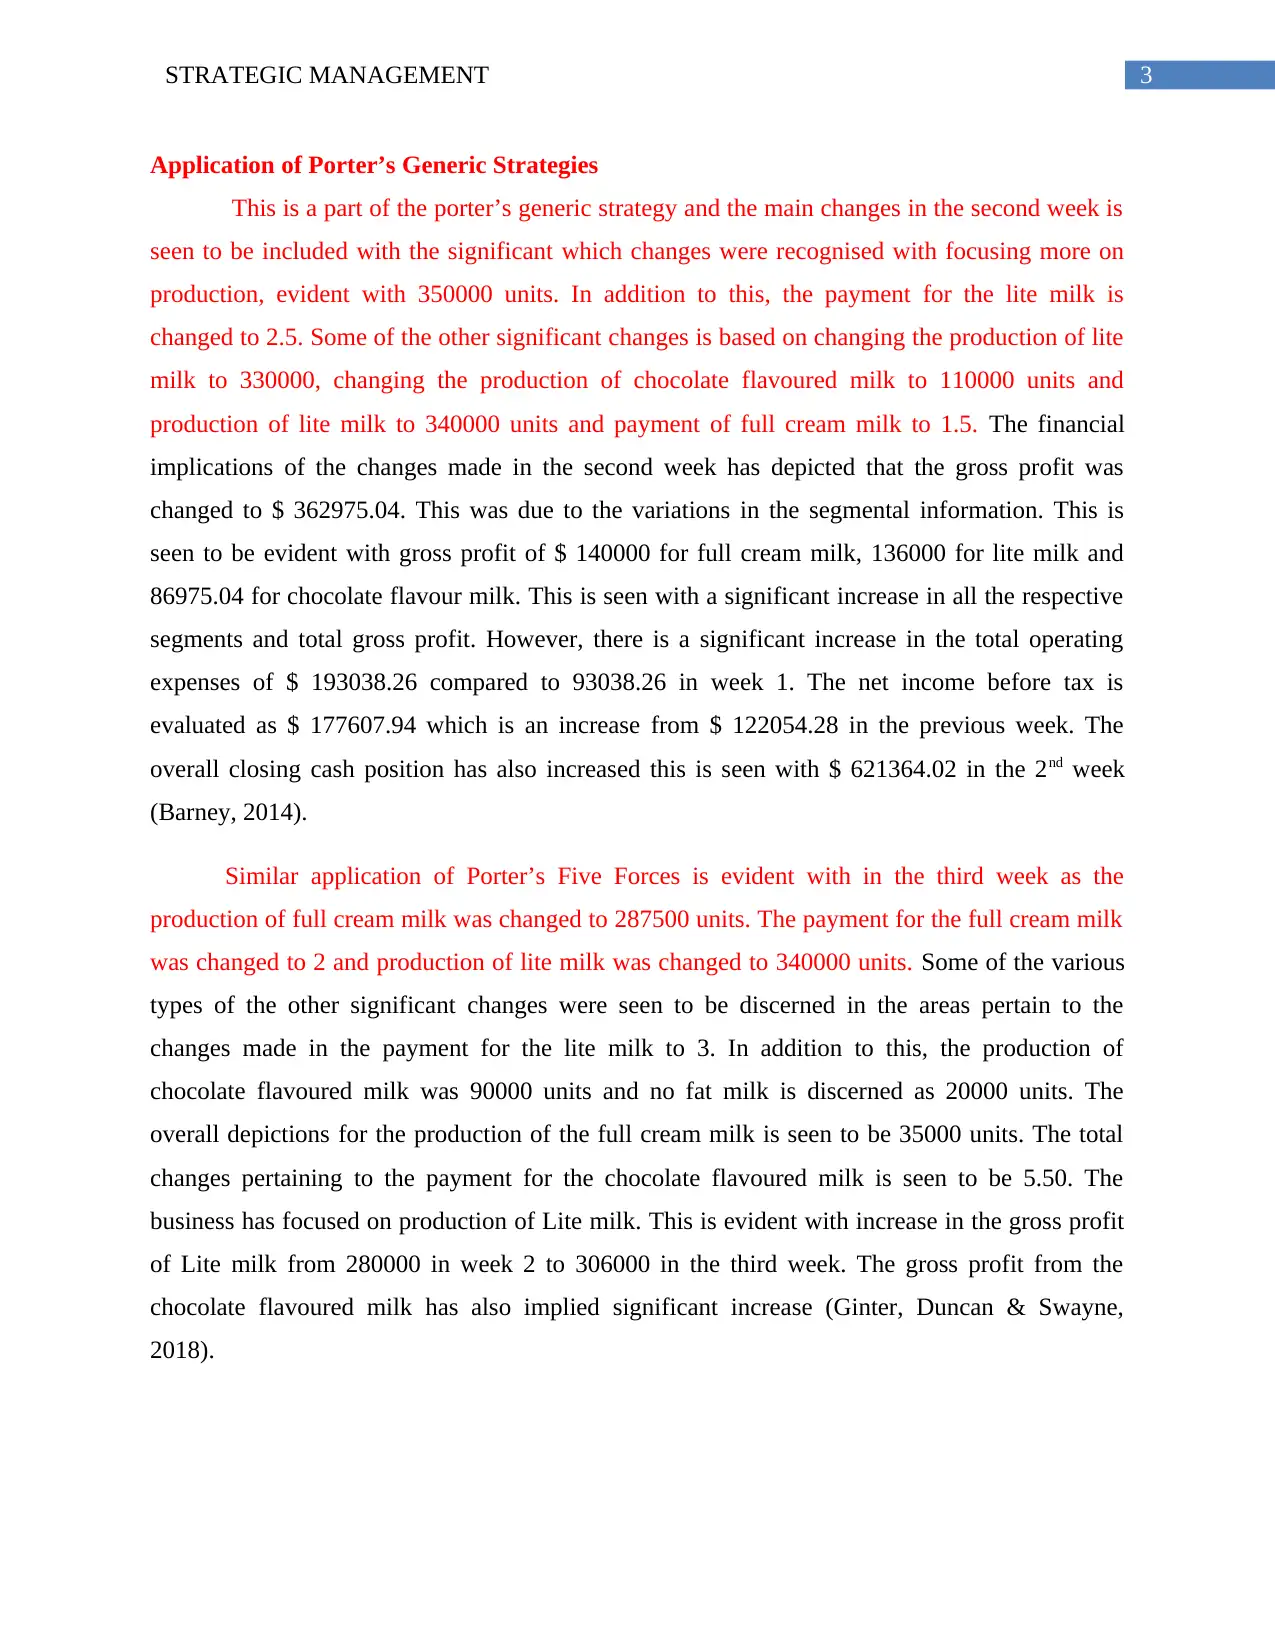
Application of Porter’s Generic Strategies
This is a part of the porter’s generic strategy and the main changes in the second week is
seen to be included with the significant which changes were recognised with focusing more on
production, evident with 350000 units. In addition to this, the payment for the lite milk is
changed to 2.5. Some of the other significant changes is based on changing the production of lite
milk to 330000, changing the production of chocolate flavoured milk to 110000 units and
production of lite milk to 340000 units and payment of full cream milk to 1.5. The financial
implications of the changes made in the second week has depicted that the gross profit was
changed to $ 362975.04. This was due to the variations in the segmental information. This is
seen to be evident with gross profit of $ 140000 for full cream milk, 136000 for lite milk and
86975.04 for chocolate flavour milk. This is seen with a significant increase in all the respective
segments and total gross profit. However, there is a significant increase in the total operating
expenses of $ 193038.26 compared to 93038.26 in week 1. The net income before tax is
evaluated as $ 177607.94 which is an increase from $ 122054.28 in the previous week. The
overall closing cash position has also increased this is seen with $ 621364.02 in the 2nd week
(Barney, 2014).
Similar application of Porter’s Five Forces is evident with in the third week as the
production of full cream milk was changed to 287500 units. The payment for the full cream milk
was changed to 2 and production of lite milk was changed to 340000 units. Some of the various
types of the other significant changes were seen to be discerned in the areas pertain to the
changes made in the payment for the lite milk to 3. In addition to this, the production of
chocolate flavoured milk was 90000 units and no fat milk is discerned as 20000 units. The
overall depictions for the production of the full cream milk is seen to be 35000 units. The total
changes pertaining to the payment for the chocolate flavoured milk is seen to be 5.50. The
business has focused on production of Lite milk. This is evident with increase in the gross profit
of Lite milk from 280000 in week 2 to 306000 in the third week. The gross profit from the
chocolate flavoured milk has also implied significant increase (Ginter, Duncan & Swayne,
2018).
Paraphrase This Document
Need a fresh take? Get an instant paraphrase of this document with our AI Paraphraser
4STRATEGIC MANAGEMENT
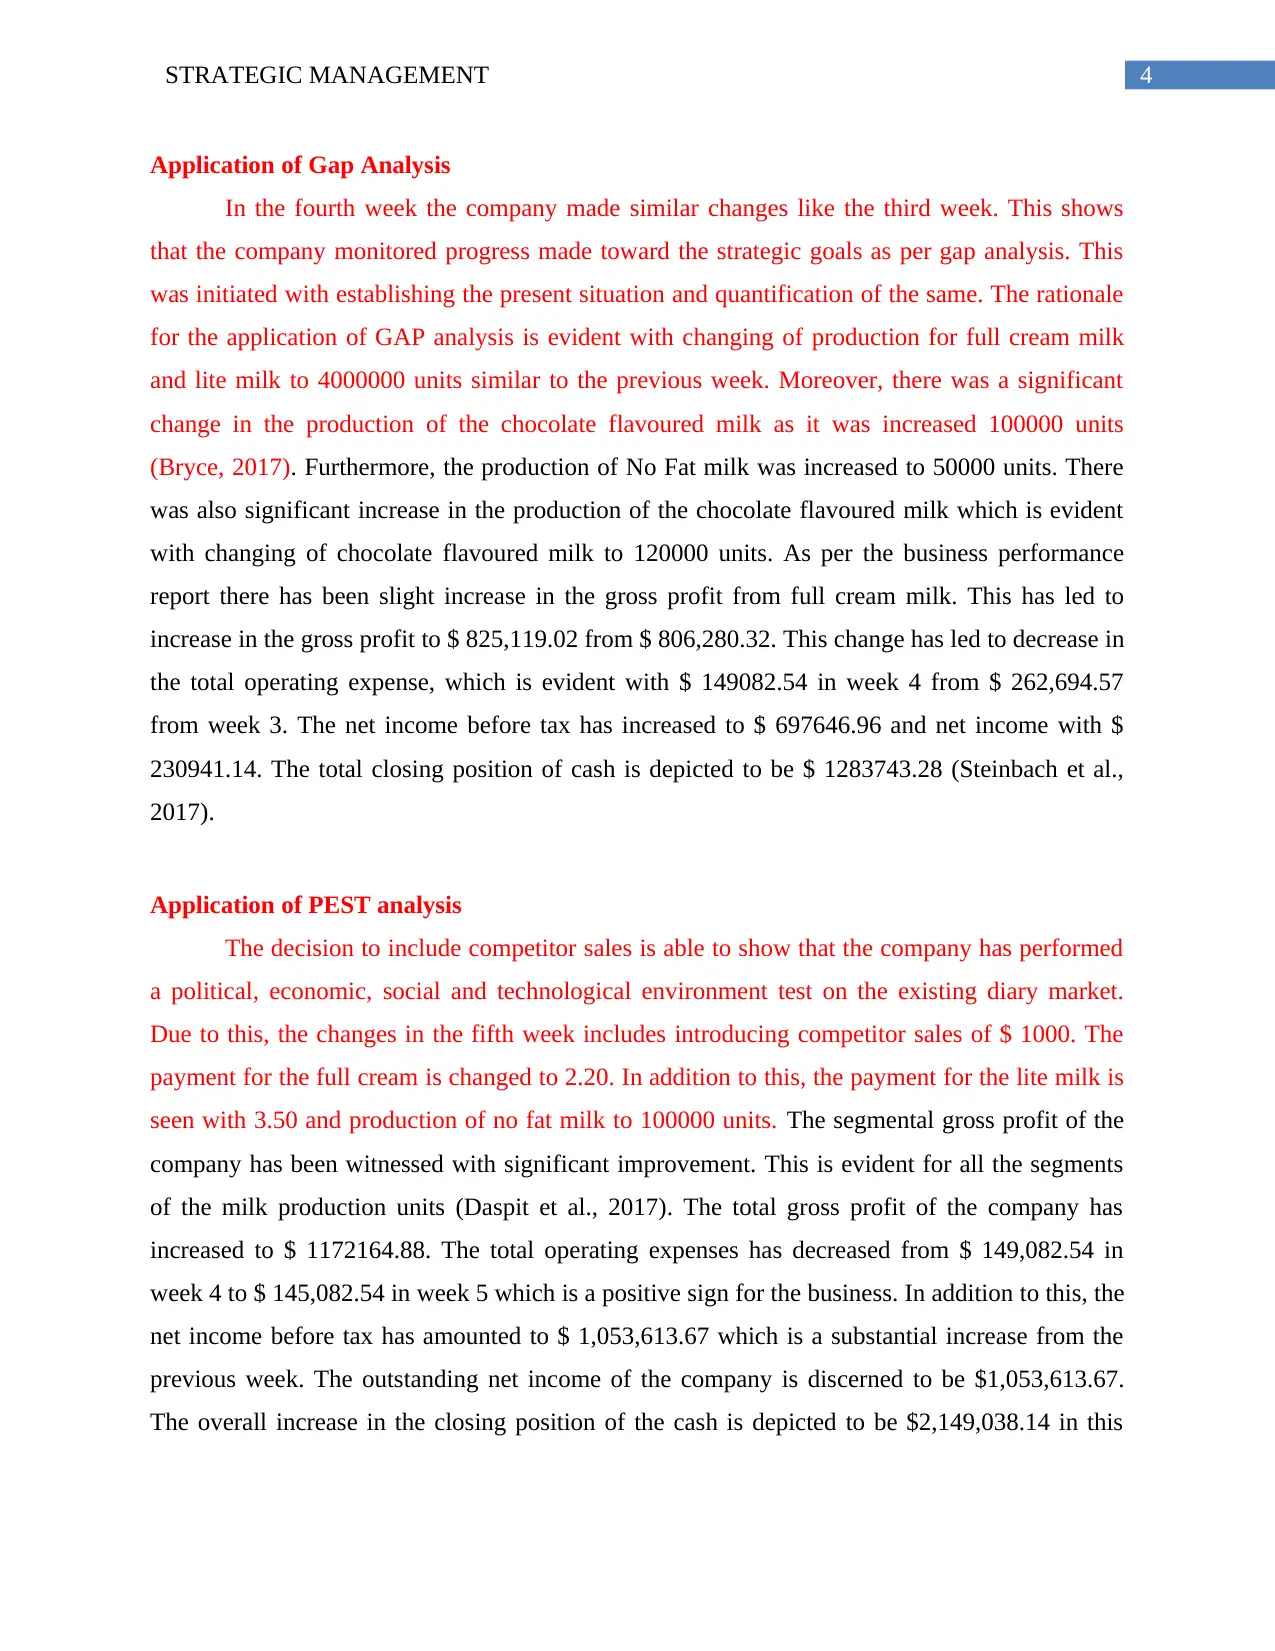
Application of Gap Analysis
In the fourth week the company made similar changes like the third week. This shows
that the company monitored progress made toward the strategic goals as per gap analysis. This
was initiated with establishing the present situation and quantification of the same. The rationale
for the application of GAP analysis is evident with changing of production for full cream milk
and lite milk to 4000000 units similar to the previous week. Moreover, there was a significant
change in the production of the chocolate flavoured milk as it was increased 100000 units
(Bryce, 2017). Furthermore, the production of No Fat milk was increased to 50000 units. There
was also significant increase in the production of the chocolate flavoured milk which is evident
with changing of chocolate flavoured milk to 120000 units. As per the business performance
report there has been slight increase in the gross profit from full cream milk. This has led to
increase in the gross profit to $ 825,119.02 from $ 806,280.32. This change has led to decrease in
the total operating expense, which is evident with $ 149082.54 in week 4 from $ 262,694.57
from week 3. The net income before tax has increased to $ 697646.96 and net income with $
230941.14. The total closing position of cash is depicted to be $ 1283743.28 (Steinbach et al.,
2017).
Application of PEST analysis
The decision to include competitor sales is able to show that the company has performed
a political, economic, social and technological environment test on the existing diary market.
Due to this, the changes in the fifth week includes introducing competitor sales of $ 1000. The
payment for the full cream is changed to 2.20. In addition to this, the payment for the lite milk is
seen with 3.50 and production of no fat milk to 100000 units. The segmental gross profit of the
company has been witnessed with significant improvement. This is evident for all the segments
of the milk production units (Daspit et al., 2017). The total gross profit of the company has
increased to $ 1172164.88. The total operating expenses has decreased from $ 149,082.54 in
week 4 to $ 145,082.54 in week 5 which is a positive sign for the business. In addition to this, the
net income before tax has amounted to $ 1,053,613.67 which is a substantial increase from the
previous week. The outstanding net income of the company is discerned to be $1,053,613.67.
The overall increase in the closing position of the cash is depicted to be $2,149,038.14 in this
5STRATEGIC MANAGEMENT
week the total cost of goods sold has amounted to $ 2,028,333.34 which is considered have
increased in compared to the previous week (Wheelen et al., 2017).
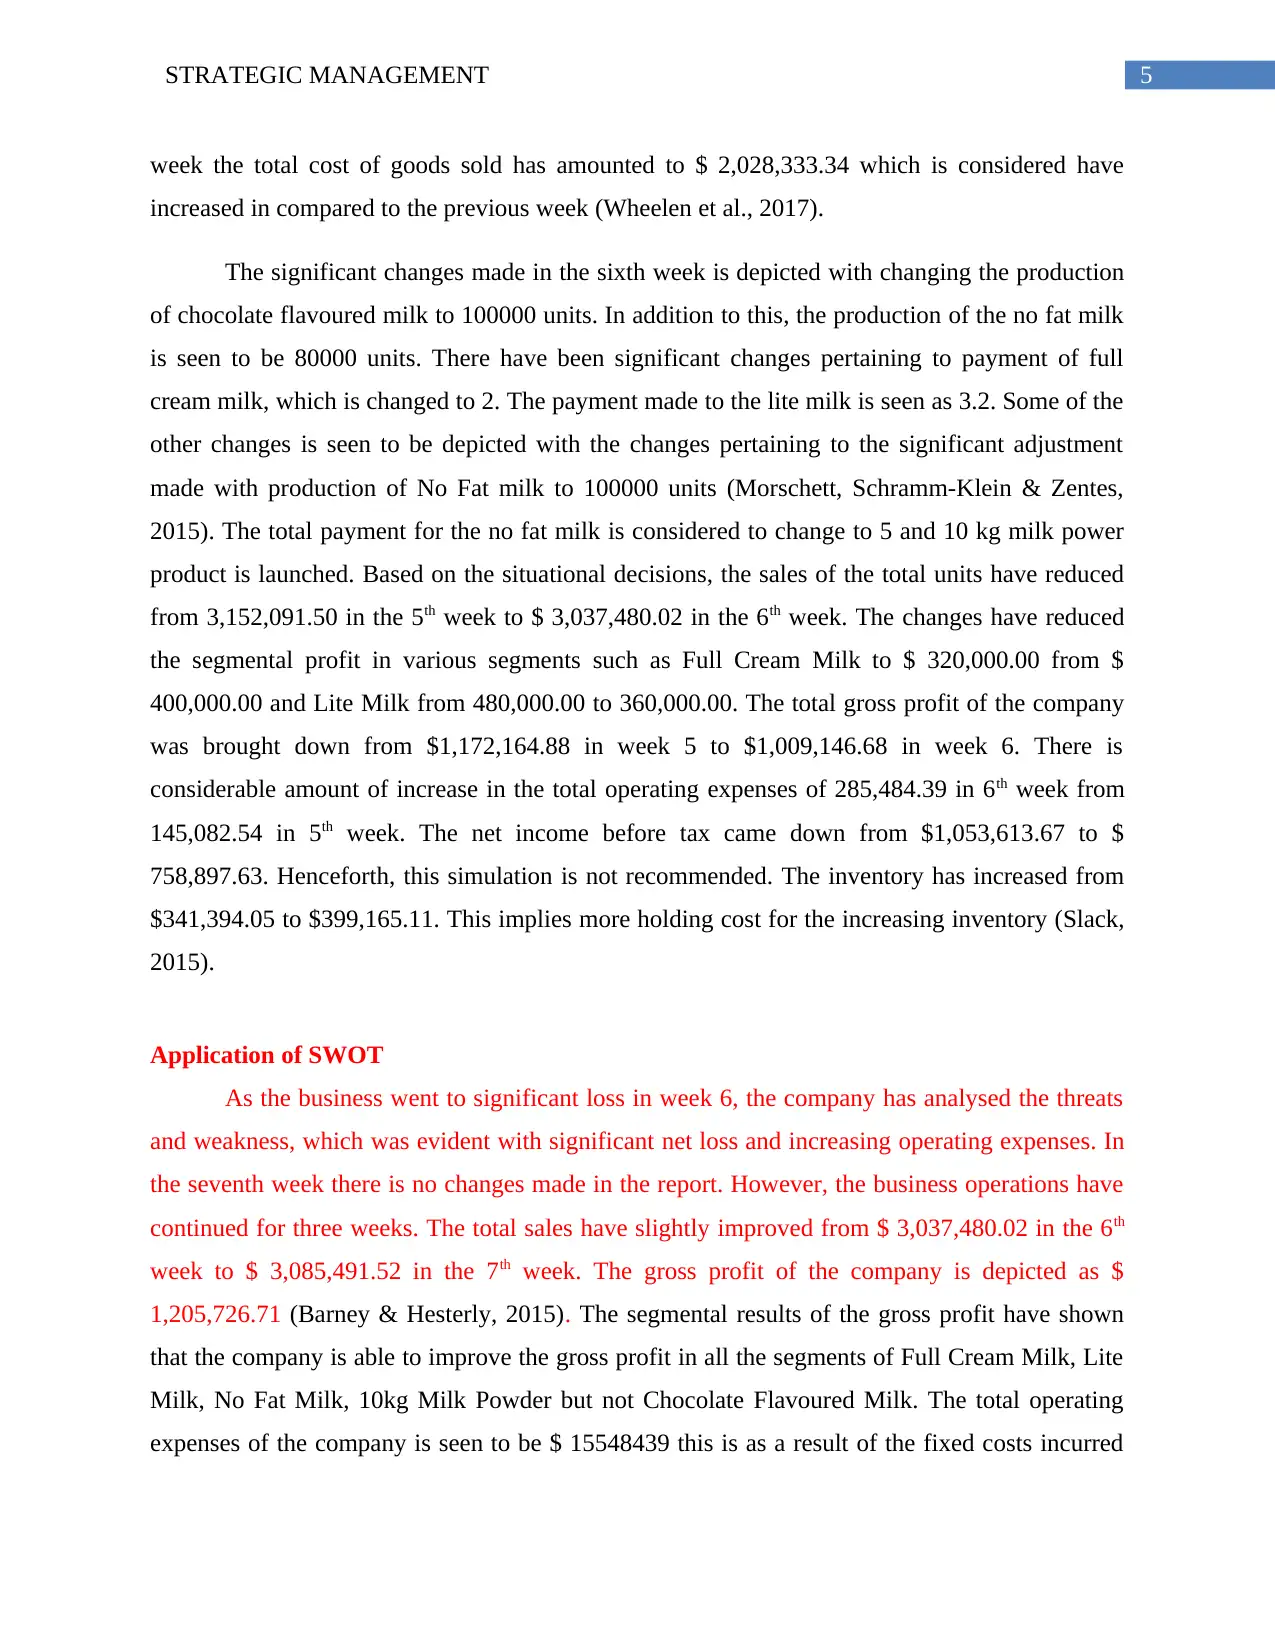
The significant changes made in the sixth week is depicted with changing the production
of chocolate flavoured milk to 100000 units. In addition to this, the production of the no fat milk
is seen to be 80000 units. There have been significant changes pertaining to payment of full
cream milk, which is changed to 2. The payment made to the lite milk is seen as 3.2. Some of the
other changes is seen to be depicted with the changes pertaining to the significant adjustment
made with production of No Fat milk to 100000 units (Morschett, Schramm-Klein & Zentes,
2015). The total payment for the no fat milk is considered to change to 5 and 10 kg milk power
product is launched. Based on the situational decisions, the sales of the total units have reduced
from 3,152,091.50 in the 5th week to $ 3,037,480.02 in the 6th week. The changes have reduced
the segmental profit in various segments such as Full Cream Milk to $ 320,000.00 from $
400,000.00 and Lite Milk from 480,000.00 to 360,000.00. The total gross profit of the company
was brought down from $1,172,164.88 in week 5 to $1,009,146.68 in week 6. There is
considerable amount of increase in the total operating expenses of 285,484.39 in 6th week from
145,082.54 in 5th week. The net income before tax came down from $1,053,613.67 to $
758,897.63. Henceforth, this simulation is not recommended. The inventory has increased from
$341,394.05 to $399,165.11. This implies more holding cost for the increasing inventory (Slack,
2015).
Application of SWOT
As the business went to significant loss in week 6, the company has analysed the threats
and weakness, which was evident with significant net loss and increasing operating expenses. In
the seventh week there is no changes made in the report. However, the business operations have
continued for three weeks. The total sales have slightly improved from $ 3,037,480.02 in the 6th
week to $ 3,085,491.52 in the 7th week. The gross profit of the company is depicted as $
1,205,726.71 (Barney & Hesterly, 2015). The segmental results of the gross profit have shown
that the company is able to improve the gross profit in all the segments of Full Cream Milk, Lite
Milk, No Fat Milk, 10kg Milk Powder but not Chocolate Flavoured Milk. The total operating
expenses of the company is seen to be $ 15548439 this is as a result of the fixed costs incurred
week the total cost of goods sold has amounted to $ 2,028,333.34 which is considered have
increased in compared to the previous week (Wheelen et al., 2017).
The significant changes made in the sixth week is depicted with changing the production
of chocolate flavoured milk to 100000 units. In addition to this, the production of the no fat milk
is seen to be 80000 units. There have been significant changes pertaining to payment of full
cream milk, which is changed to 2. The payment made to the lite milk is seen as 3.2. Some of the
other changes is seen to be depicted with the changes pertaining to the significant adjustment
made with production of No Fat milk to 100000 units (Morschett, Schramm-Klein & Zentes,
2015). The total payment for the no fat milk is considered to change to 5 and 10 kg milk power
product is launched. Based on the situational decisions, the sales of the total units have reduced
from 3,152,091.50 in the 5th week to $ 3,037,480.02 in the 6th week. The changes have reduced
the segmental profit in various segments such as Full Cream Milk to $ 320,000.00 from $
400,000.00 and Lite Milk from 480,000.00 to 360,000.00. The total gross profit of the company
was brought down from $1,172,164.88 in week 5 to $1,009,146.68 in week 6. There is
considerable amount of increase in the total operating expenses of 285,484.39 in 6th week from
145,082.54 in 5th week. The net income before tax came down from $1,053,613.67 to $
758,897.63. Henceforth, this simulation is not recommended. The inventory has increased from
$341,394.05 to $399,165.11. This implies more holding cost for the increasing inventory (Slack,
2015).
Application of SWOT
As the business went to significant loss in week 6, the company has analysed the threats
and weakness, which was evident with significant net loss and increasing operating expenses. In
the seventh week there is no changes made in the report. However, the business operations have
continued for three weeks. The total sales have slightly improved from $ 3,037,480.02 in the 6th
week to $ 3,085,491.52 in the 7th week. The gross profit of the company is depicted as $
1,205,726.71 (Barney & Hesterly, 2015). The segmental results of the gross profit have shown
that the company is able to improve the gross profit in all the segments of Full Cream Milk, Lite
Milk, No Fat Milk, 10kg Milk Powder but not Chocolate Flavoured Milk. The total operating
expenses of the company is seen to be $ 15548439 this is as a result of the fixed costs incurred
⊘ This is a preview!⊘
Do you want full access?
Subscribe today to unlock all pages.
Trusted by 1+ million students worldwide
6STRATEGIC MANAGEMENT
by the company. The net income before tax and net income is depicted to be $1,098,989.16. The
closing cash position for the month of April will be $3,948,494.51. The inventory units have
increased to 117.109 with a total inventory value of $ 407619.47 (Rothaermel, 2015).
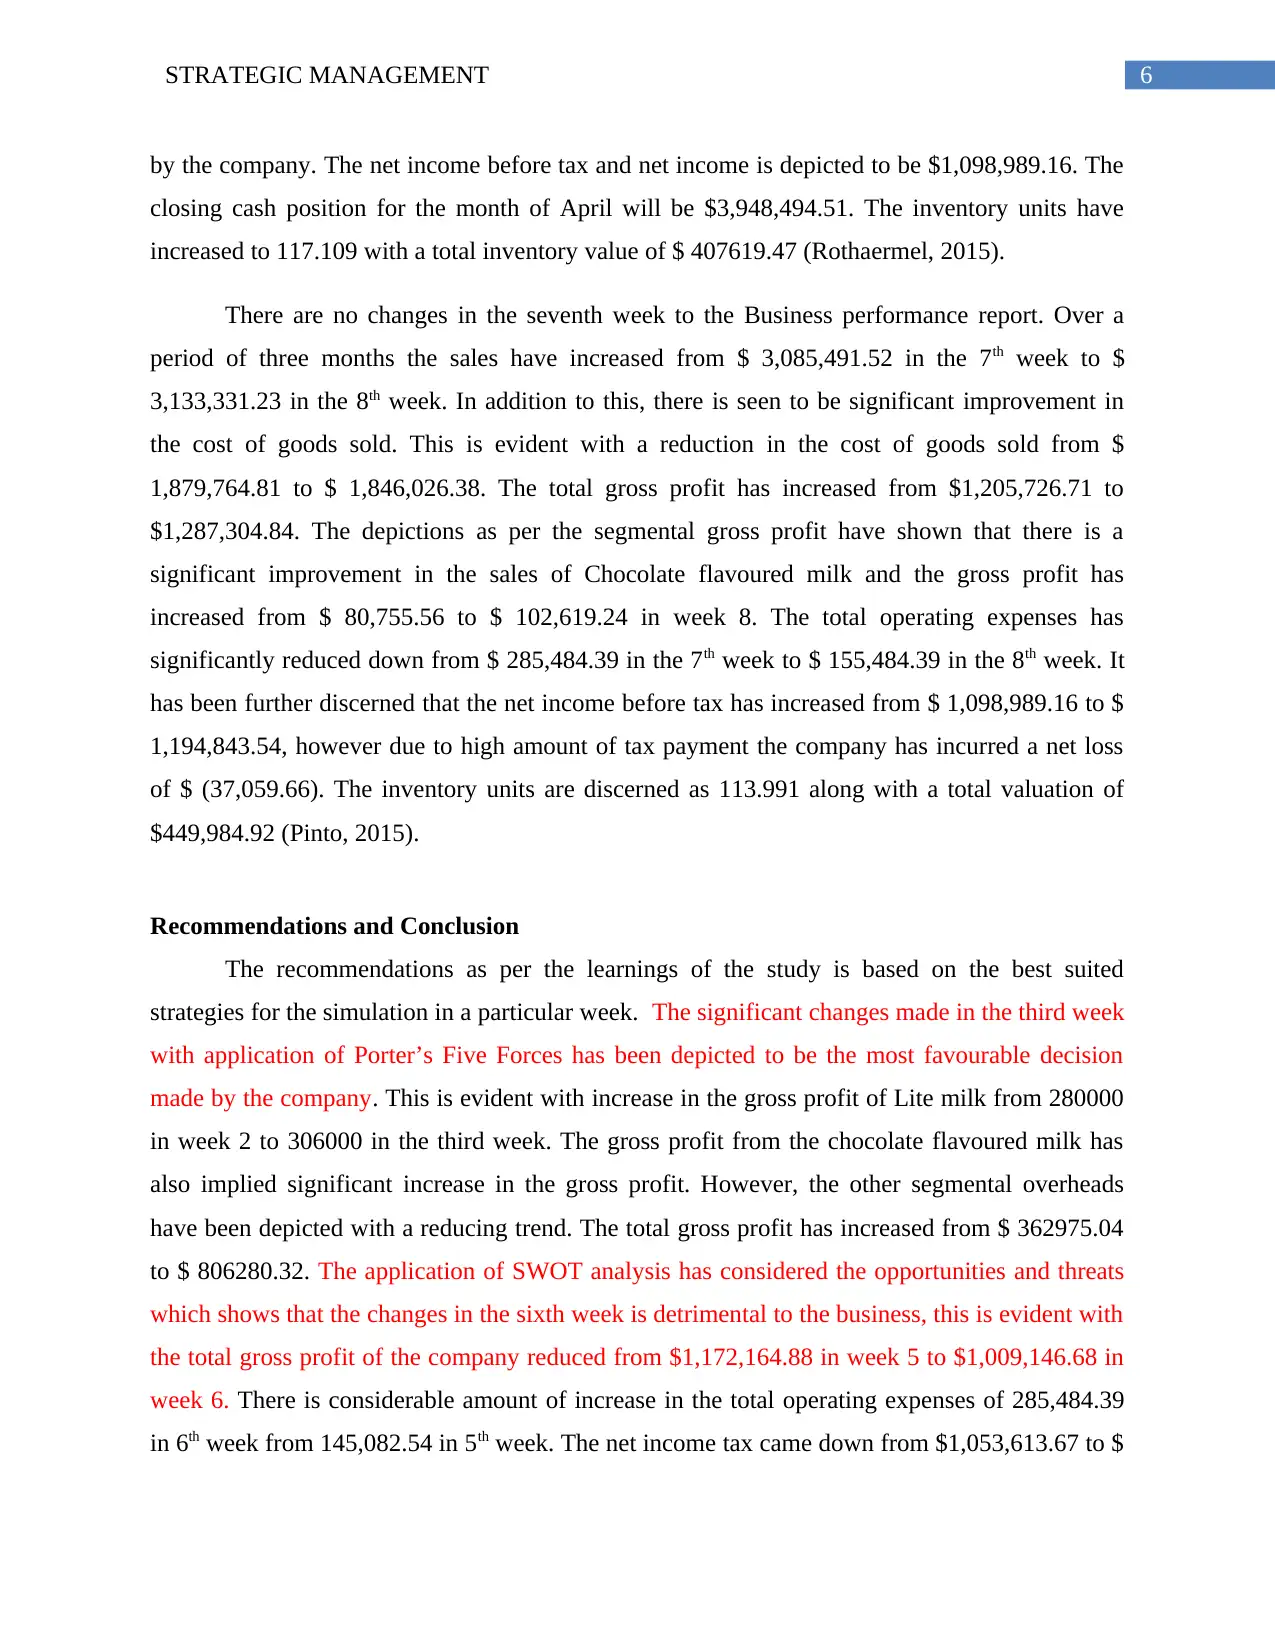
There are no changes in the seventh week to the Business performance report. Over a
period of three months the sales have increased from $ 3,085,491.52 in the 7th week to $
3,133,331.23 in the 8th week. In addition to this, there is seen to be significant improvement in
the cost of goods sold. This is evident with a reduction in the cost of goods sold from $
1,879,764.81 to $ 1,846,026.38. The total gross profit has increased from $1,205,726.71 to
$1,287,304.84. The depictions as per the segmental gross profit have shown that there is a
significant improvement in the sales of Chocolate flavoured milk and the gross profit has
increased from $ 80,755.56 to $ 102,619.24 in week 8. The total operating expenses has
significantly reduced down from $ 285,484.39 in the 7th week to $ 155,484.39 in the 8th week. It
has been further discerned that the net income before tax has increased from $ 1,098,989.16 to $
1,194,843.54, however due to high amount of tax payment the company has incurred a net loss
of $ (37,059.66). The inventory units are discerned as 113.991 along with a total valuation of
$449,984.92 (Pinto, 2015).
Recommendations and Conclusion
The recommendations as per the learnings of the study is based on the best suited
strategies for the simulation in a particular week. The significant changes made in the third week
with application of Porter’s Five Forces has been depicted to be the most favourable decision
made by the company. This is evident with increase in the gross profit of Lite milk from 280000
in week 2 to 306000 in the third week. The gross profit from the chocolate flavoured milk has
also implied significant increase in the gross profit. However, the other segmental overheads
have been depicted with a reducing trend. The total gross profit has increased from $ 362975.04
to $ 806280.32. The application of SWOT analysis has considered the opportunities and threats
which shows that the changes in the sixth week is detrimental to the business, this is evident with
the total gross profit of the company reduced from $1,172,164.88 in week 5 to $1,009,146.68 in
week 6. There is considerable amount of increase in the total operating expenses of 285,484.39
in 6th week from 145,082.54 in 5th week. The net income tax came down from $1,053,613.67 to $
by the company. The net income before tax and net income is depicted to be $1,098,989.16. The
closing cash position for the month of April will be $3,948,494.51. The inventory units have
increased to 117.109 with a total inventory value of $ 407619.47 (Rothaermel, 2015).
There are no changes in the seventh week to the Business performance report. Over a
period of three months the sales have increased from $ 3,085,491.52 in the 7th week to $
3,133,331.23 in the 8th week. In addition to this, there is seen to be significant improvement in
the cost of goods sold. This is evident with a reduction in the cost of goods sold from $
1,879,764.81 to $ 1,846,026.38. The total gross profit has increased from $1,205,726.71 to
$1,287,304.84. The depictions as per the segmental gross profit have shown that there is a
significant improvement in the sales of Chocolate flavoured milk and the gross profit has
increased from $ 80,755.56 to $ 102,619.24 in week 8. The total operating expenses has
significantly reduced down from $ 285,484.39 in the 7th week to $ 155,484.39 in the 8th week. It
has been further discerned that the net income before tax has increased from $ 1,098,989.16 to $
1,194,843.54, however due to high amount of tax payment the company has incurred a net loss
of $ (37,059.66). The inventory units are discerned as 113.991 along with a total valuation of
$449,984.92 (Pinto, 2015).
Recommendations and Conclusion
The recommendations as per the learnings of the study is based on the best suited
strategies for the simulation in a particular week. The significant changes made in the third week
with application of Porter’s Five Forces has been depicted to be the most favourable decision
made by the company. This is evident with increase in the gross profit of Lite milk from 280000
in week 2 to 306000 in the third week. The gross profit from the chocolate flavoured milk has
also implied significant increase in the gross profit. However, the other segmental overheads
have been depicted with a reducing trend. The total gross profit has increased from $ 362975.04
to $ 806280.32. The application of SWOT analysis has considered the opportunities and threats
which shows that the changes in the sixth week is detrimental to the business, this is evident with
the total gross profit of the company reduced from $1,172,164.88 in week 5 to $1,009,146.68 in
week 6. There is considerable amount of increase in the total operating expenses of 285,484.39
in 6th week from 145,082.54 in 5th week. The net income tax came down from $1,053,613.67 to $
Paraphrase This Document
Need a fresh take? Get an instant paraphrase of this document with our AI Paraphraser
7STRATEGIC MANAGEMENT
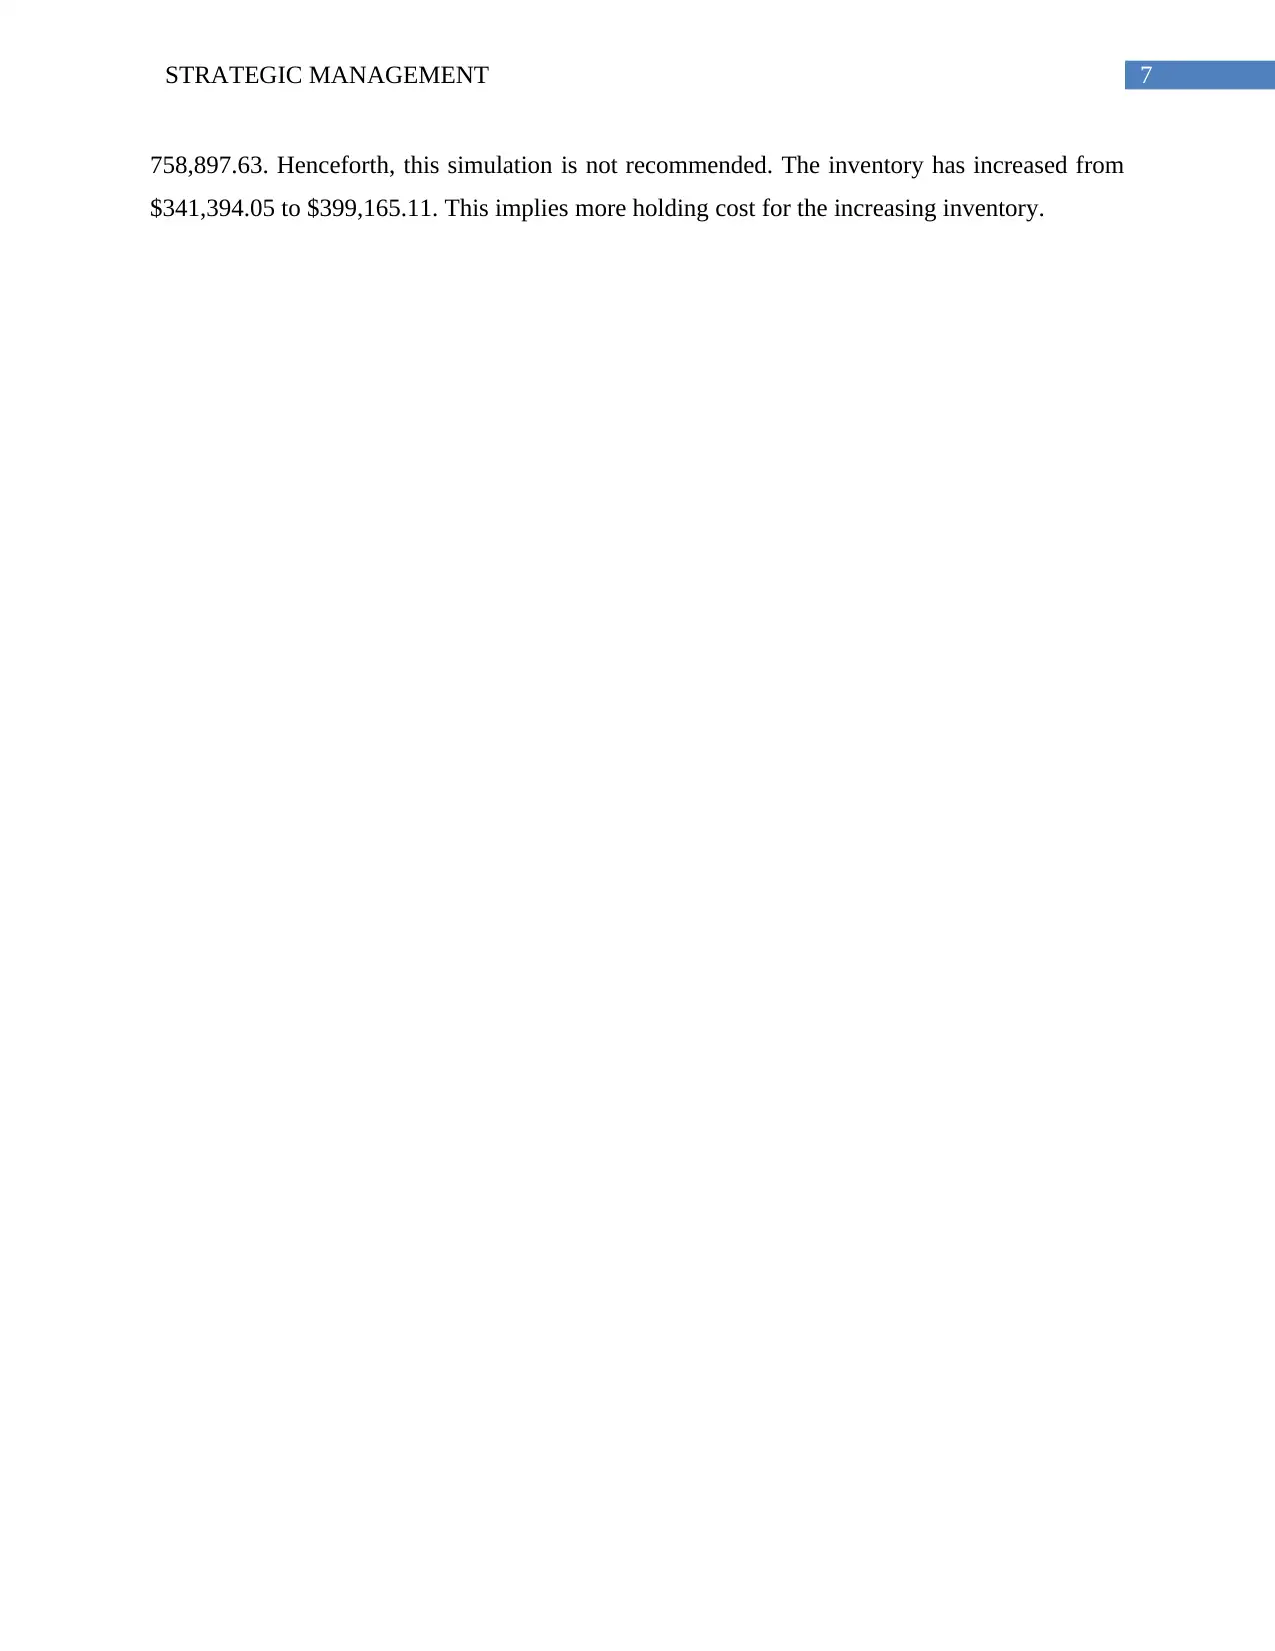
758,897.63. Henceforth, this simulation is not recommended. The inventory has increased from
$341,394.05 to $399,165.11. This implies more holding cost for the increasing inventory.
758,897.63. Henceforth, this simulation is not recommended. The inventory has increased from
$341,394.05 to $399,165.11. This implies more holding cost for the increasing inventory.
8STRATEGIC MANAGEMENT
References
Barney, J. B. (2014). Gaining and sustaining competitive advantage. Pearson higher ed.
Barney, J. B., & Hesterly, W. (2015). Strategic management and competitive advantage
concepts and cases. Pearson.
Bryce, H. J. (2017). Financial and strategic management for nonprofit organizations. Walter de
Gruyter GmbH & Co KG.
Daspit, J. J., Chrisman, J. J., Sharma, P., Pearson, A. W., & Long, R. G. (2017). A strategic
management perspective of the family firm: Past trends, new insights, and future
directions. Journal of Managerial Issues, 29(1), 6.
Ginter, P. M., Duncan, J., & Swayne, L. E. (2018). The Strategic Management of Healthcare
Organizations. John Wiley & Sons.
Hill, C. W., Jones, G. R., & Schilling, M. A. (2014). Strategic management: theory: an
integrated approach. Cengage Learning.
Morschett, D., Schramm-Klein, H., & Zentes, J. (2015). Strategic international management (pp.
978-3658078836). Springer.
Pinto, J. K. (2015). Project management: achieving competitive advantage. Prentice Hall.
Rothaermel, F. T. (2015). Strategic management. McGraw-Hill Education.
Slack, N. (2015). Operations strategy. John Wiley & Sons, Ltd.
Steinbach, A. L., Holcomb, T. R., Holmes, R. M., Devers, C. E., & Cannella, A. A. (2017). Top
management team incentive heterogeneity, strategic investment behavior, and
performance: A contingency theory of incentive alignment. Strategic Management
Journal, 38(8), 1701-1720.
Wheelen, T. L., Hunger, J. D., Hoffman, A. N., & Bamford, C. E. (2017). Strategic management
and business policy. pearson.
⊘ This is a preview!⊘
Do you want full access?
Subscribe today to unlock all pages.
Trusted by 1+ million students worldwide

9STRATEGIC MANAGEMENT
1 out of 10
Related Documents


Your All-in-One AI-Powered Toolkit for Academic Success.
+13062052269
info@desklib.com
Available 24*7 on WhatsApp / Email
![[object Object]](/_next/static/media/star-bottom.7253800d.svg)
Unlock your academic potential
Copyright © 2020–2026 A2Z Services. All Rights Reserved. Developed and managed by ZUCOL.