Dairy Product Strategic Management: SWOT, PEST, and Five Forces

Verified

Added on  2023/06/16

|18
|1481
|87
Report
AI Summary
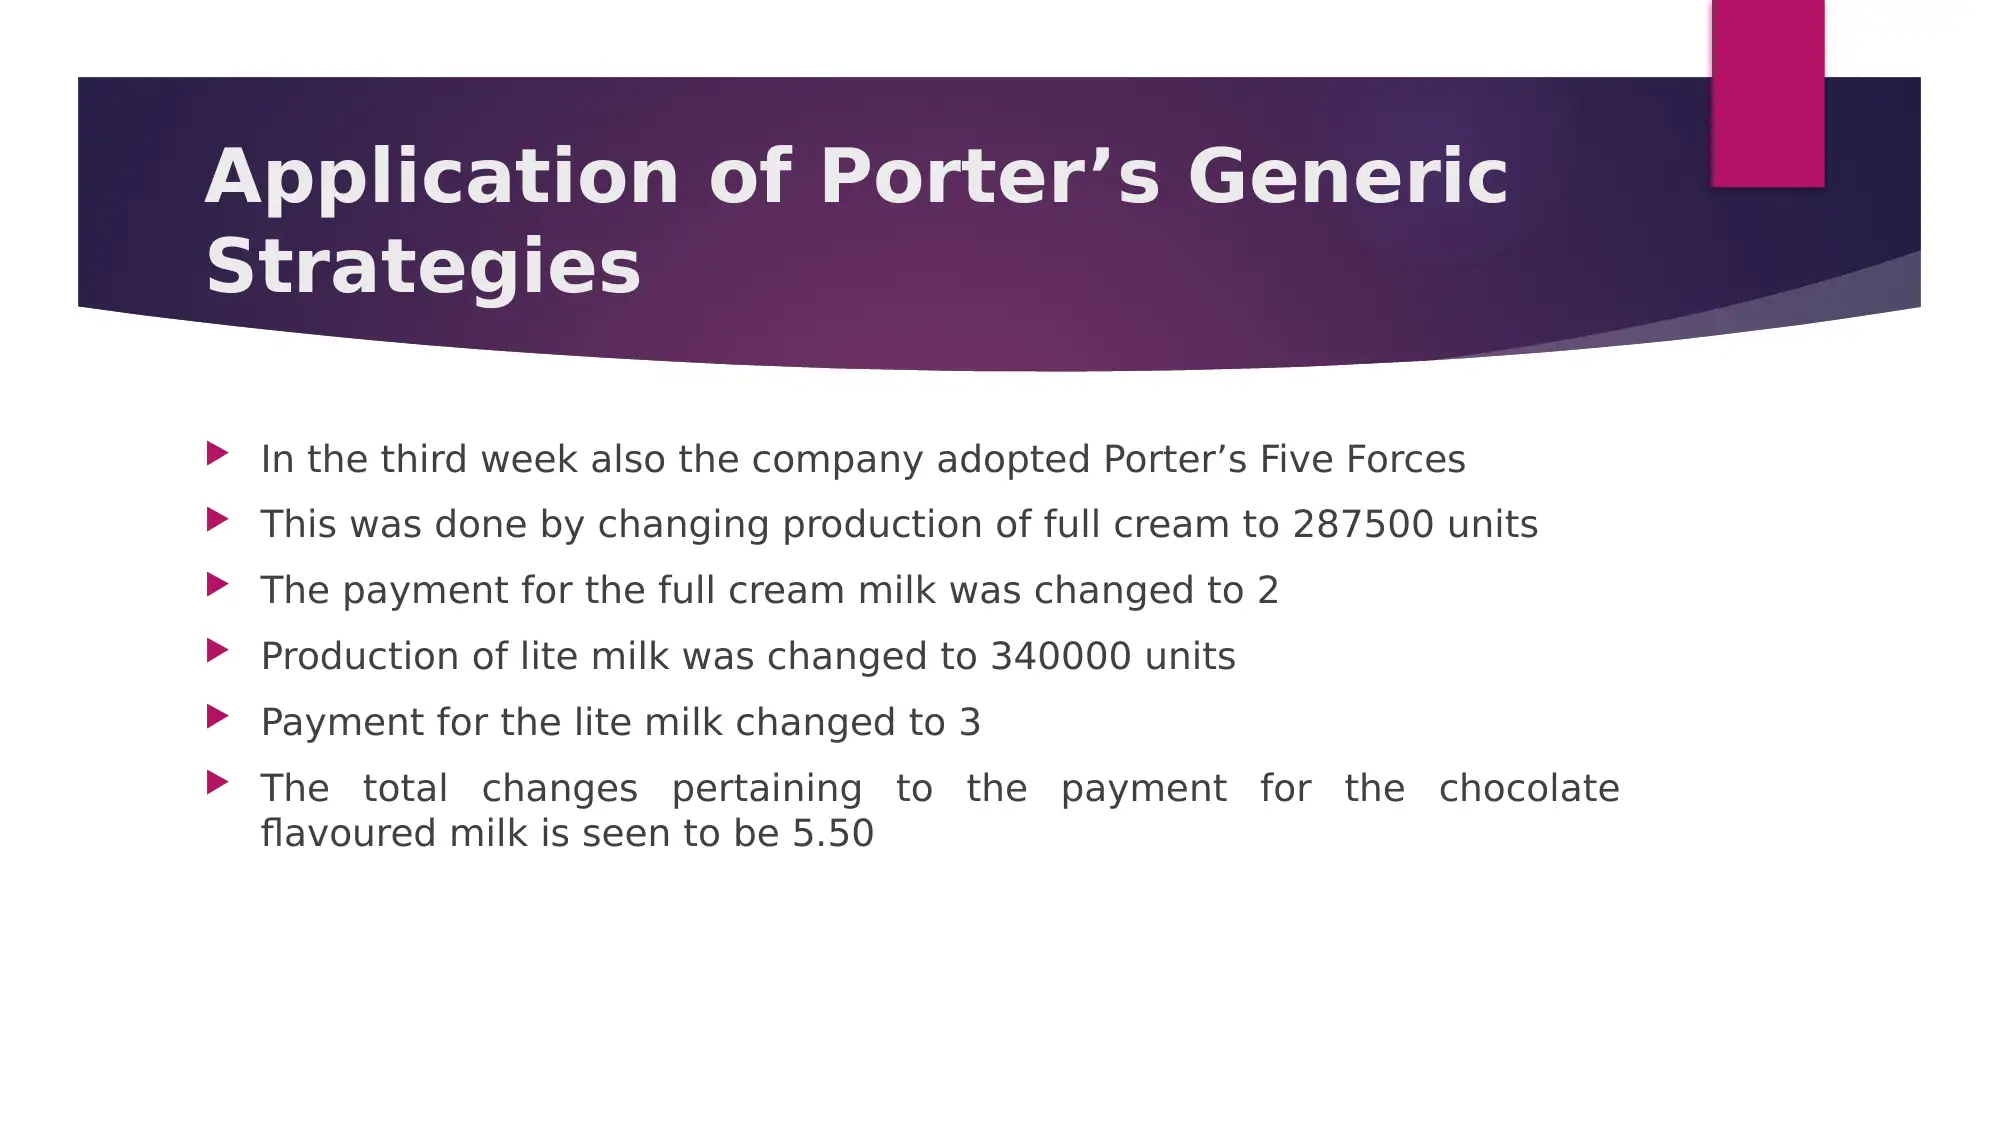
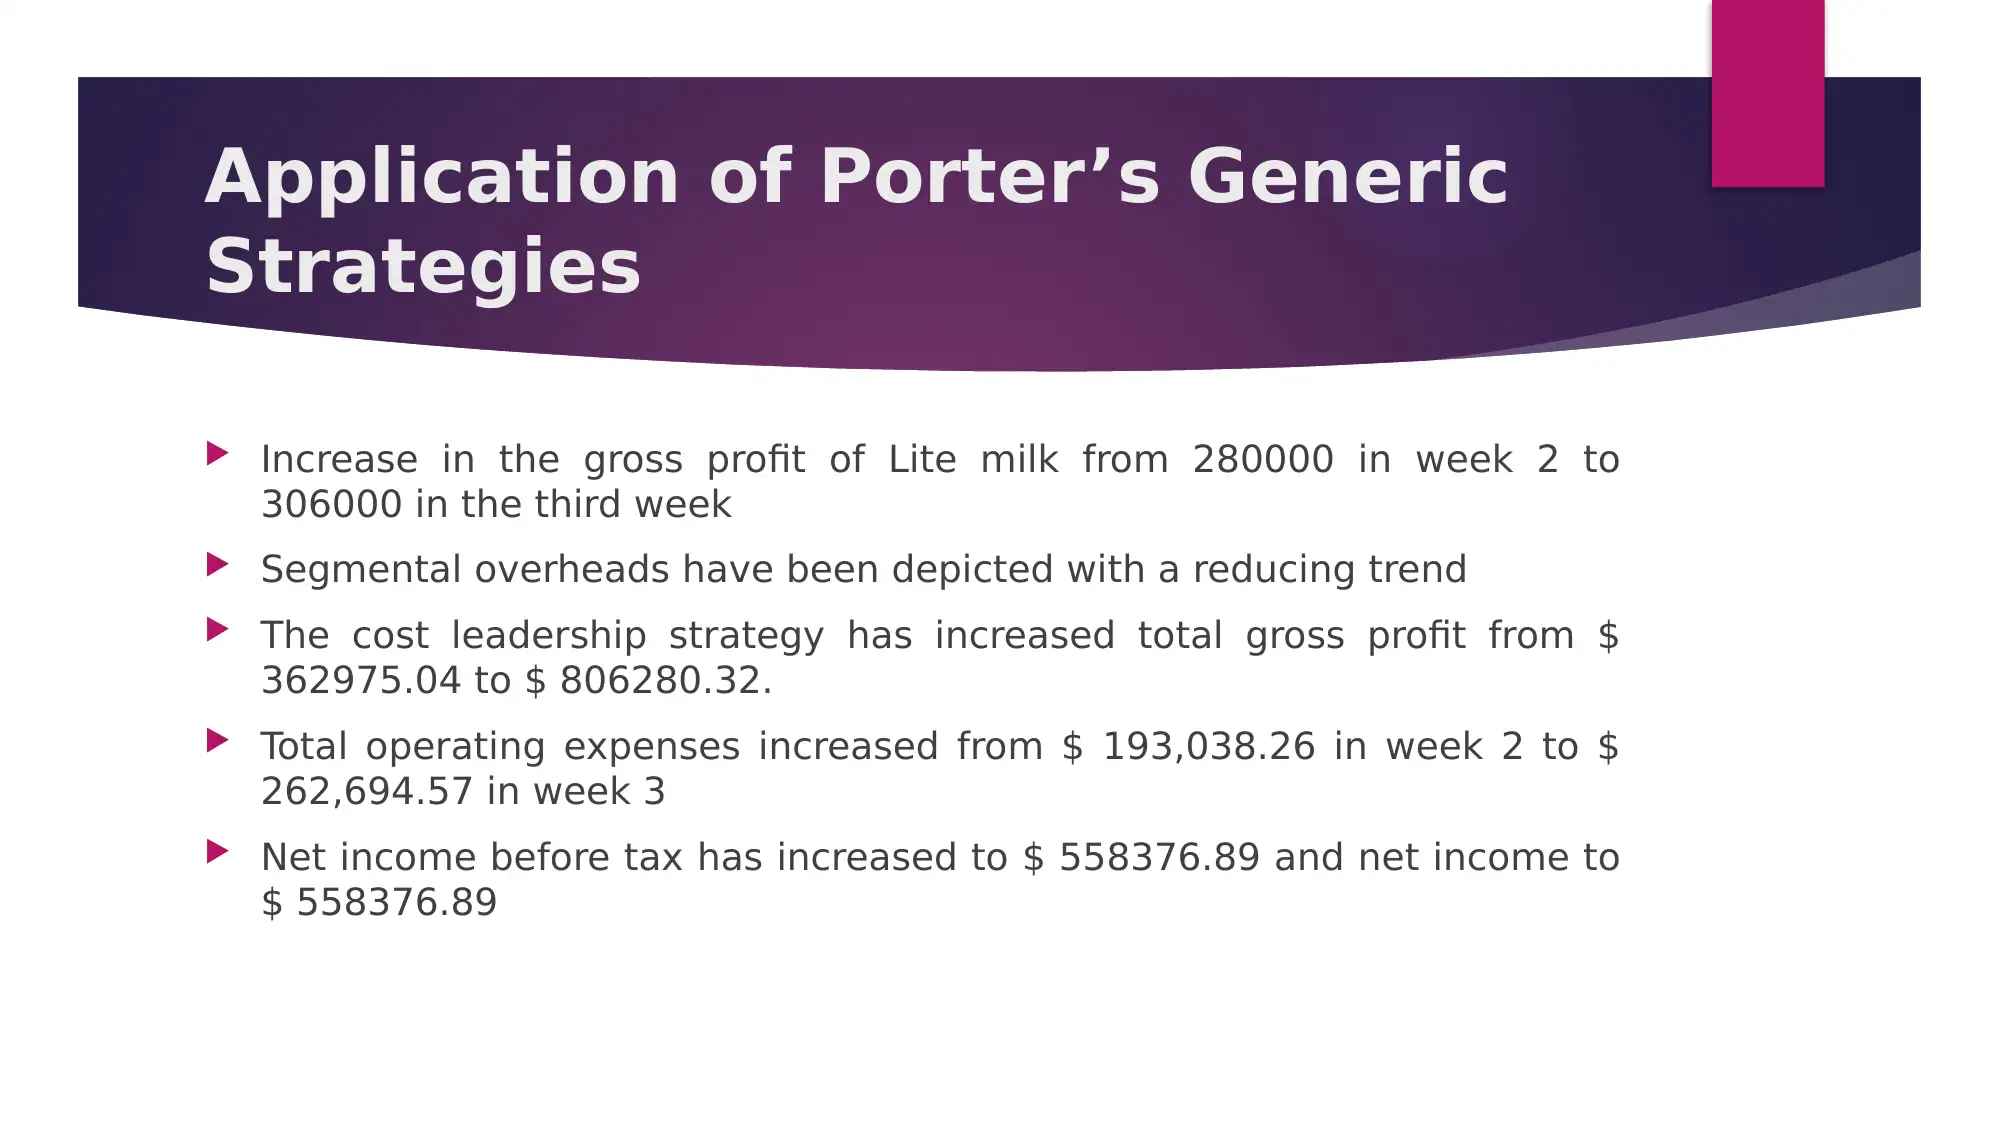
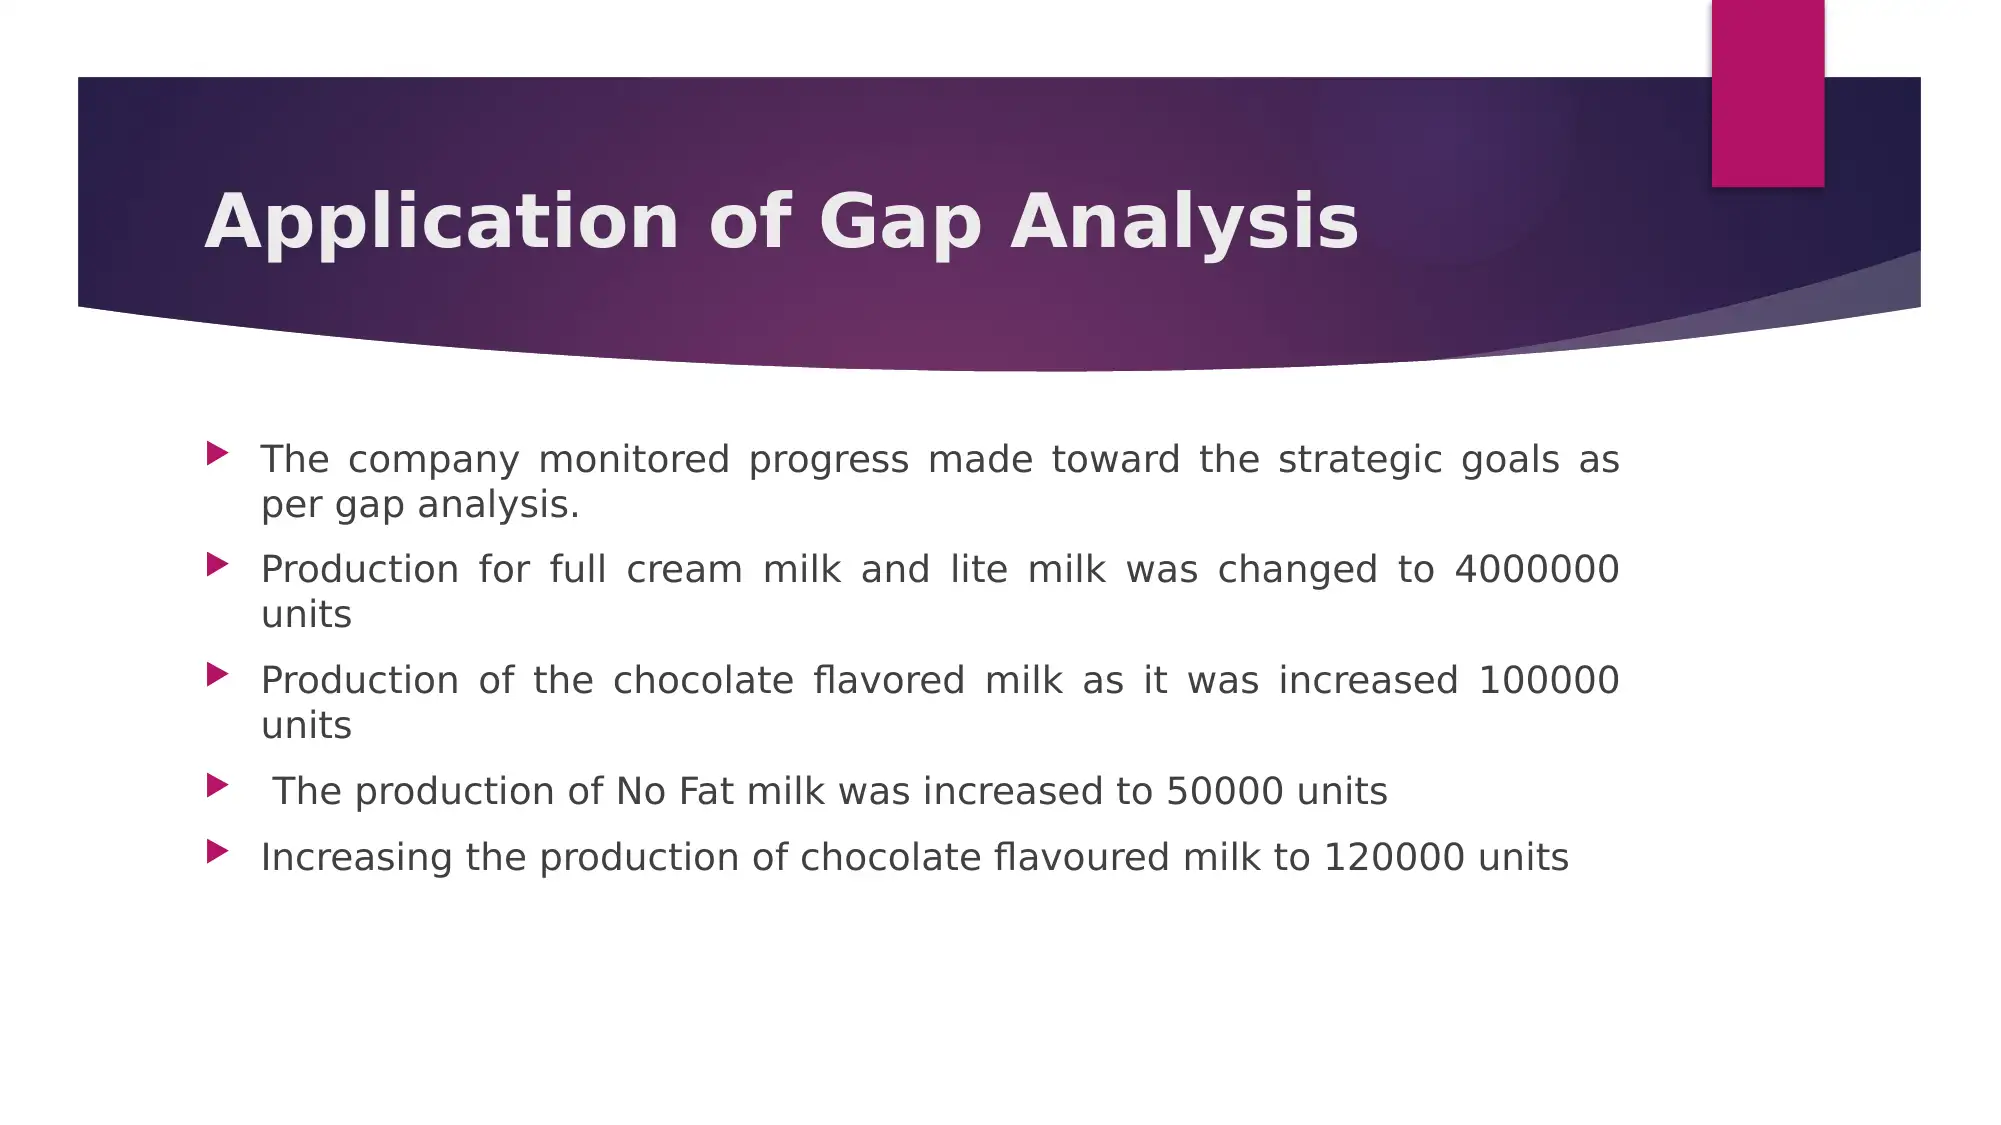
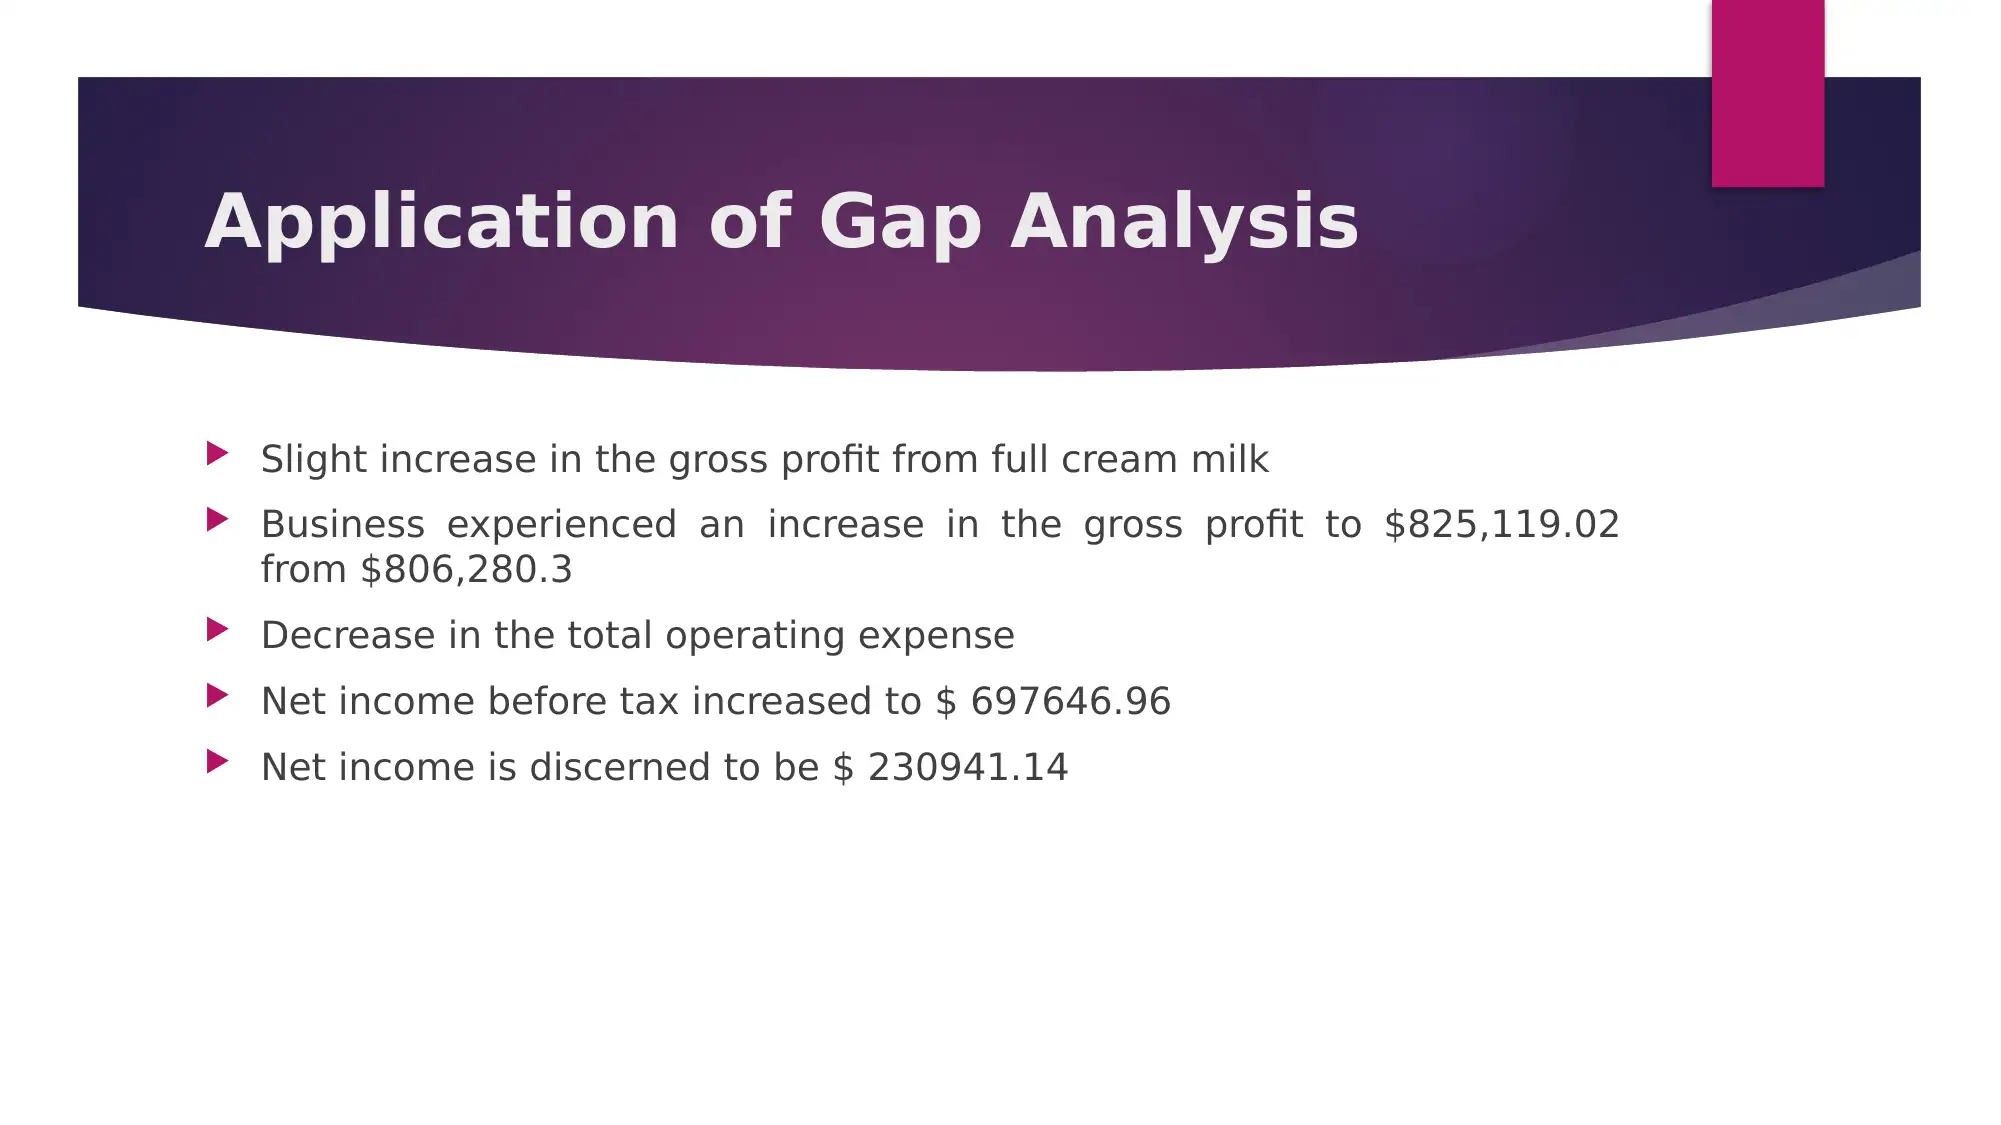
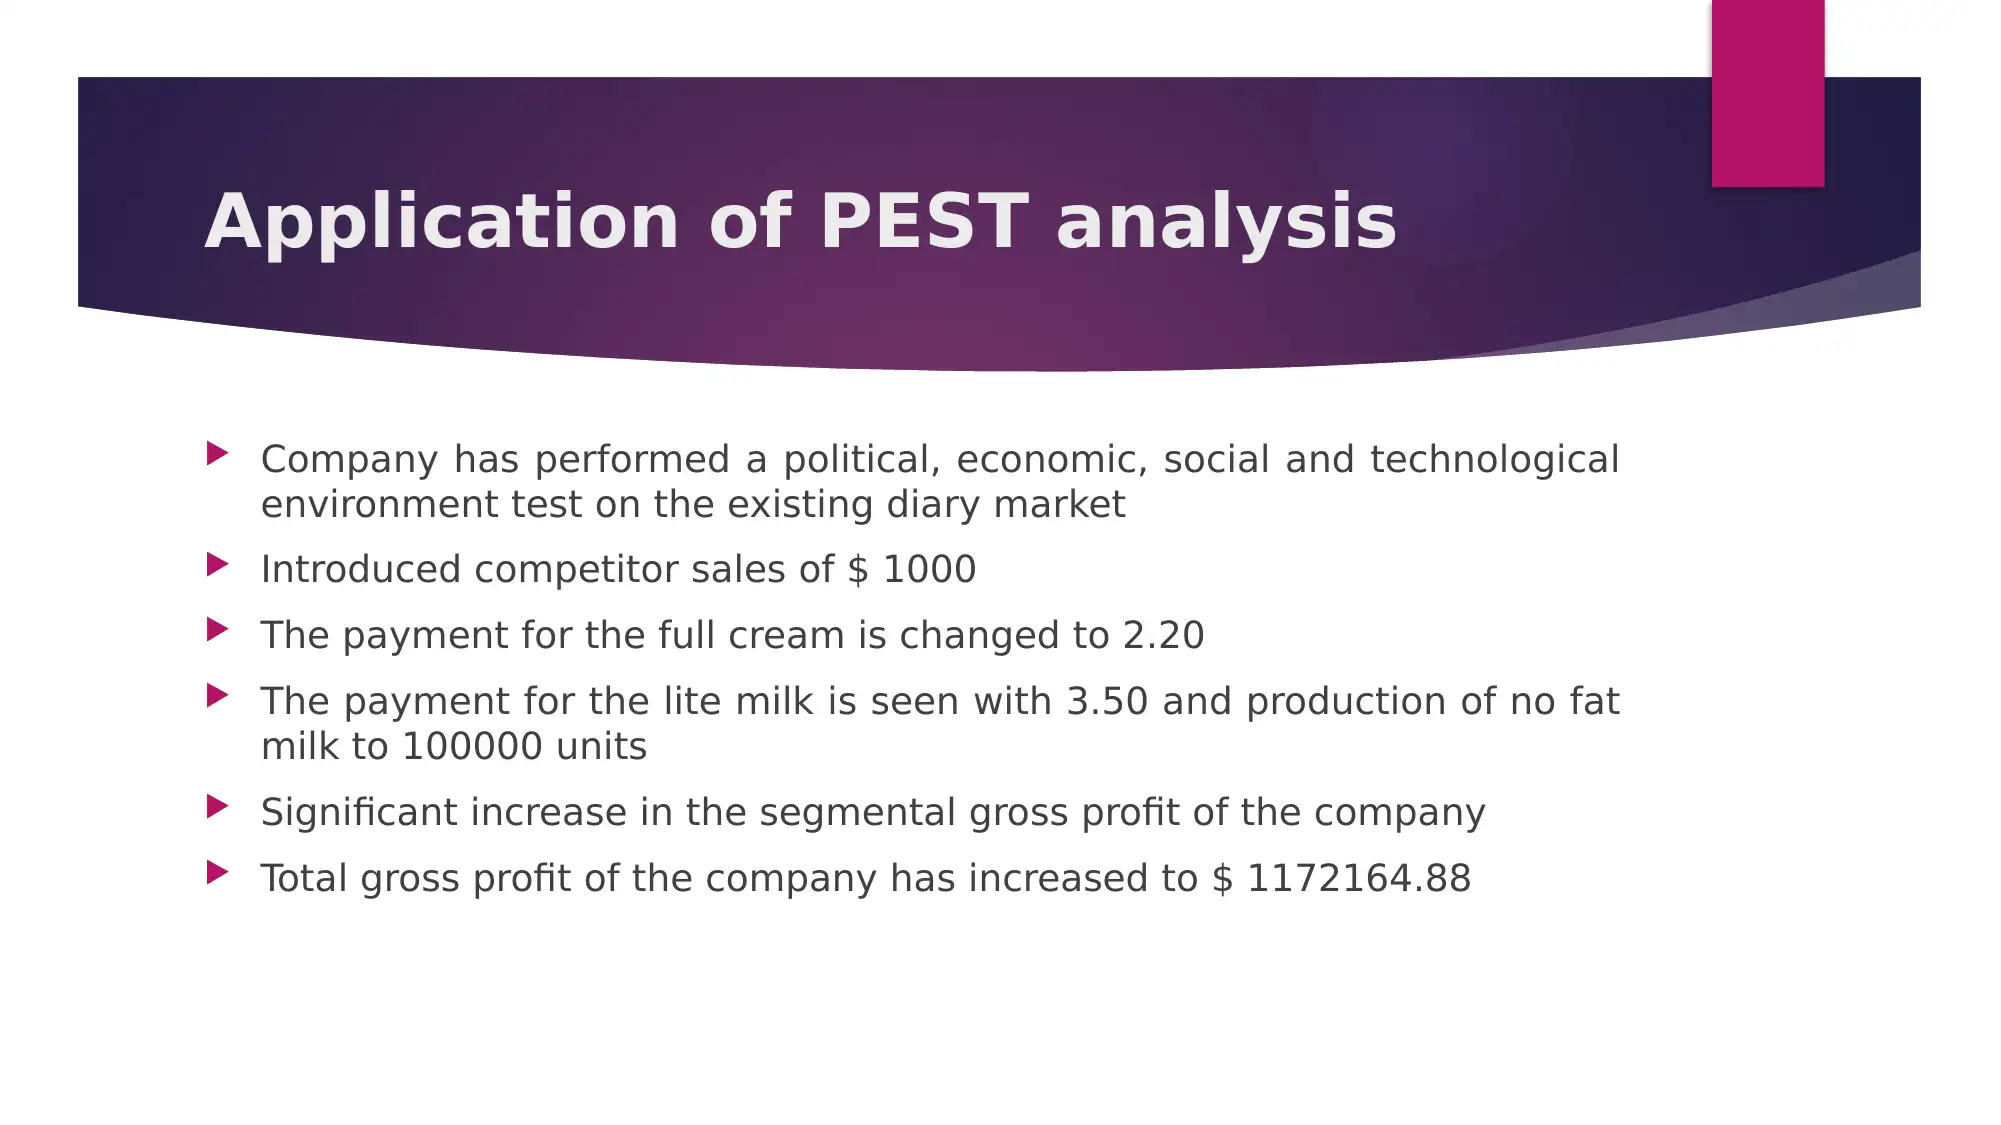
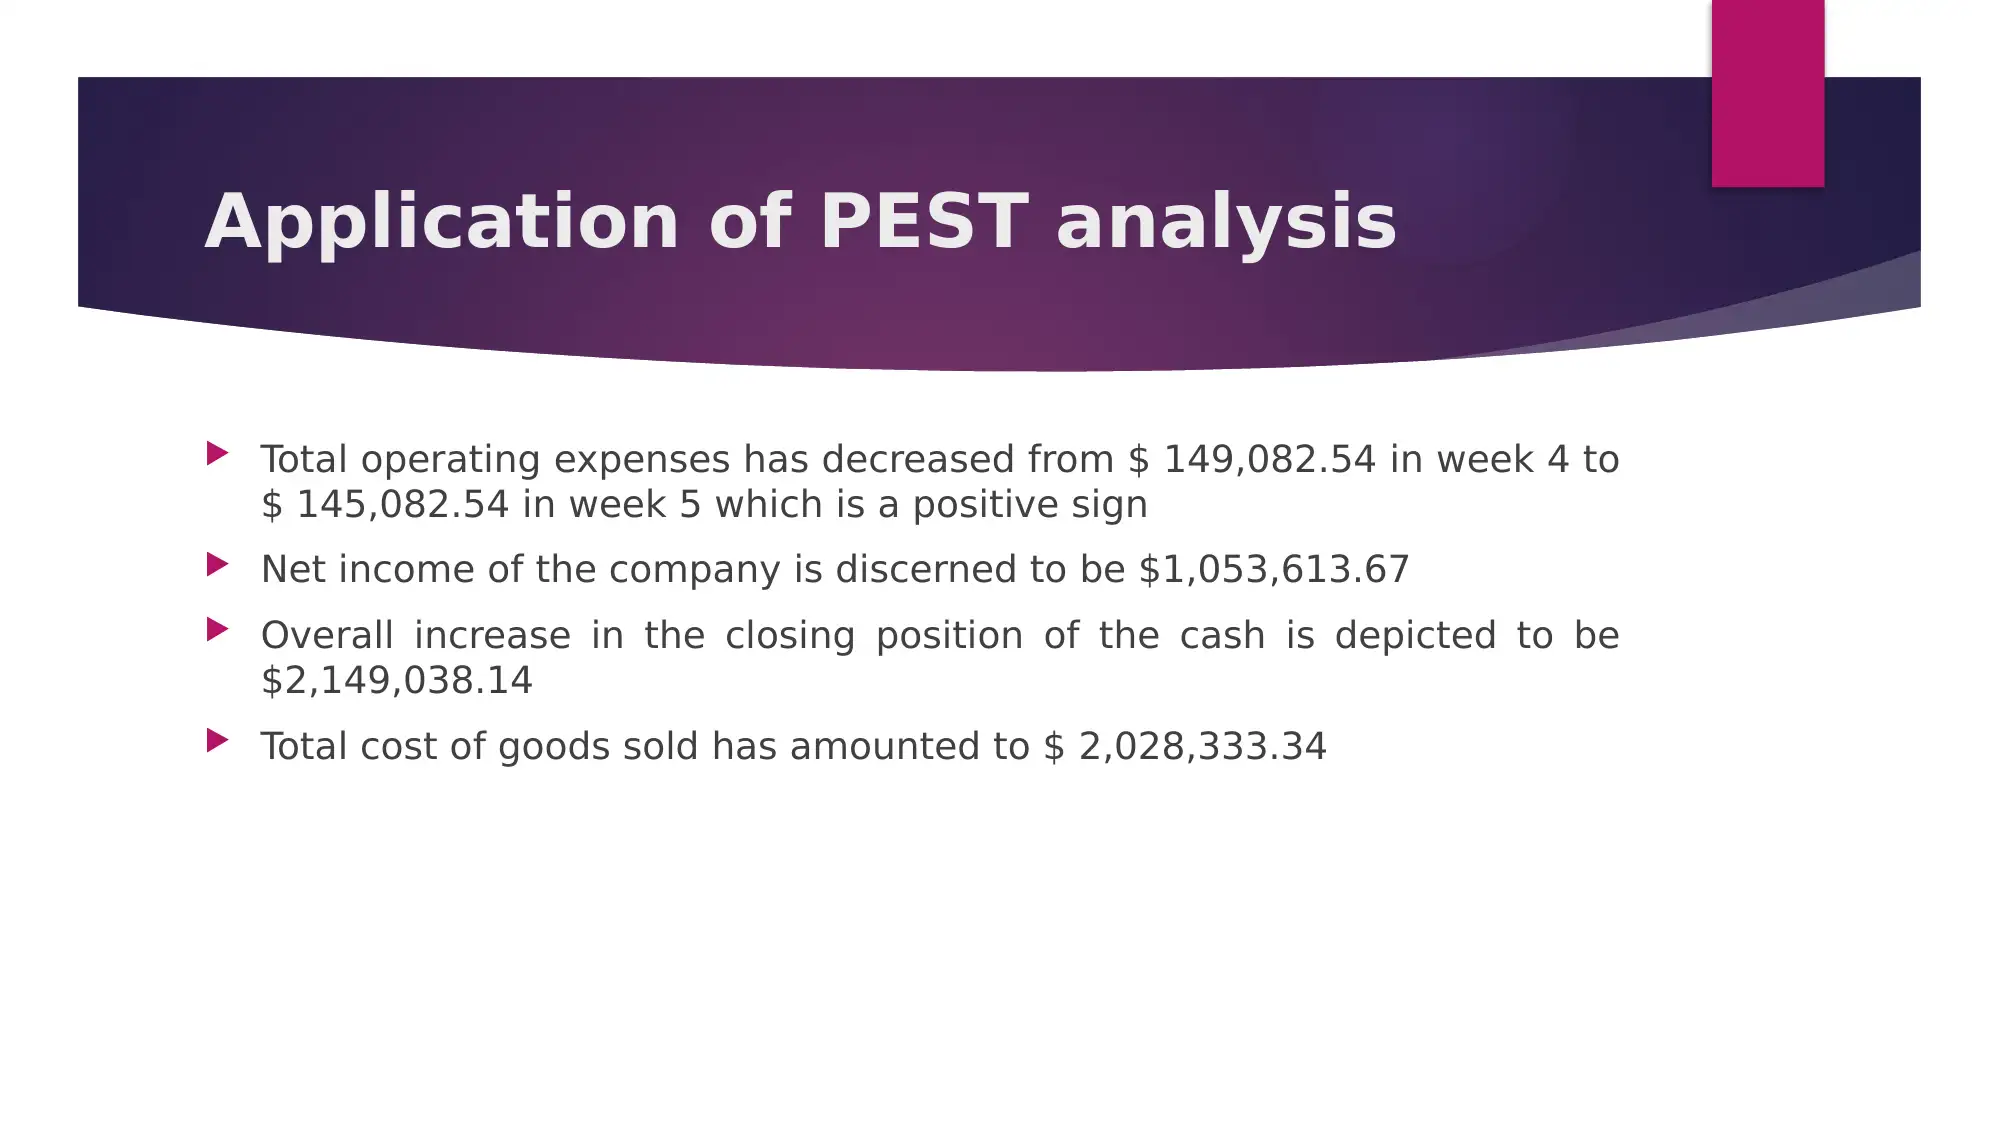
This report provides a strategic management analysis of changes made to dairy products over eight weeks, utilizing tools such as SWOT, Gap, PEST, and Five Forces analysis. It examines the market environment and the impact of cost leadership strategies implemented, focusing on gross profit earnings from various products like full cream, lite cream, chocolate flavored milk, and no-fat milk. The report tracks key financial indicators including operating expenses, net income, cash position, and inventory value across consecutive weeks. It identifies the most and least favorable strategic tools applied, highlighting the positive impact of Porter's Five Forces in the third week and the detrimental effects of strategies employed in the sixth week. The analysis concludes with recommendations based on the simulation results and includes references to relevant strategic management literature. Desklib provides access to this and other solved assignments.
Document Page
Strategic Management
tabler-icon-diamond-filled.svg

Paraphrase This Document

Need a fresh take? Get an instant paraphrase of this document with our AI Paraphraser
Document Page
Introduction
The learnings will demonstrate critique for the changes made to the
dairy products
Changes and the interpretations are identified in terms of using
strategic management tools such as SWOT Analysis, Gap Analysis, PEST
Analysis and Five Forces Analysis
Overall implication of the changes which are made in the consecutive
weeks over 8 weeks
Recommending on the best simulation strategy
Document Page
Application of five forces
analysis
Study of the present market environment with application of five forces analysis
Segmental interpretation of the data are performed with the inclusion of results of
gross profit earnings from full cream, lite cream, chocolate flavoured milk, no fat milk
Gross profit generated from full cream is depicted as $ 320000, lite cream as $
280000, chocolate flavoured milk as $ 78639.53 and no fat milk as $ 146479.48
Total operating cost is considered with fixed costs, cost of goods expired, expansion of
production, reporting costs and depreciation expenses
Document Page
Business Performance Report
Week 1
Total operating expenses is depicted as $ 149083.54
Net income before tax is observed to be $ 697646.96 and tax amount
as $ 466705.82.
Total net income for the company in the first week was $ 230941.14
Cash position of the company is $ 1283743.28
Inventory value is seen to be $ 149177.74 for a total of 34077 units.
tabler-icon-diamond-filled.svg

Paraphrase This Document

Need a fresh take? Get an instant paraphrase of this document with our AI Paraphraser
Document Page
Application of Porter’s Generic
Strategies
Second week onwards the company focused on the implementation of
cost leadership strategy.
Changed the production of lite milk to 350000 units
Payment for the lite milk is changed to 2.5
Again Changed the production of lite milk to 330000
Changed the Production of full cream milk to 350000 units
Changed the production of chocolate flavoured milk to 110000 units
and production of lite milk to 340000 units and payment of full cream
milk to 1.5
Document Page
Application of Porter’s Generic
Strategies
Gross profit was changed to $ 362975.04
Significant increase in all the respective segments and total gross profit
Gross profit was evaluated as $ 140000 for full cream milk, 136000 for
lite milk and 86975.04 for chocolate flavour milk
Increase in the total operating expenses of $ 193038.26 compared to
93038.26 in week 1
Net income before tax valued at $ 177607.94 which is an increase from
$ 122054.28 in the previous week
Document Page
Application of Porter’s Generic
Strategies
In the third week also the company adopted Porter’s Five Forces
This was done by changing production of full cream to 287500 units
The payment for the full cream milk was changed to 2
Production of lite milk was changed to 340000 units
Payment for the lite milk changed to 3
The total changes pertaining to the payment for the chocolate
flavoured milk is seen to be 5.50
tabler-icon-diamond-filled.svg

Paraphrase This Document

Need a fresh take? Get an instant paraphrase of this document with our AI Paraphraser
Document Page
Application of Porter’s Generic
Strategies
Increase in the gross profit of Lite milk from 280000 in week 2 to
306000 in the third week
Segmental overheads have been depicted with a reducing trend
The cost leadership strategy has increased total gross profit from $
362975.04 to $ 806280.32.
Total operating expenses increased from $ 193,038.26 in week 2 to $
262,694.57 in week 3
Net income before tax has increased to $ 558376.89 and net income to
$ 558376.89
Document Page
Application of Gap Analysis
The company monitored progress made toward the strategic goals as
per gap analysis.
Production for full cream milk and lite milk was changed to 4000000
units
Production of the chocolate flavored milk as it was increased 100000
units
The production of No Fat milk was increased to 50000 units
Increasing the production of chocolate flavoured milk to 120000 units
Document Page
Application of Gap Analysis
Slight increase in the gross profit from full cream milk
Business experienced an increase in the gross profit to $825,119.02
from $806,280.3
Decrease in the total operating expense
Net income before tax increased to $ 697646.96
Net income is discerned to be $ 230941.14
tabler-icon-diamond-filled.svg

Paraphrase This Document

Need a fresh take? Get an instant paraphrase of this document with our AI Paraphraser
Document Page
Application of PEST analysis
Company has performed a political, economic, social and technological
environment test on the existing diary market
Introduced competitor sales of $ 1000
The payment for the full cream is changed to 2.20
The payment for the lite milk is seen with 3.50 and production of no fat
milk to 100000 units
Significant increase in the segmental gross profit of the company
Total gross profit of the company has increased to $ 1172164.88
Document Page
Application of PEST analysis
Total operating expenses has decreased from $ 149,082.54 in week 4 to
$ 145,082.54 in week 5 which is a positive sign
Net income of the company is discerned to be $1,053,613.67
Overall increase in the closing position of the cash is depicted to be
$2,149,038.14
Total cost of goods sold has amounted to $ 2,028,333.34
chevron_up_icon
1 out of 18
circle_padding
hide_on_mobile
zoom_out_icon
[object Object]