Strategic Management Report: Analysis of Hershey Company's Strategy

Verified

Added on  2022/08/23

|14
|1256
|15
Report
AI Summary
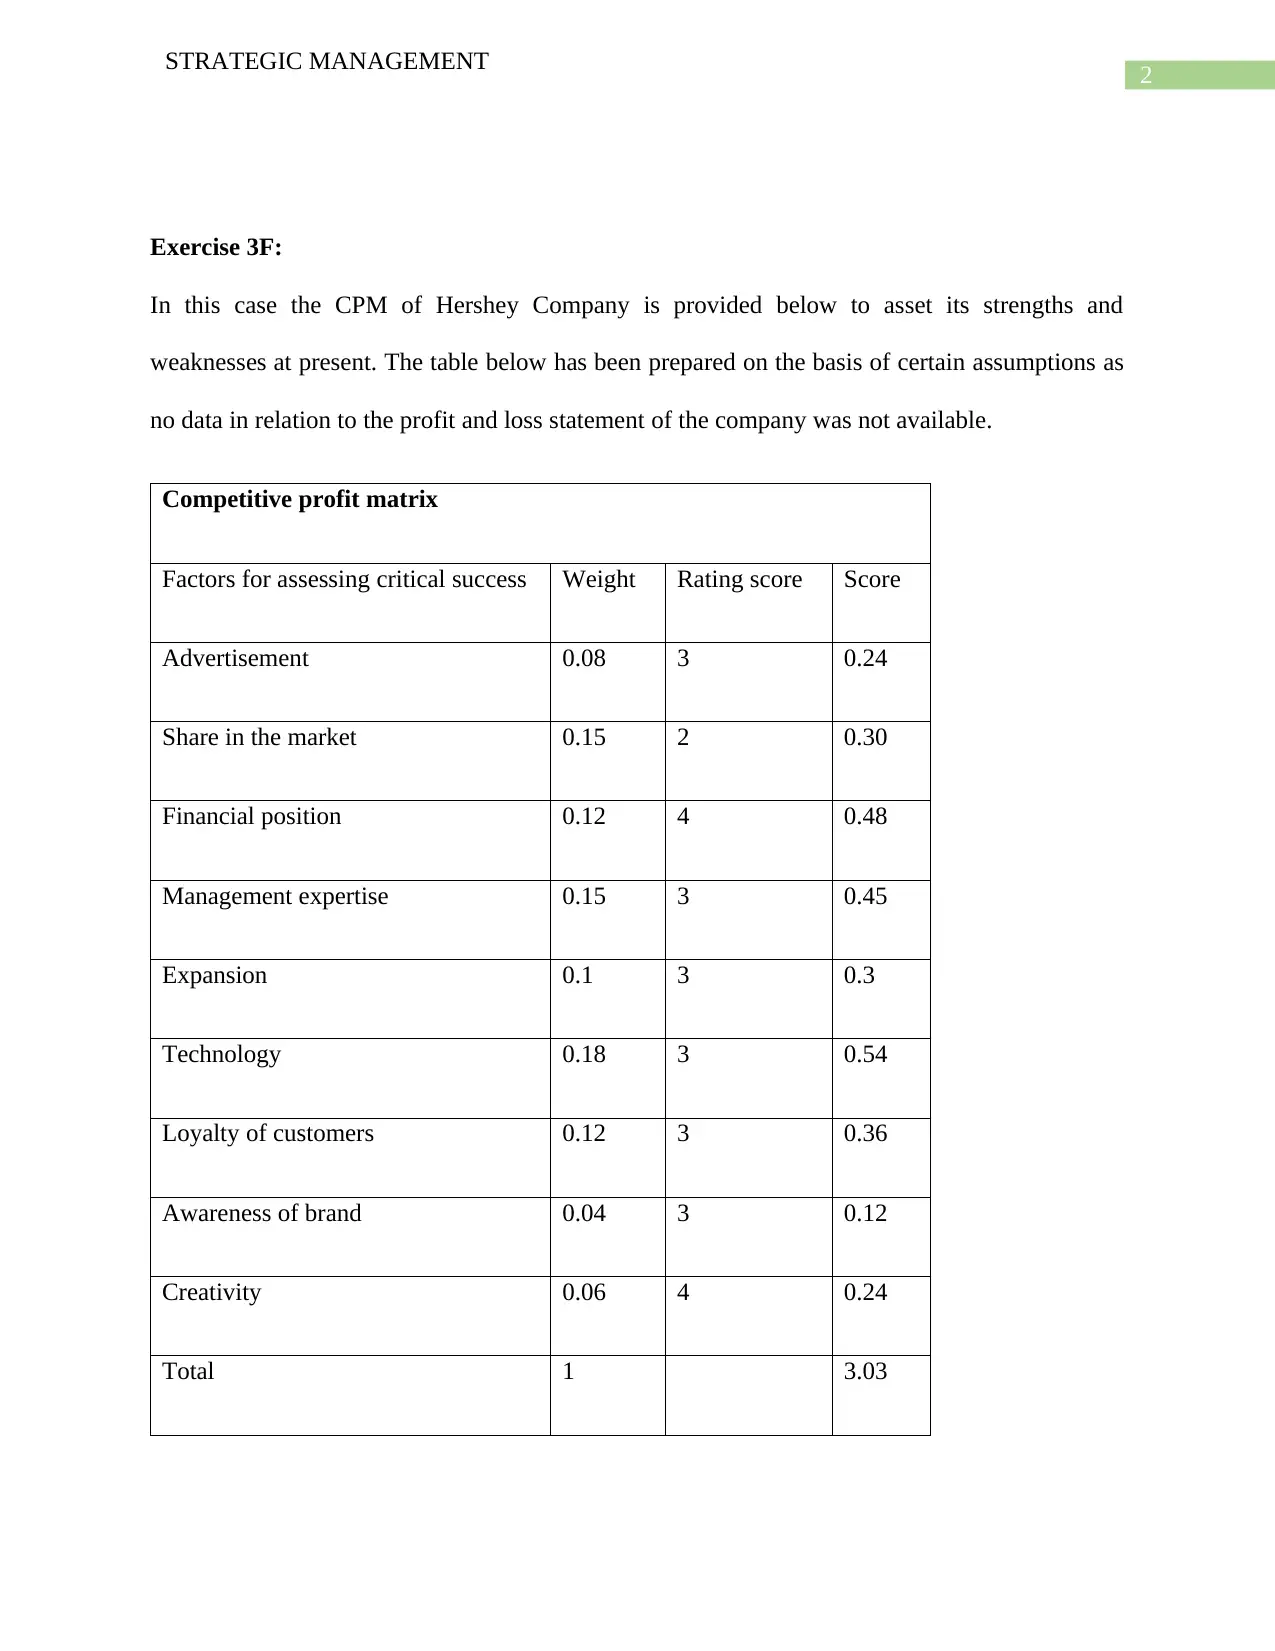
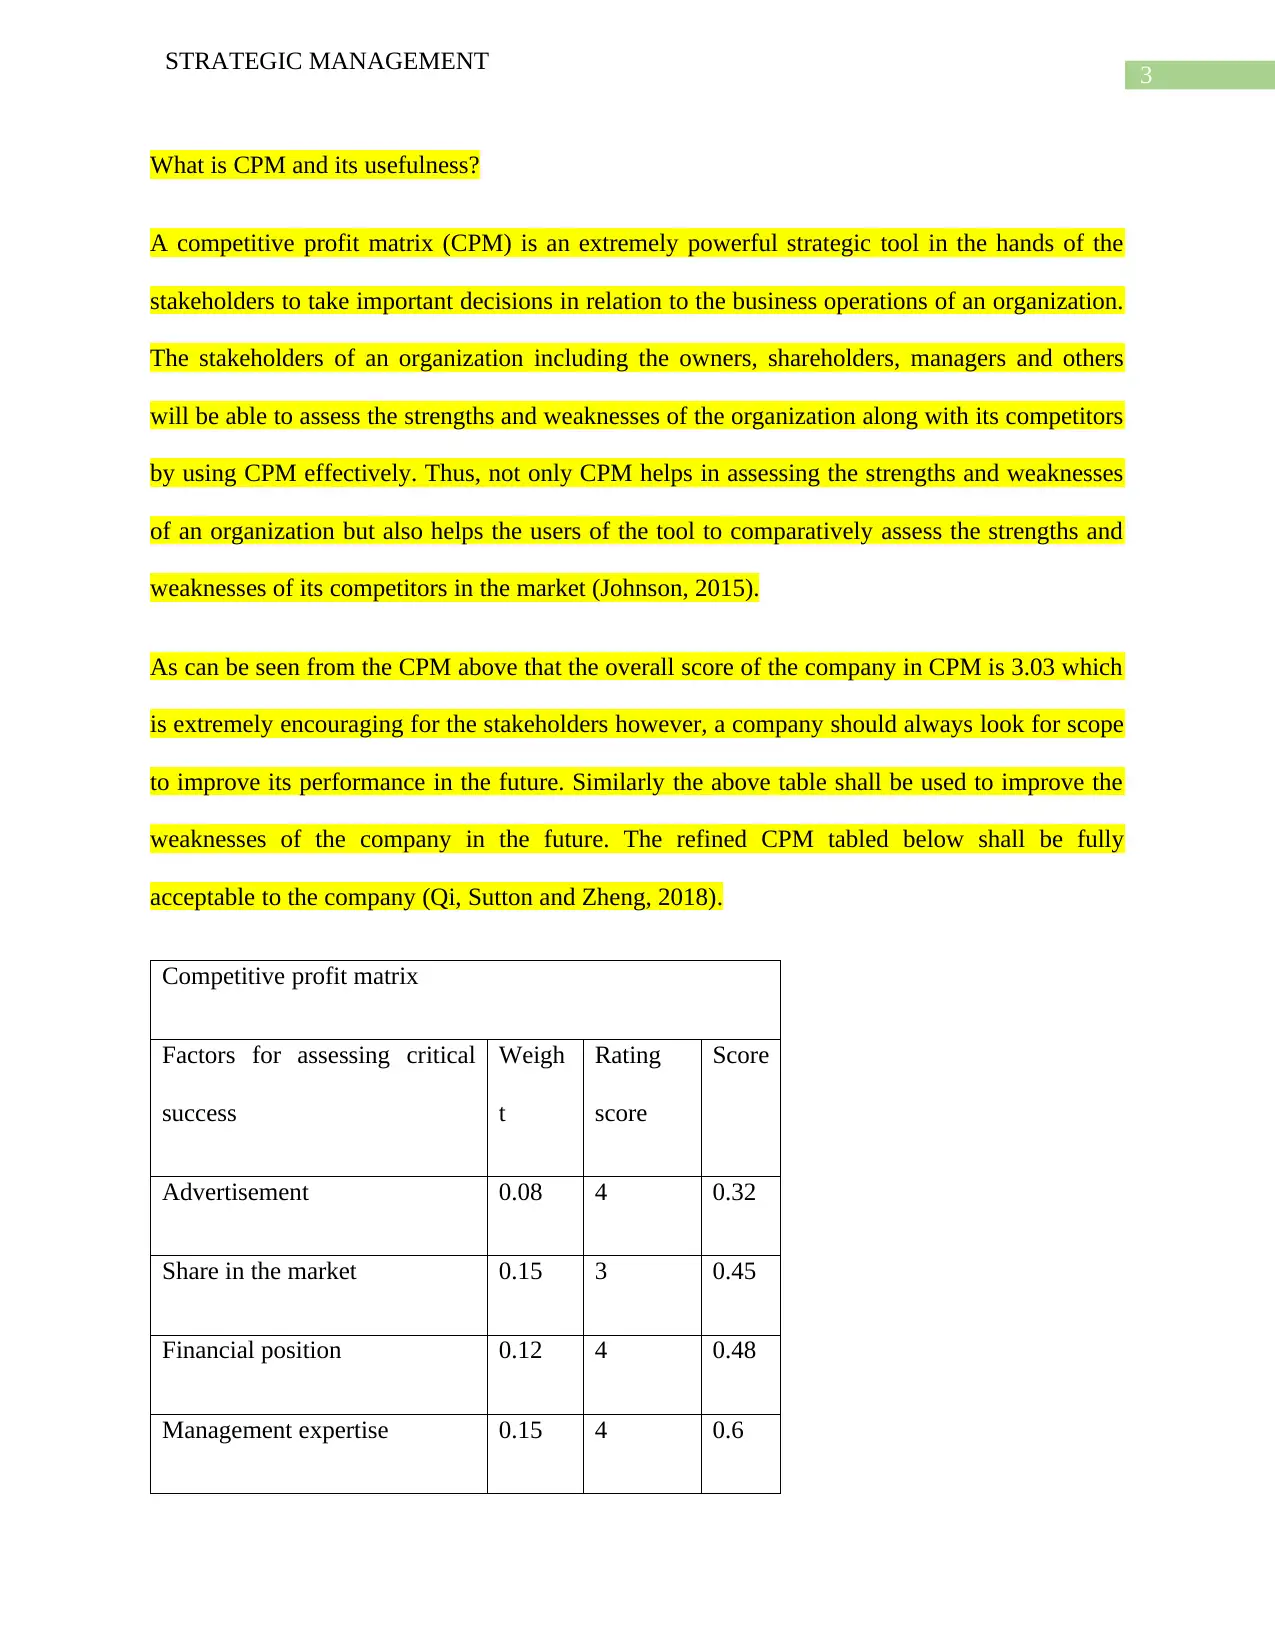
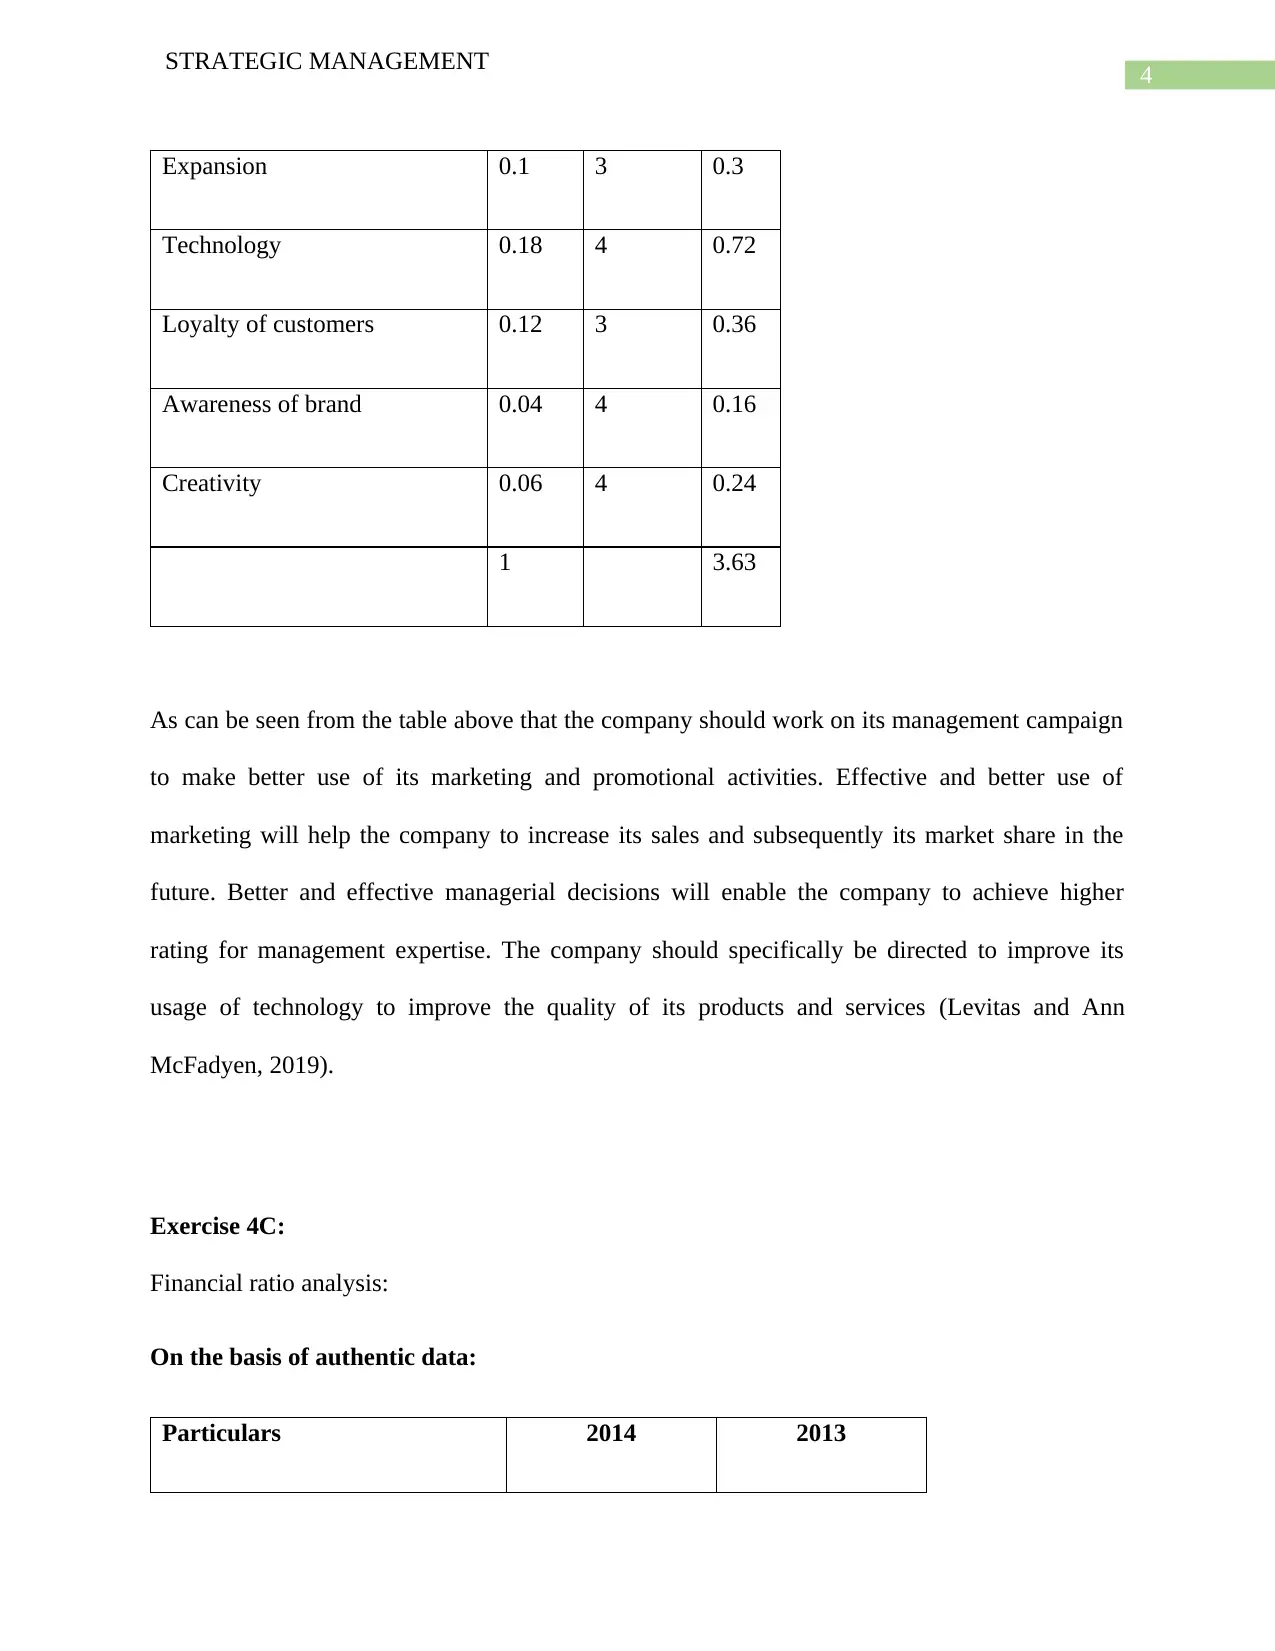
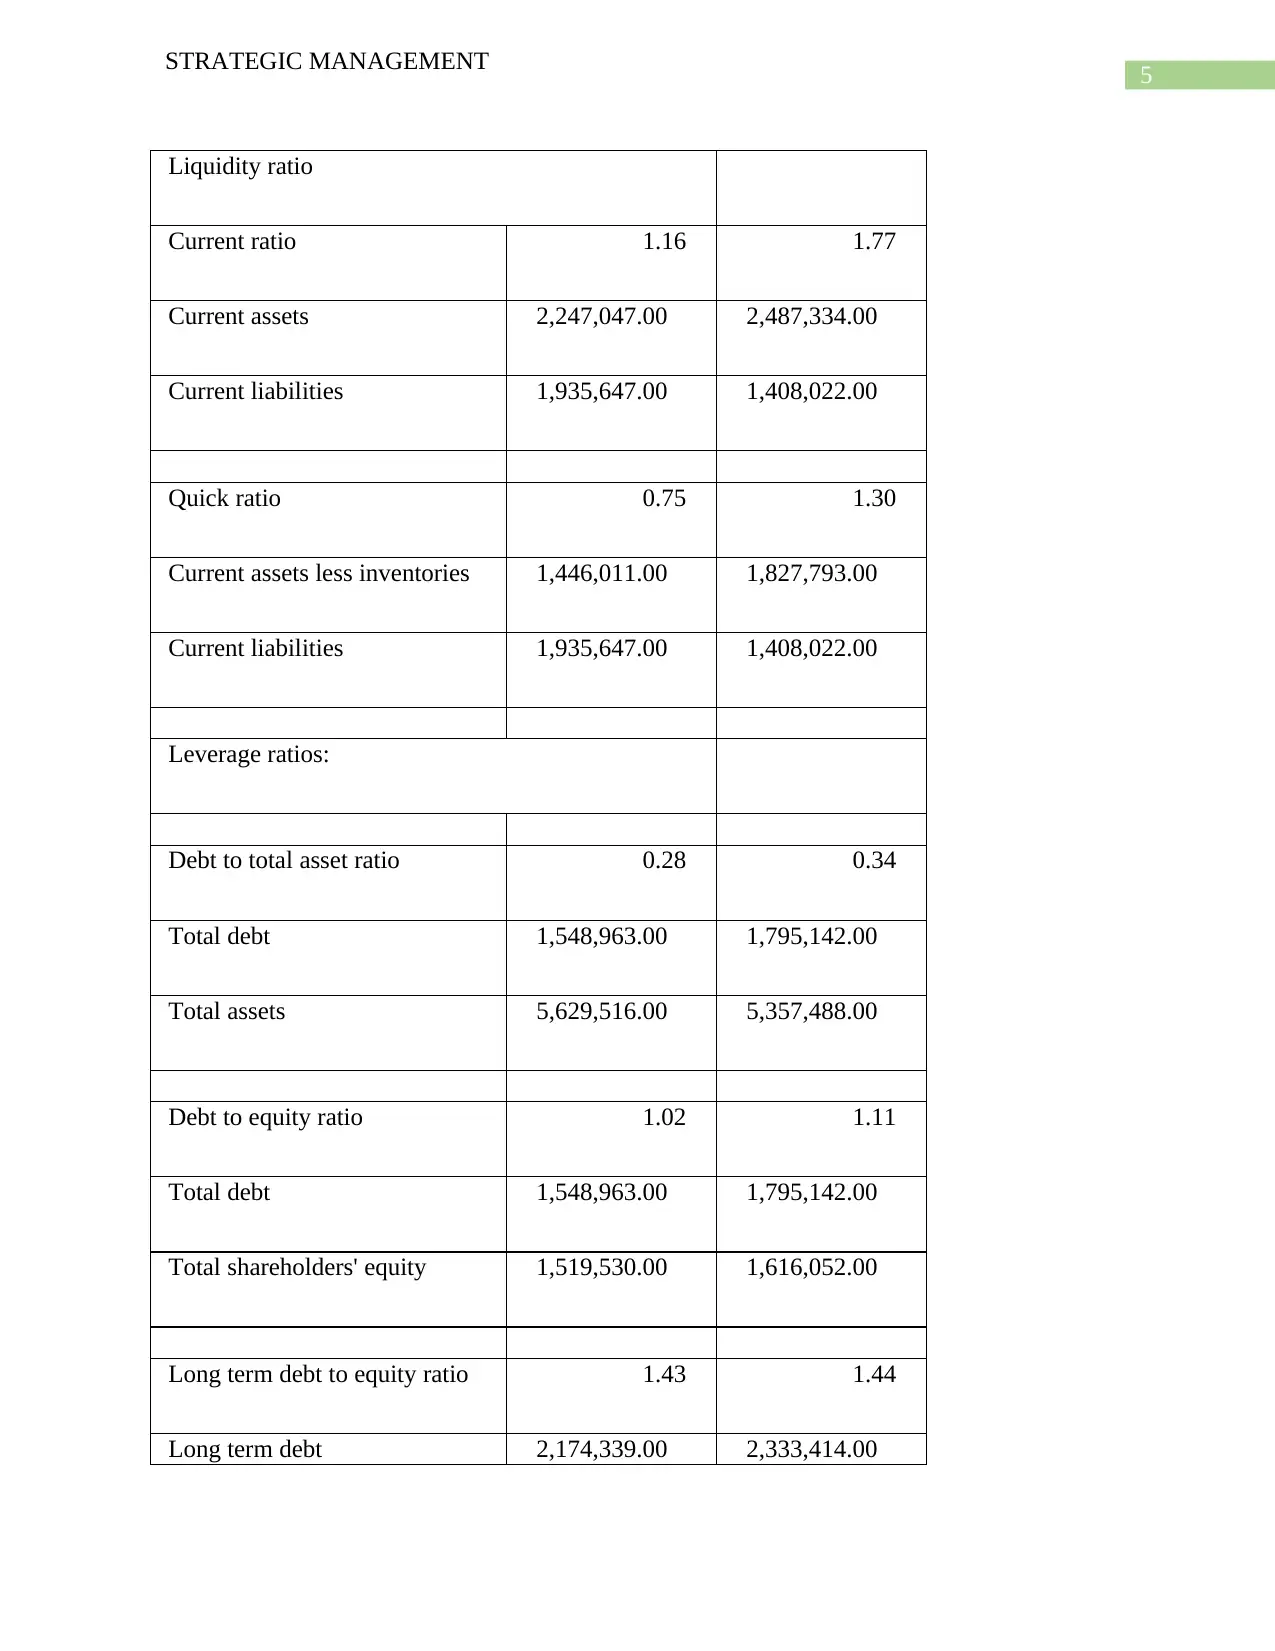
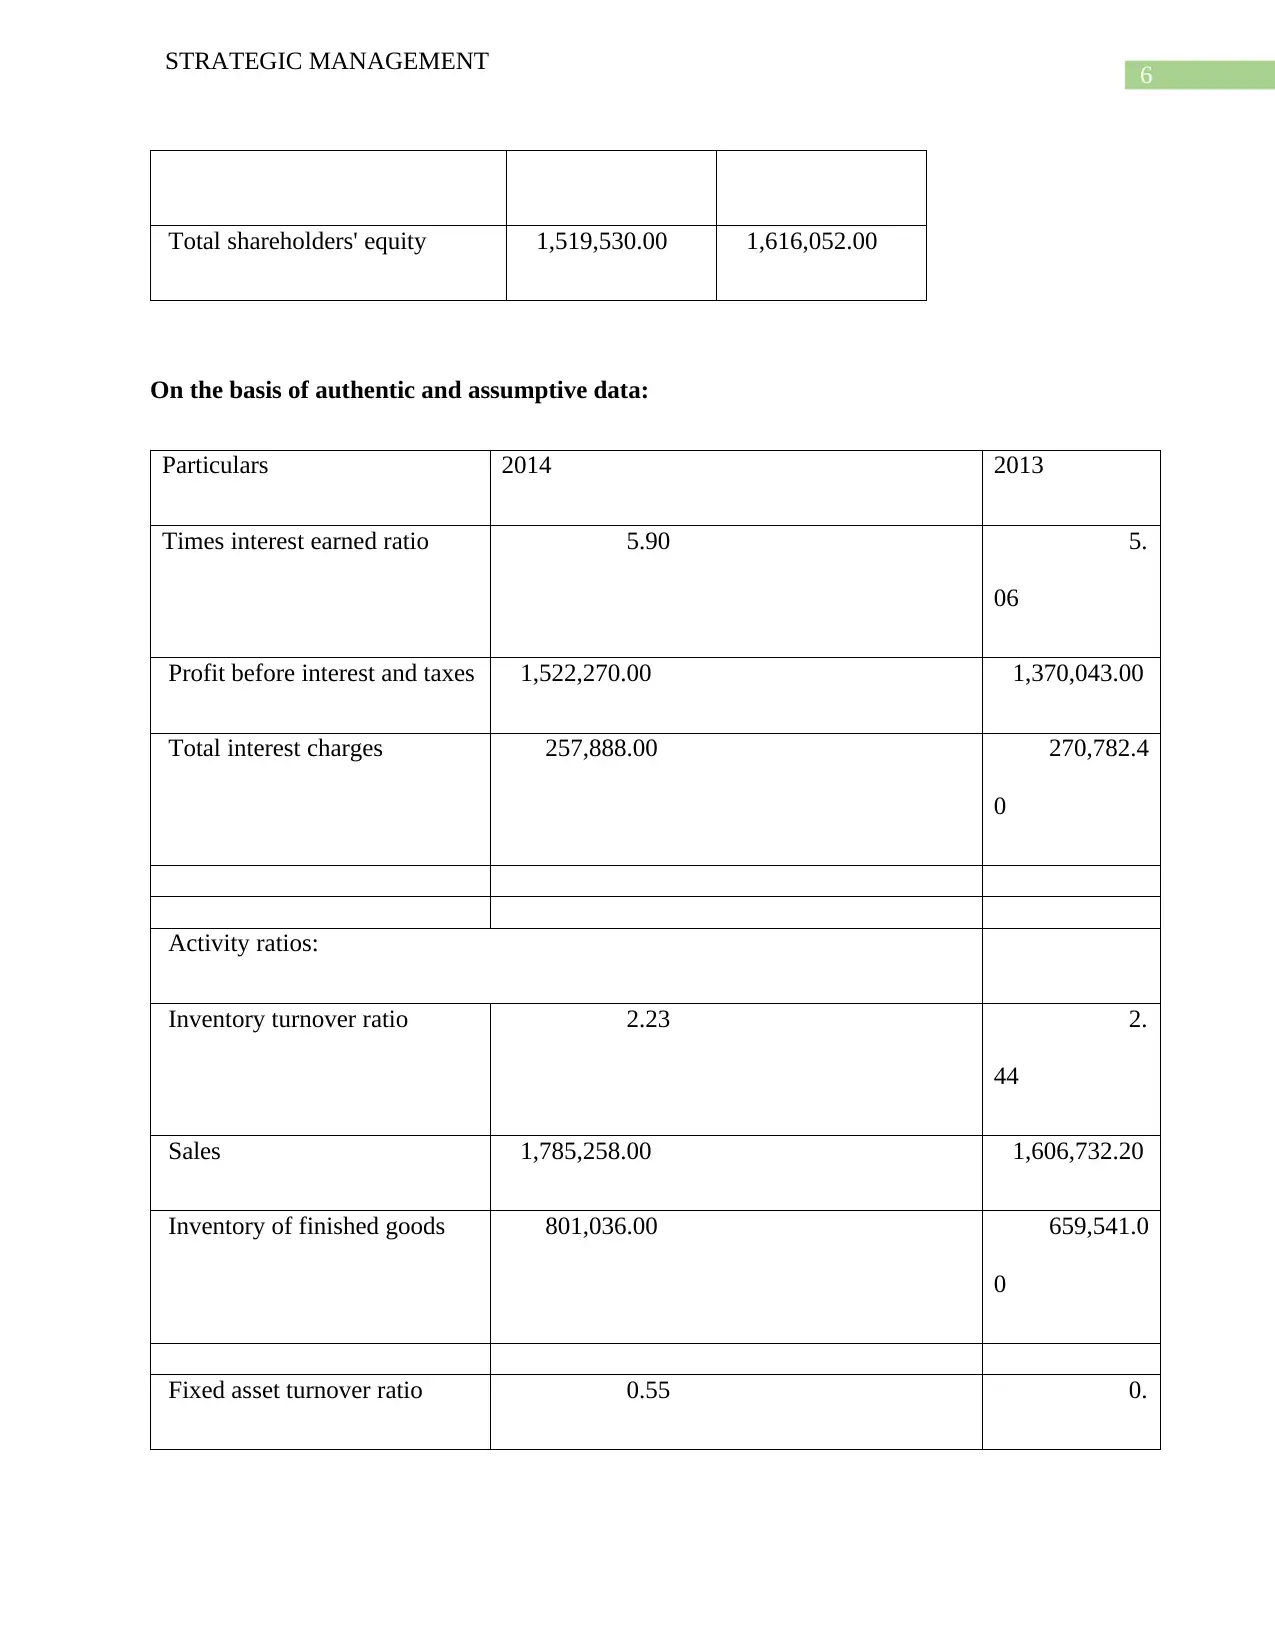
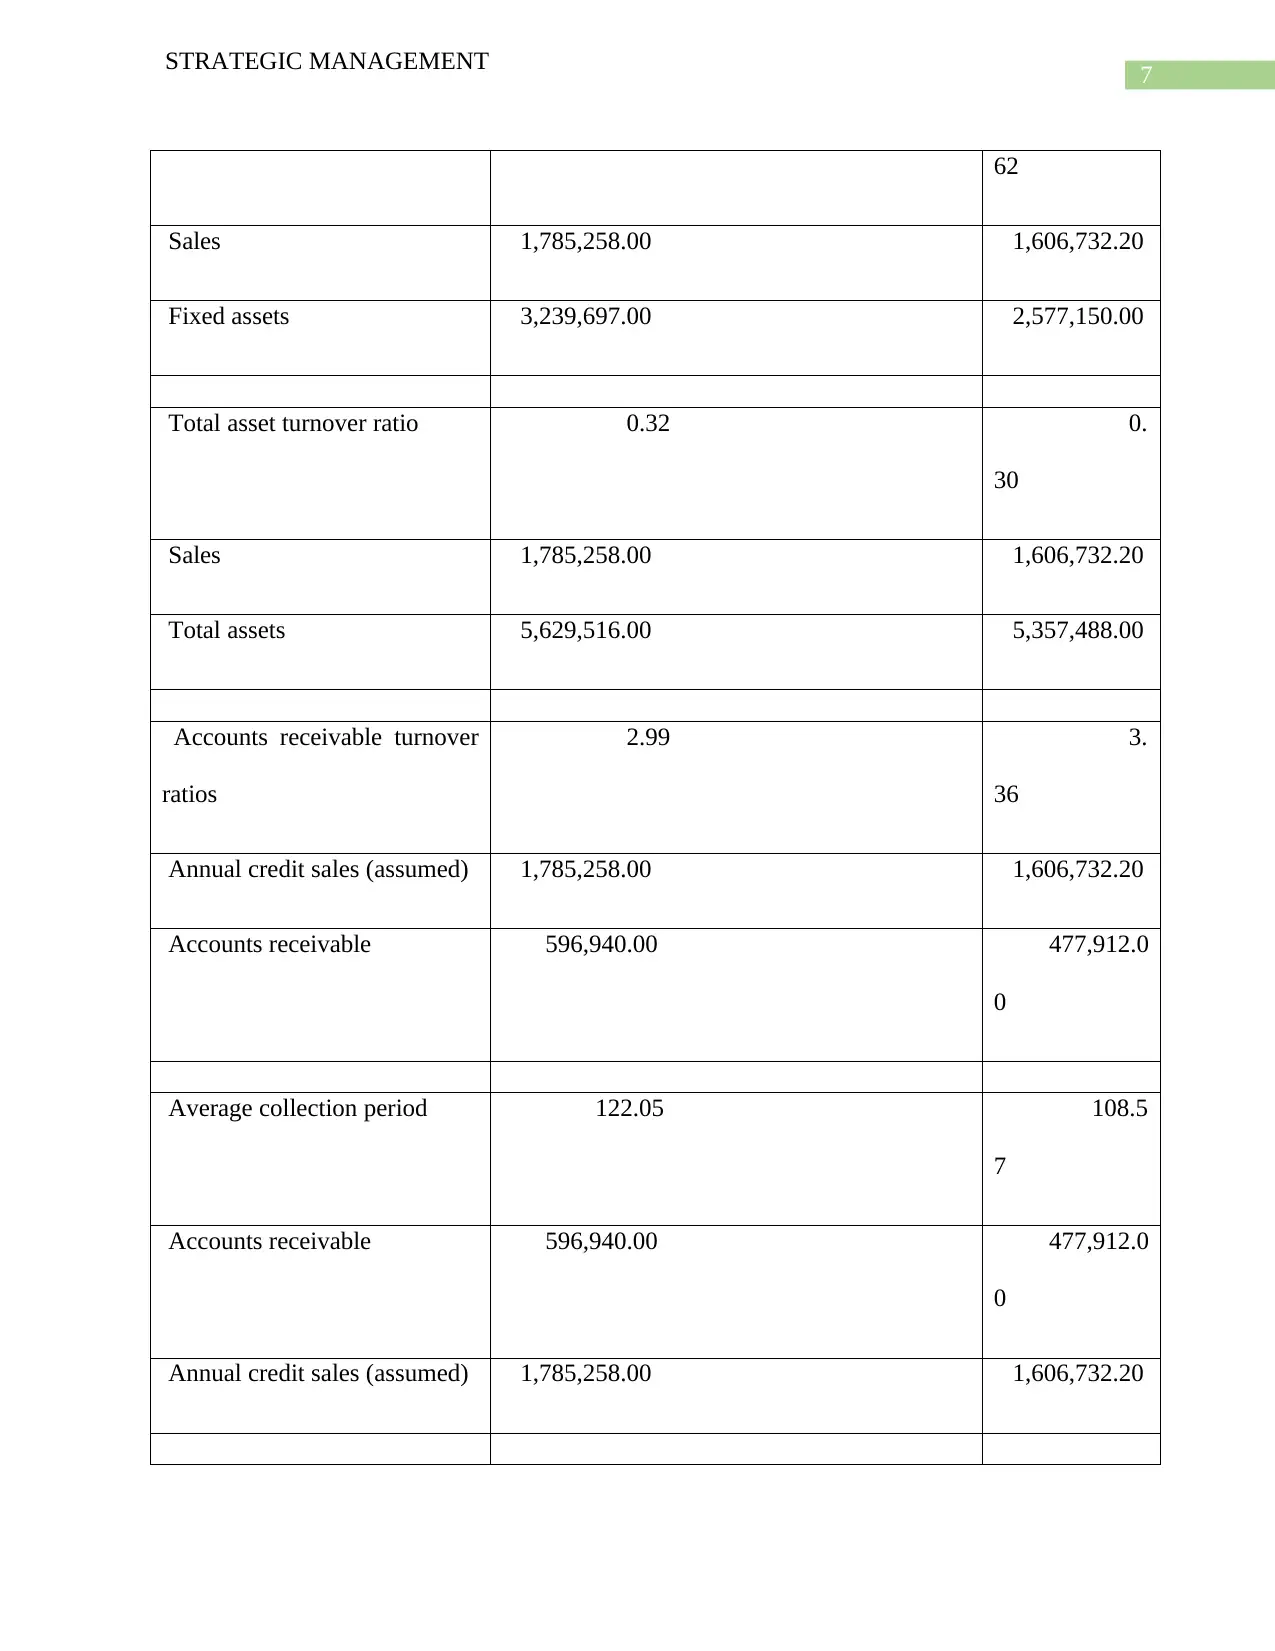
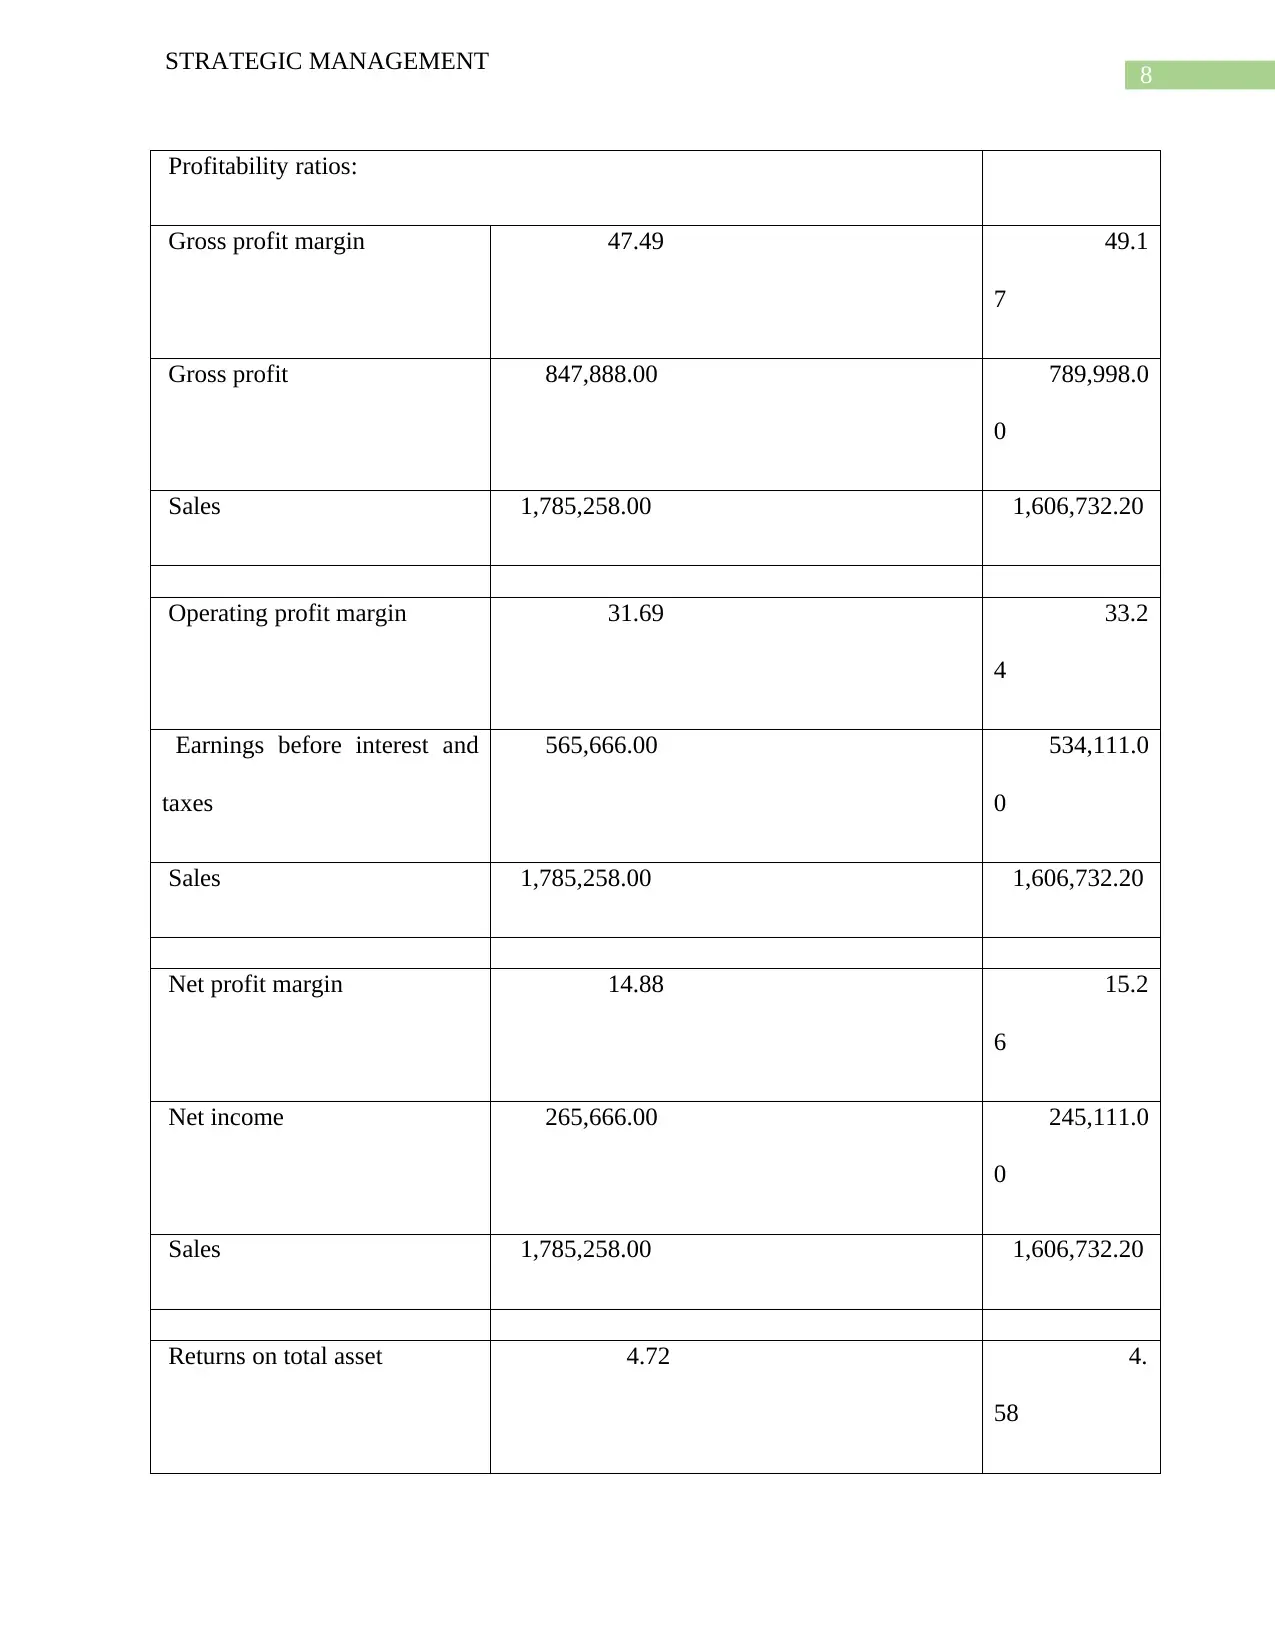
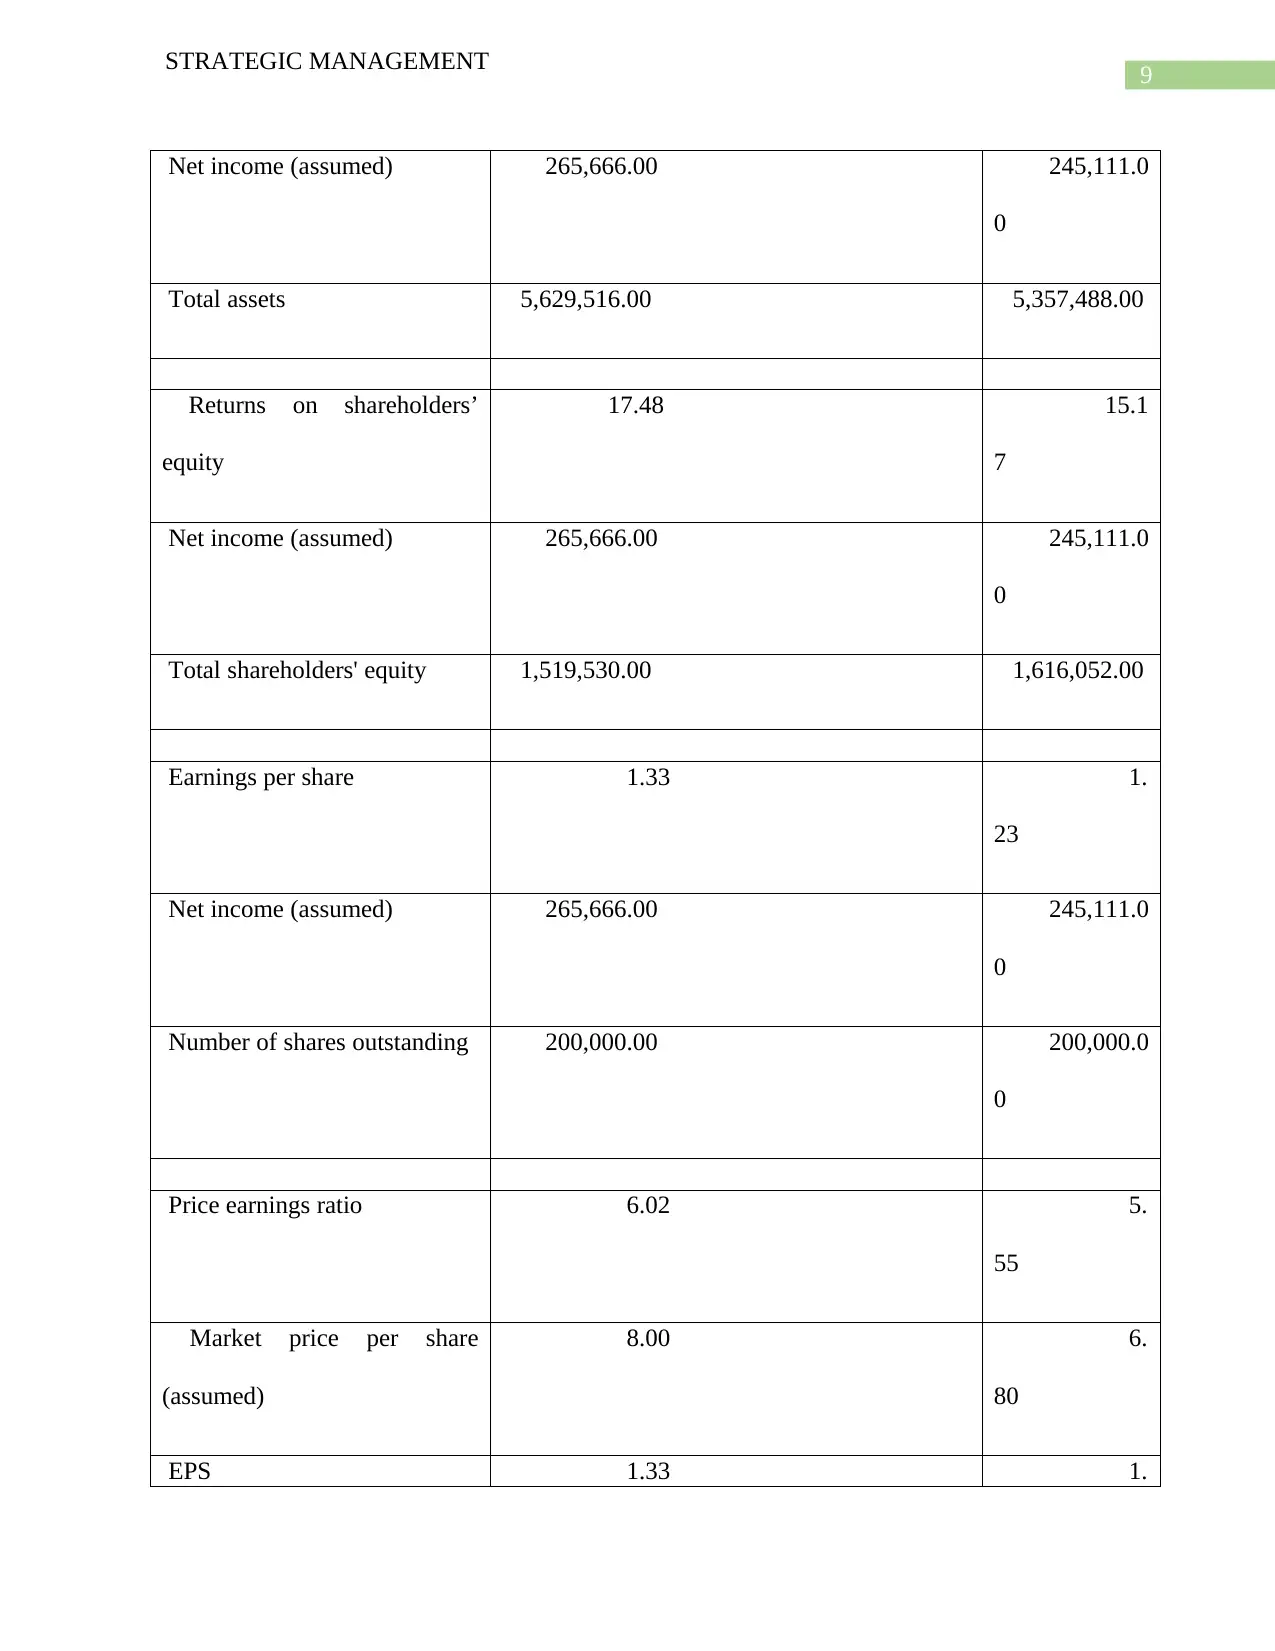
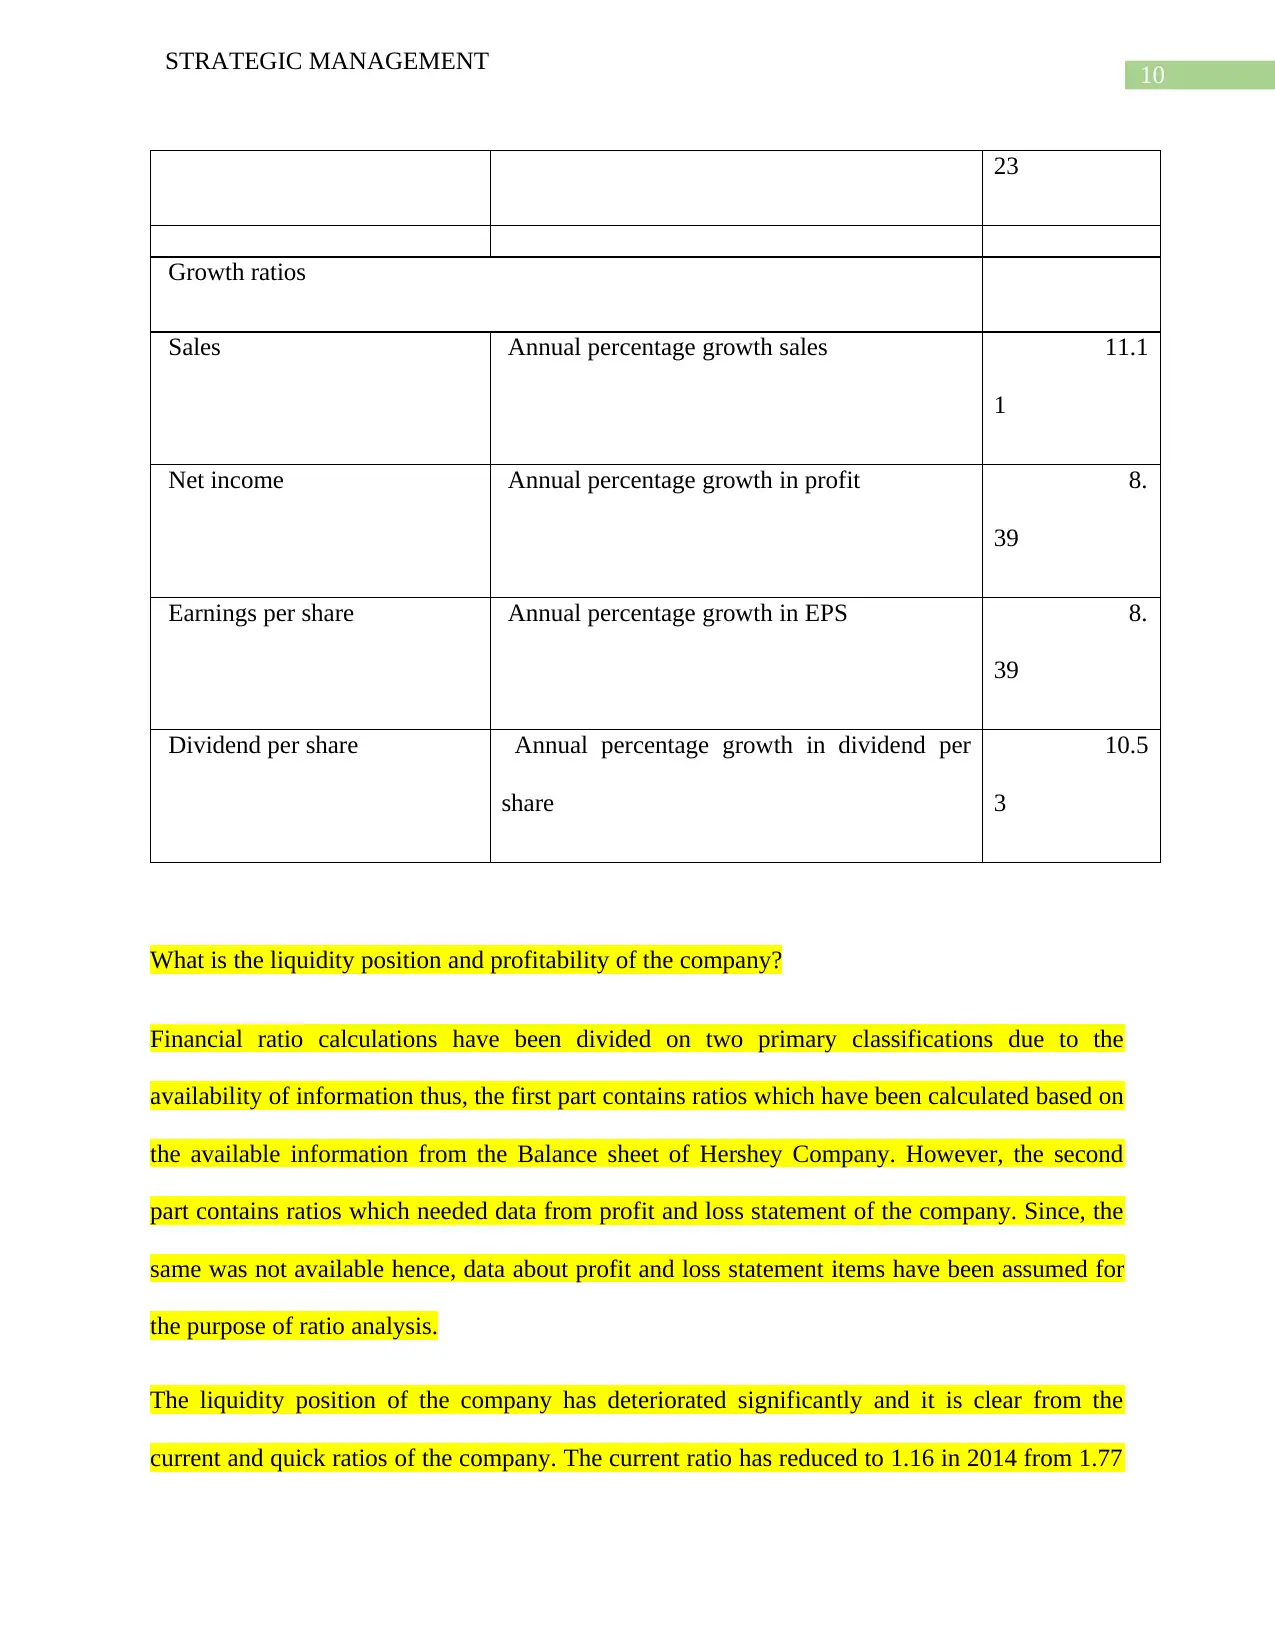
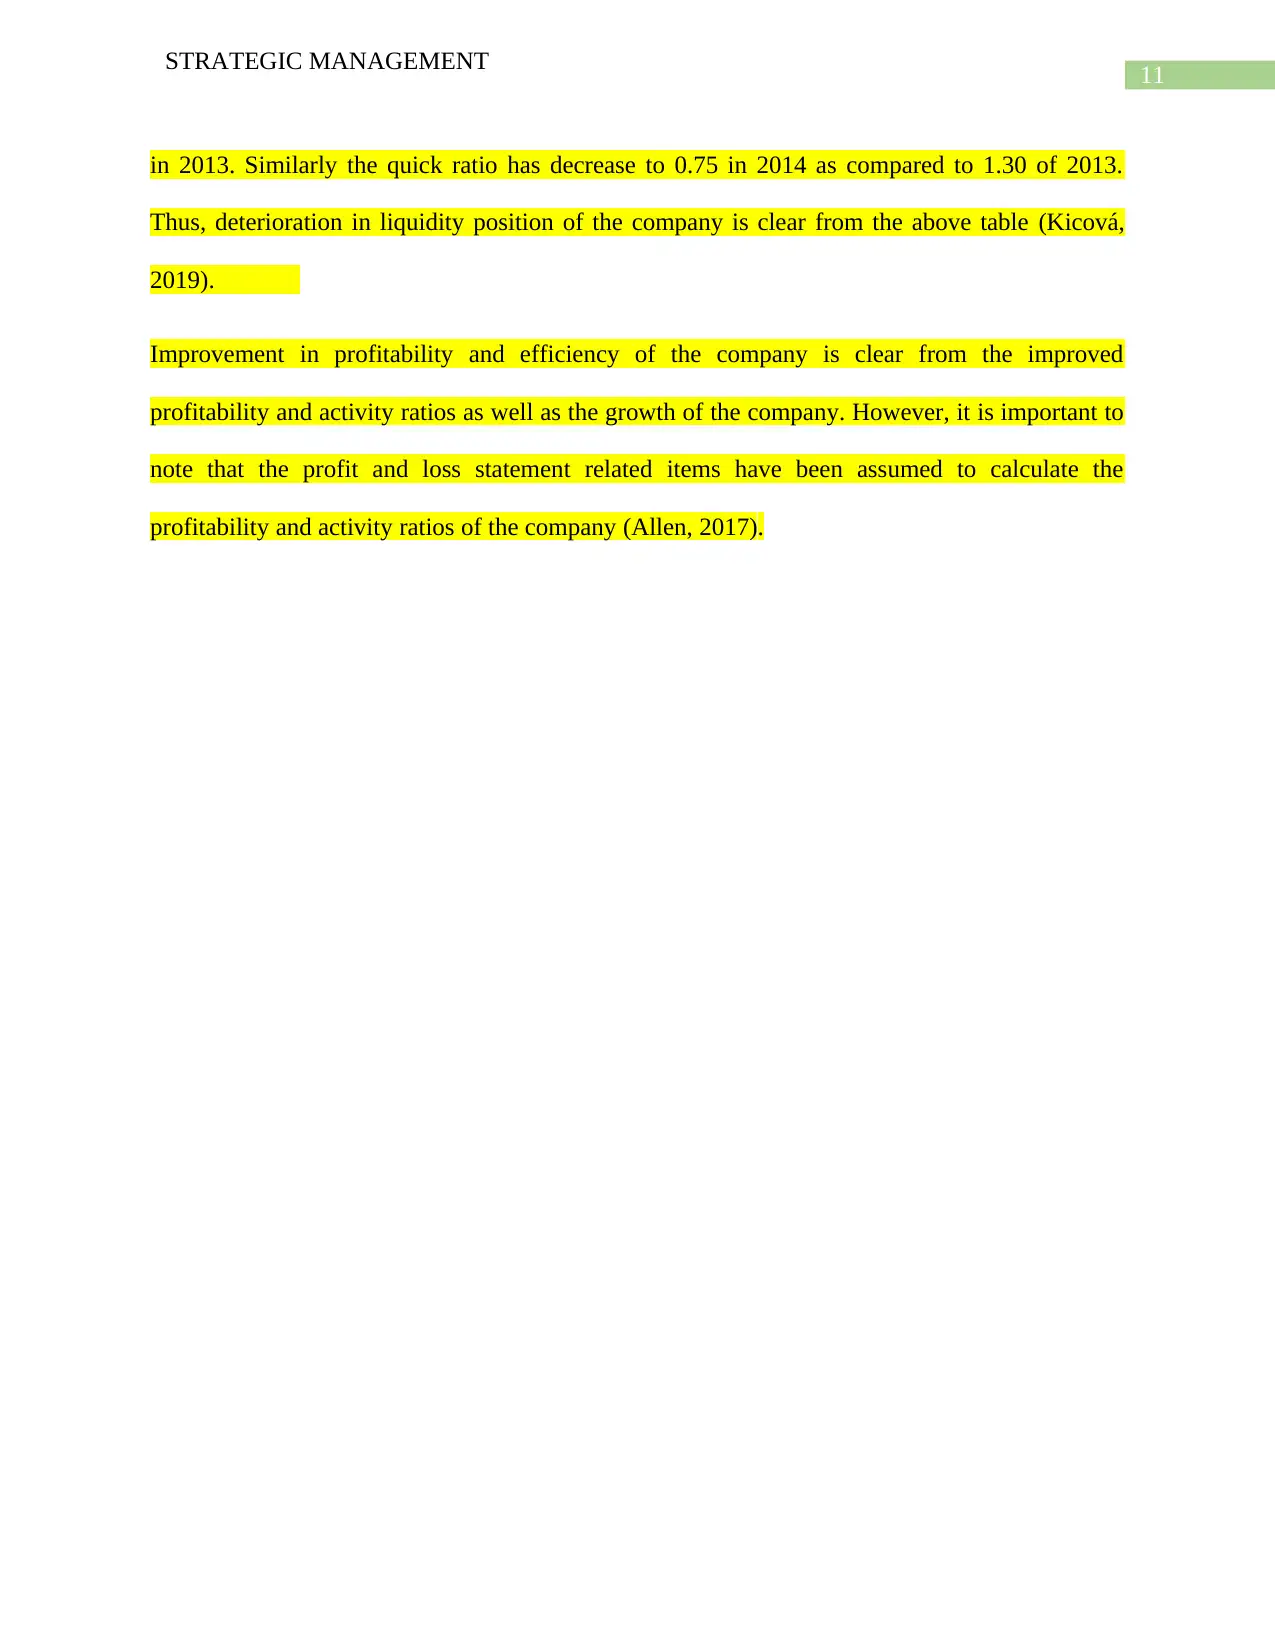
This report provides a comprehensive strategic management analysis of Hershey Company, incorporating a competitive profit matrix (CPM) and financial ratio analysis. The report begins with an explanation of CPM, highlighting its usefulness in assessing a company's strengths, weaknesses, and competitive position. A CPM is presented for Hershey, followed by a refined CPM suggesting areas for improvement, such as marketing and technology. The analysis then delves into financial ratio analysis, examining liquidity, leverage, activity, profitability, and growth ratios for Hershey over two years (2013 and 2014). The report discusses the company's liquidity position, which has deteriorated, and its improved profitability and efficiency, although it notes that some data was assumed due to data unavailability. The analysis is supported by references to relevant academic literature.
Document Page
Running head: STRATEGIC MANAGEMENT
Strategic Management
Name of the Student:
Name of the University:
Authors Note:
tabler-icon-diamond-filled.svg

Paraphrase This Document

Need a fresh take? Get an instant paraphrase of this document with our AI Paraphraser
Document Page
1
STRATEGIC MANAGEMENT
Contents
Exercise 3F:.....................................................................................................................................2
Exercise 4C:.....................................................................................................................................4
References:....................................................................................................................................12
Document Page
2
STRATEGIC MANAGEMENT
Exercise 3F:
In this case the CPM of Hershey Company is provided below to asset its strengths and
weaknesses at present. The table below has been prepared on the basis of certain assumptions as
no data in relation to the profit and loss statement of the company was not available.
Competitive profit matrix
Factors for assessing critical success Weight Rating score Score
Advertisement 0.08 3 0.24
Share in the market 0.15 2 0.30
Financial position 0.12 4 0.48
Management expertise 0.15 3 0.45
Expansion 0.1 3 0.3
Technology 0.18 3 0.54
Loyalty of customers 0.12 3 0.36
Awareness of brand 0.04 3 0.12
Creativity 0.06 4 0.24
Total 1 3.03
Document Page
3
STRATEGIC MANAGEMENT
What is CPM and its usefulness?
A competitive profit matrix (CPM) is an extremely powerful strategic tool in the hands of the
stakeholders to take important decisions in relation to the business operations of an organization.
The stakeholders of an organization including the owners, shareholders, managers and others
will be able to assess the strengths and weaknesses of the organization along with its competitors
by using CPM effectively. Thus, not only CPM helps in assessing the strengths and weaknesses
of an organization but also helps the users of the tool to comparatively assess the strengths and
weaknesses of its competitors in the market (Johnson, 2015).
As can be seen from the CPM above that the overall score of the company in CPM is 3.03 which
is extremely encouraging for the stakeholders however, a company should always look for scope
to improve its performance in the future. Similarly the above table shall be used to improve the
weaknesses of the company in the future. The refined CPM tabled below shall be fully
acceptable to the company (Qi, Sutton and Zheng, 2018).
Competitive profit matrix
Factors for assessing critical
success
Weigh
t
Rating
score
Score
Advertisement 0.08 4 0.32
Share in the market 0.15 3 0.45
Financial position 0.12 4 0.48
Management expertise 0.15 4 0.6
tabler-icon-diamond-filled.svg

Paraphrase This Document

Need a fresh take? Get an instant paraphrase of this document with our AI Paraphraser
Document Page
4
STRATEGIC MANAGEMENT
Expansion 0.1 3 0.3
Technology 0.18 4 0.72
Loyalty of customers 0.12 3 0.36
Awareness of brand 0.04 4 0.16
Creativity 0.06 4 0.24
1 3.63
As can be seen from the table above that the company should work on its management campaign
to make better use of its marketing and promotional activities. Effective and better use of
marketing will help the company to increase its sales and subsequently its market share in the
future. Better and effective managerial decisions will enable the company to achieve higher
rating for management expertise. The company should specifically be directed to improve its
usage of technology to improve the quality of its products and services (Levitas and Ann
McFadyen, 2019).
Exercise 4C:
Financial ratio analysis:
On the basis of authentic data:
Particulars 2014 2013
Document Page
5
STRATEGIC MANAGEMENT
Liquidity ratio
Current ratio 1.16 1.77
Current assets 2,247,047.00 2,487,334.00
Current liabilities 1,935,647.00 1,408,022.00
Quick ratio 0.75 1.30
Current assets less inventories 1,446,011.00 1,827,793.00
Current liabilities 1,935,647.00 1,408,022.00
Leverage ratios:
Debt to total asset ratio 0.28 0.34
Total debt 1,548,963.00 1,795,142.00
Total assets 5,629,516.00 5,357,488.00
Debt to equity ratio 1.02 1.11
Total debt 1,548,963.00 1,795,142.00
Total shareholders' equity 1,519,530.00 1,616,052.00
Long term debt to equity ratio 1.43 1.44
Long term debt 2,174,339.00 2,333,414.00
Document Page
6
STRATEGIC MANAGEMENT
Total shareholders' equity 1,519,530.00 1,616,052.00
On the basis of authentic and assumptive data:
Particulars 2014 2013
Times interest earned ratio 5.90 5.
06
Profit before interest and taxes 1,522,270.00 1,370,043.00
Total interest charges 257,888.00 270,782.4
0
Activity ratios:
Inventory turnover ratio 2.23 2.
44
Sales 1,785,258.00 1,606,732.20
Inventory of finished goods 801,036.00 659,541.0
0
Fixed asset turnover ratio 0.55 0.
tabler-icon-diamond-filled.svg

Paraphrase This Document

Need a fresh take? Get an instant paraphrase of this document with our AI Paraphraser
Document Page
7
STRATEGIC MANAGEMENT
62
Sales 1,785,258.00 1,606,732.20
Fixed assets 3,239,697.00 2,577,150.00
Total asset turnover ratio 0.32 0.
30
Sales 1,785,258.00 1,606,732.20
Total assets 5,629,516.00 5,357,488.00
Accounts receivable turnover
ratios
2.99 3.
36
Annual credit sales (assumed) 1,785,258.00 1,606,732.20
Accounts receivable 596,940.00 477,912.0
0
Average collection period 122.05 108.5
7
Accounts receivable 596,940.00 477,912.0
0
Annual credit sales (assumed) 1,785,258.00 1,606,732.20
Document Page
8
STRATEGIC MANAGEMENT
Profitability ratios:
Gross profit margin 47.49 49.1
7
Gross profit 847,888.00 789,998.0
0
Sales 1,785,258.00 1,606,732.20
Operating profit margin 31.69 33.2
4
Earnings before interest and
taxes
565,666.00 534,111.0
0
Sales 1,785,258.00 1,606,732.20
Net profit margin 14.88 15.2
6
Net income 265,666.00 245,111.0
0
Sales 1,785,258.00 1,606,732.20
Returns on total asset 4.72 4.
58
Document Page
9
STRATEGIC MANAGEMENT
Net income (assumed) 265,666.00 245,111.0
0
Total assets 5,629,516.00 5,357,488.00
Returns on shareholders’
equity
17.48 15.1
7
Net income (assumed) 265,666.00 245,111.0
0
Total shareholders' equity 1,519,530.00 1,616,052.00
Earnings per share 1.33 1.
23
Net income (assumed) 265,666.00 245,111.0
0
Number of shares outstanding 200,000.00 200,000.0
0
Price earnings ratio 6.02 5.
55
Market price per share
(assumed)
8.00 6.
80
EPS 1.33 1.
tabler-icon-diamond-filled.svg

Paraphrase This Document

Need a fresh take? Get an instant paraphrase of this document with our AI Paraphraser
Document Page
10
STRATEGIC MANAGEMENT
23
Growth ratios
Sales Annual percentage growth sales 11.1
1
Net income Annual percentage growth in profit 8.
39
Earnings per share Annual percentage growth in EPS 8.
39
Dividend per share Annual percentage growth in dividend per
share
10.5
3
What is the liquidity position and profitability of the company?
Financial ratio calculations have been divided on two primary classifications due to the
availability of information thus, the first part contains ratios which have been calculated based on
the available information from the Balance sheet of Hershey Company. However, the second
part contains ratios which needed data from profit and loss statement of the company. Since, the
same was not available hence, data about profit and loss statement items have been assumed for
the purpose of ratio analysis.
The liquidity position of the company has deteriorated significantly and it is clear from the
current and quick ratios of the company. The current ratio has reduced to 1.16 in 2014 from 1.77
Document Page
11
STRATEGIC MANAGEMENT
in 2013. Similarly the quick ratio has decrease to 0.75 in 2014 as compared to 1.30 of 2013.
Thus, deterioration in liquidity position of the company is clear from the above table (Kicová,
2019).
Improvement in profitability and efficiency of the company is clear from the improved
profitability and activity ratios as well as the growth of the company. However, it is important to
note that the profit and loss statement related items have been assumed to calculate the
profitability and activity ratios of the company (Allen, 2017).
chevron_up_icon
1 out of 14
circle_padding
hide_on_mobile
zoom_out_icon
[object Object]