Strategic Analysis and Financial Comparison: Tesla vs. Daimler Report
VerifiedAdded on 2021/01/01
|20
|5647
|259
Report
AI Summary
This report provides a comparative financial analysis of Tesla and Daimler, two prominent companies in the automotive industry. It begins with an overview of each company, highlighting their history, brands, and key operations. The core of the report focuses on a detailed comparison of their financial performance and position, including an analysis of their financial statements, such as balance sheets and income statements. Horizontal and vertical analyses are employed to examine trends and proportional changes in financial data over time. Furthermore, the report delves into the cash positions of both companies, analyzing their cash flow statements to assess their liquidity and ability to manage short-term obligations. Key financial ratios, such as the current ratio and quick ratio, are used to evaluate their financial health. The report aims to provide a comprehensive understanding of the strategic management approaches and financial strengths and weaknesses of Tesla and Daimler, offering valuable insights into their respective performances within the competitive automotive market.

Strategic Management
Paraphrase This Document
Need a fresh take? Get an instant paraphrase of this document with our AI Paraphraser
Table of Contents
INTRODUCTION...........................................................................................................................1
Overview about Tesla......................................................................................................................2
1. Comparison and contrast of financial performance and financial position of Daimler and
Tesla............................................................................................................................................4
2 Cash position of both companies. .........................................................................................11
CONCLUSION..............................................................................................................................14
REFERENCES..............................................................................................................................16

INTRODUCTION
Strategic management is the continuous planning, monitoring, evaluation and assessment
of all which is required for an organisation to achieve its objectives and goals. It includes the
setting goals, evaluation of competitive environment, evaluation of internal organisation and
strategies. This ensure that management properly use the strategy across organisation. Financial
analysis refers to evaluation the analysis of company like income statement, balance sheet and
cash flow statement. The financial analyst helps company to evaluate the investments which is
made by companies and provide strategy to companies regarding investment. The balance sheet
gives the detail about actual position of company. To understand this concept two companies
Tesla and Daimler has been taken. The both companies deals in automotive industry. As
comparison of financial performance and financial position of Tesla and Daimler is being
explained in this report. The financial strength and weaknesses has also been discussed in this
present report. As to know cash position of both companies, the cash flow statement is being
analysed in this report.
Overview of DAIMLER
Daimler are the one of biggest producers of premium cars and world's biggest
manufacturer of commercial vehicles across the world. The company provides fleet
management, insurance and innovative mobility services. This is a German multinational
automotive corporation with headquartered in Stuttgart, Bargain-basement, Germany. The
company was founded in 1890 by Rebottle Daimler (Rave, 2016) . The key people for company
is Karl Benz and Rebottle Daimler. In 1890, the company Daimler-Motoren-Gesellschaft was
established. Daimler owned number of cars, bus, truck, and motor cycle brands including the
Mercedes-Benz, Mercedes-AMG, and detroit diesel etc. Daimler provides the financial services
under the company Daimler Financial Services. The company production output was 3321350
for year 2017. As company has earned revenue of EURO 164.33 Billion in year 2017. The net
income of company for the year 2017 was EURO 10.864 billion.
The respective company have many issues that hinder the production level and also
reduced the profit in a specific period of time. The main reason for problem is that earlier
marketing strategy of company was not so effective and appropriate so it does not support in
increment of sales that overall reduces the market share of Daimler. After few years
Management focus to improve the profit and build string national image that will defiantly helps
1
⊘ This is a preview!⊘
Do you want full access?
Subscribe today to unlock all pages.
Trusted by 1+ million students worldwide

to grow profit in the upcoming future. So in order to increase sales company focus to apply the
4Ps marketing strategy. As per the adopted strategy company use to improve the design, quality,
durability of different product. The set the best suitable prices of their product that were offered
for sales which attract more number of customer.
Timeline of Daimler AG
Benz & Company, 1883-1926
Daimler Motoren Gesellschaft AG, 1890- 1926
Daimler-Benz AG, 1926 – 1998
DaimlerChrysler AG, 1998-2007
Daimler AG, 2007 - Present
Brands of Daimler:
Mercedes – Benz Cars
◦ Maybach – production ended in 2012, but S- Class is still sold as Mercedes maybach.
◦ Mercedes – Benz
◦ Mercedes – AMG
◦ Smart
Daimler Truck :
◦ Freighliner
◦ Mitsubishi Fuso
◦ Thomas Built Buses
◦ Sterling trucks
◦ BharatBenz
Daimler Buses
◦ Mercedes Benz Buses
◦ Orion Bus Industries, closed in 2013.
◦ Setra
Daimler Financial Services
◦ Mercedes Benz Bank
◦ Mercedes Benz Financial
◦ Daimler Truck Financial
2
Paraphrase This Document
Need a fresh take? Get an instant paraphrase of this document with our AI Paraphraser

The Daimler has worldwide networks of production plant and research centres. The
company has various manufacturing plants across the world for the production of different
products of company. As company have pants in country like Germany, USA, Brazil, Turkey,
France, Czech Republic, Indonesia, Japan and Mexico etc.
Overview about Tesla
In today's era there is an emerging need of advanced automotive companies that focus in
creating the best motor vehicle according to the requirement of people and that fits the time.
There are various large companies that focus to develop innovative motor and also focus to open
auto mobile repair shops and various fuel filling stations. Tesla was one of the leading
automotive companies in the recent time. The company was founded in 2003 by a team of
professional and a skilled staff member specially engineers. The CEO of company is Elon Musk
that develop a “Secret Master Plan” in 2016 to introduced a special motor with special feature
that is best in the industry and at a very cheap rate (Powell, 2014). The manager of Tesla Inc.
designs, create, producers various kind of electric vehicles with the main motive to sell and earn
huge revenue. The also produces various kind of tools of energy generation and storage system
at global level such as china, united state, Norway etc. The main is divided into two production
segment that are energy generation product and Automotive, storage devices. The manager
focus to produce those electronic vehicle at a very cheap rate that makes customer more satisfied
and they dot need to compromise their desire to drive the electronic sports cars.
In past year, the marketing strategy used by company in order to increase the overall
performance and productivity. They uses Gigafactor concept to bring effectiveness in the process
of production. But it was observed that Tesla, is not able to increase sales within a specific
period of time and keeps on diminishing the global image. This is because other leading
company adopt the best selling practices and promote their product at larger platform. In order to
overcome the specific problems management of Tesla, applies the concept of STP that support to
grow the financial stability and maintain long term profitability. It also aid company to grow its
market share and increase customer base by properly target the customer segment those are
willing to buy auto-mobiles. With the assist of this strategy company is able to position product
in market that are more desirable and useful for customer which will ultimately increase profit in
the upcoming period.
3

The automotive department of Tesla produces and offer sports utility cars and sedan.
They also wants their customer to get the best solution in order to any damage or fault happen to
the vehicle, therefore Tesla has developed its owned service station, services plus location and
mobile executives that visit the place and repair the vehicle. The engineer of Tesla introduced
many electric vehicle because they believes that as soon as world stop dependent on fossil fuels
their in a chance of better future in coming time.
Mainly the vehicles are produced in the factories of Tesla under the guidance of special
skilled manager and labour force. The main factory of Tesla are located in different part such as
Fremont, California and other part of united state. The main focus of company is to produce the
finest motor in the industry so they wants their factories to be safe by making proactive approach
to safety. Manager of company wants the best production employees and they wants their
employees to be well skilled and knowledgeable. Therefore they provide on the job training and
record their performance in the daily basic and found the point of improvement. There are
approx 45000 of skilled employees working in Tesla with the motive to reduce the burden of
fossil fuel and produce electronic vehicles.
Tesla produce vehicle with some special features such as power pack mileage, power
wall protection and solar roof and they reduce the weight of battery by introducing the new
battery cell. So the manager of Tesla are building the most affordable and accessible car in the
industry to large number of people. They main purpose of company is to reduce the the burden of
pollution level in country with clean energy production and transport. Engineer with their
knowledge and skills combined the electric car, batteries and energy generation and production
to produce better future.
At the end of accounting year 2017-18 the operating income is US$1.632 billion and net
income US$1.961 billion. Total assets shows the balance of US$28.655 billion and total equity
shows the amount of US$4.267 billion.
1. Comparison and contrast of financial performance and financial position of Daimler and Tesla
Financial performance of every company depends upon various element. As it is
important to have a good financial performance of company because it indicates a good growth
of company. As company does various things for keeping their financial performance up to the
level. The financial performance is analysed by various things like balance sheet, income
statement, horizontal and vertical analysis and ratio analysis. The financial position of company
4
⊘ This is a preview!⊘
Do you want full access?
Subscribe today to unlock all pages.
Trusted by 1+ million students worldwide

is calculated out of balance sheet. It shows the actual position of company. This gives clear
picture of company's creditor, long term loans, short term borrowings, current assets of company
and non current assets of company comes under this financial position. As balance sheet is
prepared at the end of each accounting year by every company ion order to know the actual
position of company. Apart form this the profit and loss statement shows how much profit or loss
company for a particular fiscal year. The profit and loss account includes the indirect expenses
and indirect revenues of company. This is very helpful statement to know about revenue
generation of company (Muogbo, 2013). The company also use the ratio analysis which is used
to analyse the various aspect of the company's operating and financial performance such as is
efficiency, liquidity, profitability and solvency.
The ratio analysis is helpful in validating the financing, investment and operating
decisions of firm. It gives the summary form of financial statement. The ratio is very helpful in
simplifying financial data into simple ratios of operating efficiency, financial efficiency,
solvency and long term position etc. With the help of ratio analysis management tries to find out
the issues in management areas. This enables a company to do compare with other firms,
industry standards and intra firm comparison. As all these ratios are helpful in getting
information about the current ratio from financial position of company. Financial performance
refers to the degree to which financial goals has been achieved. It helps to identify company's
strength and weaknesses and company can make its financial position more strong by
eliminating the weaknesses of company.
Horizontal Analysis:
The horizontal analysis is an analysis technique which shows changes in value of
corresponding financial statement items over a period of time. This is very useful technique to
analyse the trend situations. As more than two or more periods are used in horizontal analysis. It
is utilized in financial statement analysis to make comparison of historical data like ratios, line
items with in given period of time (Mathieu and Chen, 2011). The analysis use the absolute
comparison or percentage comparison where numbers are expressed in percentage of amount in
baseline year with base percentage of 100%.
Vertical Analysis:
5
Paraphrase This Document
Need a fresh take? Get an instant paraphrase of this document with our AI Paraphraser

This is the proportional analysis of financial statements where each line item on financial
statement is listed use as percentage of another item. It is also useful in timeline analysis to see
relatively changes in accounts over time like comparison on basis of five year period.
Ratio analysis for the Daimler and Tesla
There are different types of ratios, on the basis of that the comparison is being done for
Daimler and Tesla these are described as below:
Current Ratio:
Current ratio is used by the various industries to determine the company's short term
liquidity. This shows the company's capacity to generate enough cash to make payment of all
debts at once they become due (Jofre, 2011).
Quick Ratio:
Quick ratio shows the how effectively a company meet its short term financial abilities.
This is also known as acid test ratio. It allows a company to use the most liquid asset of business
like stock in order to meet its liabilities.
Daimler
Ratios Formula 2014 2015 2016 2017
Current ratio Current Assets/Current
liabilities
1.15 1.19 1.21 1.23
Quick ratio Current assets-stock-
prepaid expenses/current
liabilities
4.34 4.05 4.19 3.99
Tesla
Ratios Formula 2014 2015 2016 2017
Current ratio Current Assets/Current
liabilities
1.52 0.99 1.07 0.86
Quick ratio Current assets-stock-
prepaid expenses/current
liabilities
1.01 0.48 0.67 0.51
Interpretation:
6

The Daimler has the high current ratio for the year 2017 which is 1.23 which shows the
company has used its current assets properly to generate more cash and pay the debts. Where as
Tesla has lowest current ratio .86 for year 2017 which shows the company could not use properly
for paying off it payments. As Tesla has more liabilities then assets. For the year 2016 Daimler
has current ratio of 1.21 while other one has 1.07 which shows Daimler using its current assets in
an efficient way. As for the year 2014 and 2015 Daimler has 1.15 and 1.19 while for Tesla it has
the 1.52 and .99. The quick ratio of Daimler for year 2014, 2015, 2016 and 2017 is 4.34, 4.05,
4.19 and 3.99. While Tesla has quick ratio of 1.01, .48, .67 and .51. So the Tesla has lowest
quick ratio in compare to Daimler.
Debt equity ratio:
It is a financial ratio which indicates the how much equity does company have over its
liabilities. This shows the shareholder equity and debt which is used by company in order to
finance the assets of company.
Daimler
Ratios Formula 2014 2015 2016 2017
Debt equity ratio Debt/Equity 0.83 0.84 0.94 0.93
Tesla
Ratios Formula 2014 2015 2016 2017
Debt equity ratio Debt/Equity 2.06 1.91 1.26 2.22
Interpretation:
As for Daimler the debt equity ratio has the .83, .84, .94 and .93 which means company
have lower debt over its equity. While Tesla has ratio of 2.06, 1.91, 1.26 and 2.22 which shows
the company is more debt in compare to other one. As Tesla has more debt for the year 2017
which is 2.22. The company needs to take action for this as soon as possible.
Asset turnover:
This is an efficiency ratio which shows the company's capacity to generate sales from its
assets. This ratio indicates how efficiently a company use the assets to generate more sales (Hart
and Dowell, 2011).
Receivables turnover:
7
⊘ This is a preview!⊘
Do you want full access?
Subscribe today to unlock all pages.
Trusted by 1+ million students worldwide

This is an activity ratio which show how efficiently company uses its current assets. This
indicates the how promptly debtors of company make payment.
Inventory Turnover:
Stock turnover shows the number of times of a company sold and replace its inventory
during a given time period.
Daimler
Ratios Formula 2014 2015 2016 2017
Assets turnover Net sales/ average total
assets
0.73 0.73 0.67 0.66
Receivable turnover Net credit sales/average
account receivables
4.19 4.31 3.82 3.84
Inventory turnover Cost of goods
sold/average stock
5.32 5.27 4.94 5.09
Tesla
Ratios Formula 2014 2015 2016 2017
Assets turnover Net sales/ average total
assets
0.77 0.58 0.46 0.46
Receivable turnover Net credit sales/average
account receivables
23.2 20.46 20.96 23.18
Inventory turnover Cost of goods
sold/average stock
3.58 2.8 3.23 4.4
Interpretation:
As assets turnover for company Daimler is for the year 2014 to 2017 is .73, .73, .67
and .66 as company has used its assets more in the year for 2014 and 2015 which is .73 so for
these year Daimler has efficiently used its assets which helped in generating more sales. The
Tesla has used its assets for the year 2014 most as it generated more sales for this period of time.
As debtors turnover of Daimler is quite good as its debtors are making payment on time while if
comparing Tesla the debtors turnover is very high which shows the debtors of company making
late payment. The inventory turnover is high for Daimler is good situation for company while
8
Paraphrase This Document
Need a fresh take? Get an instant paraphrase of this document with our AI Paraphraser
comparing to Tesla it has low inventory turnover which shows the stock is not contributing much
in increasing of sales,
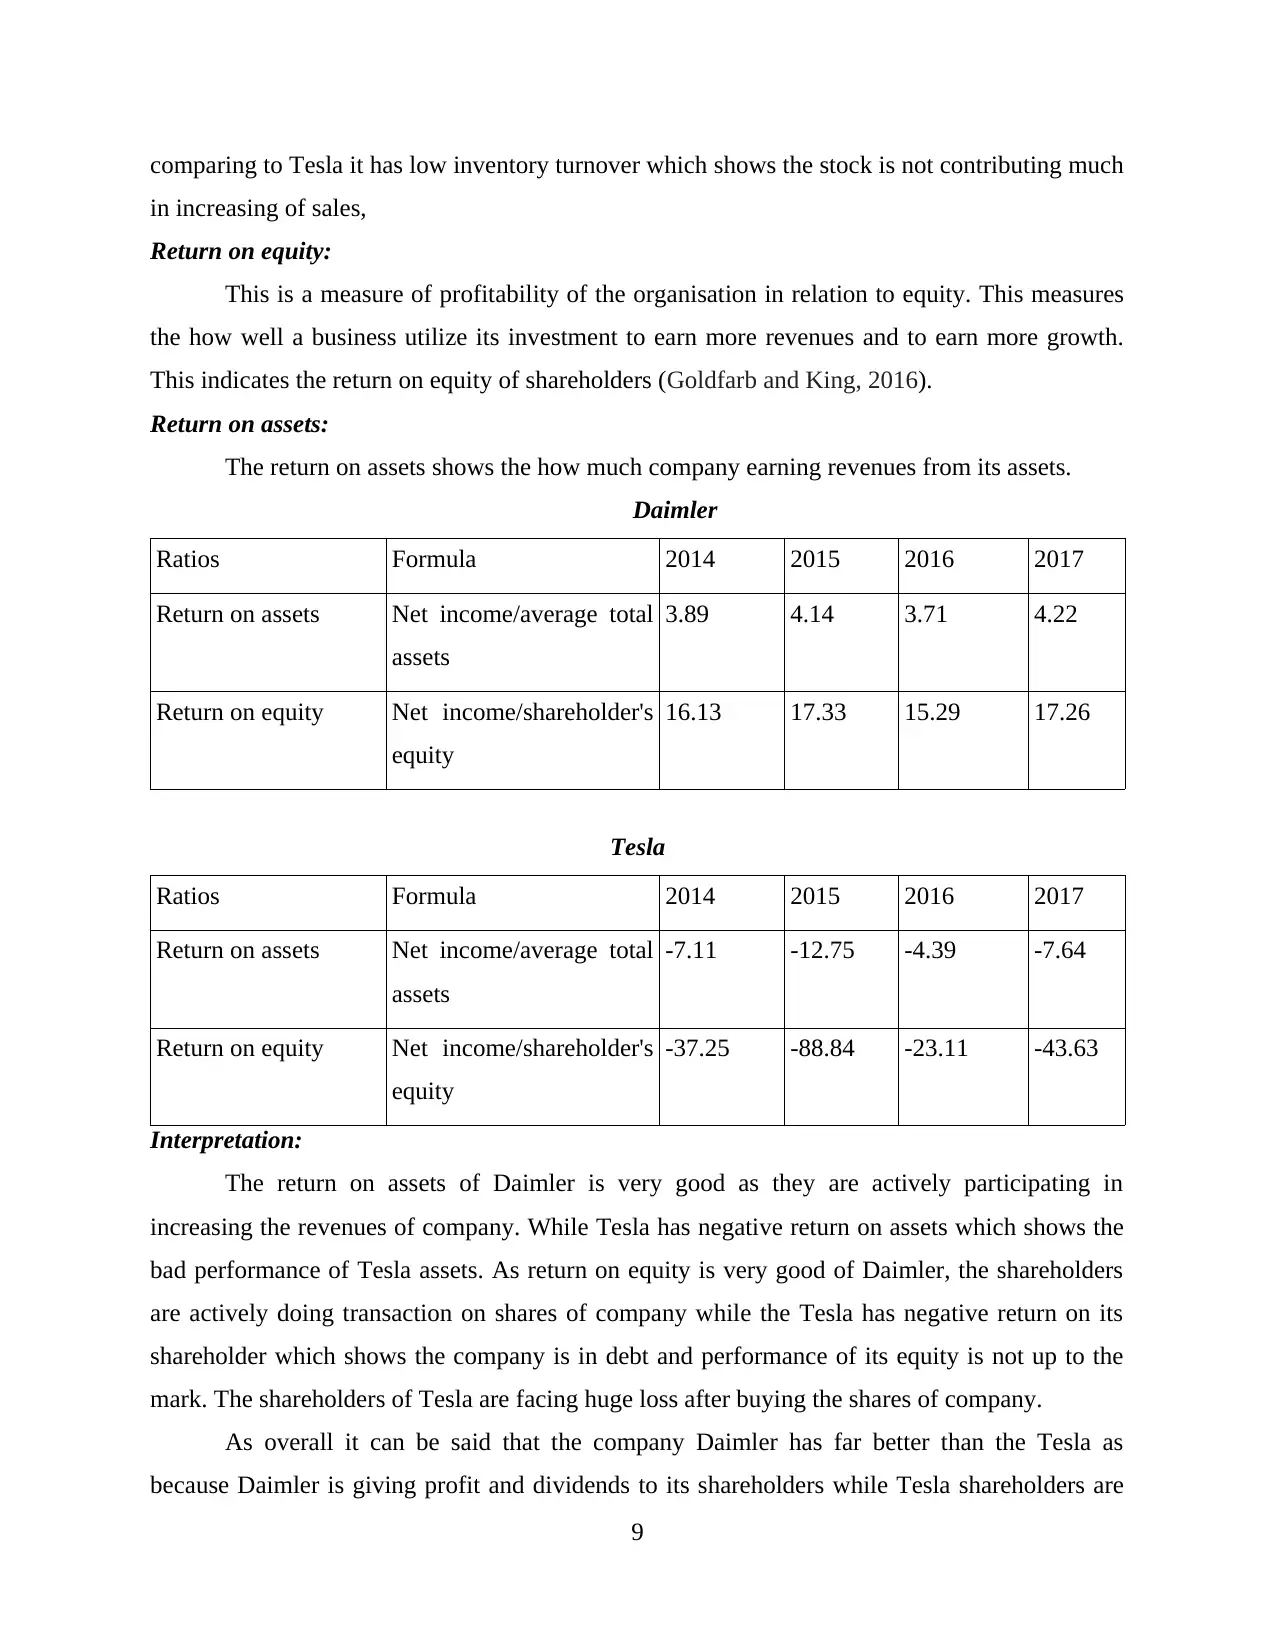
Return on equity:
This is a measure of profitability of the organisation in relation to equity. This measures
the how well a business utilize its investment to earn more revenues and to earn more growth.
This indicates the return on equity of shareholders (Goldfarb and King, 2016).
Return on assets:
The return on assets shows the how much company earning revenues from its assets.
Daimler
Ratios Formula 2014 2015 2016 2017
Return on assets Net income/average total
assets
3.89 4.14 3.71 4.22
Return on equity Net income/shareholder's
equity
16.13 17.33 15.29 17.26
Tesla
Ratios Formula 2014 2015 2016 2017
Return on assets Net income/average total
assets
-7.11 -12.75 -4.39 -7.64
Return on equity Net income/shareholder's
equity
-37.25 -88.84 -23.11 -43.63
Interpretation:
The return on assets of Daimler is very good as they are actively participating in
increasing the revenues of company. While Tesla has negative return on assets which shows the
bad performance of Tesla assets. As return on equity is very good of Daimler, the shareholders
are actively doing transaction on shares of company while the Tesla has negative return on its
shareholder which shows the company is in debt and performance of its equity is not up to the
mark. The shareholders of Tesla are facing huge loss after buying the shares of company.
As overall it can be said that the company Daimler has far better than the Tesla as
because Daimler is giving profit and dividends to its shareholders while Tesla shareholders are
9
in increasing of sales,
Return on equity:
This is a measure of profitability of the organisation in relation to equity. This measures
the how well a business utilize its investment to earn more revenues and to earn more growth.
This indicates the return on equity of shareholders (Goldfarb and King, 2016).
Return on assets:
The return on assets shows the how much company earning revenues from its assets.
Daimler
Ratios Formula 2014 2015 2016 2017
Return on assets Net income/average total
assets
3.89 4.14 3.71 4.22
Return on equity Net income/shareholder's
equity
16.13 17.33 15.29 17.26
Tesla
Ratios Formula 2014 2015 2016 2017
Return on assets Net income/average total
assets
-7.11 -12.75 -4.39 -7.64
Return on equity Net income/shareholder's
equity
-37.25 -88.84 -23.11 -43.63
Interpretation:
The return on assets of Daimler is very good as they are actively participating in
increasing the revenues of company. While Tesla has negative return on assets which shows the
bad performance of Tesla assets. As return on equity is very good of Daimler, the shareholders
are actively doing transaction on shares of company while the Tesla has negative return on its
shareholder which shows the company is in debt and performance of its equity is not up to the
mark. The shareholders of Tesla are facing huge loss after buying the shares of company.
As overall it can be said that the company Daimler has far better than the Tesla as
because Daimler is giving profit and dividends to its shareholders while Tesla shareholders are
9

facing huge loss. The reason behind this kind of performance of Tesla could be the behaviour of
CEO of Tesla, Elon Musk, who has smoke weed in live TV show and on that day the Tesla share
has fallen by the approx 6% to 7%. So these kind of behaviour Tesla is not performing good.
Horizontal Analysis
Horizontal analysis is the analysis of financial statement to compare between the two
years. It shows the changes between the two years and tell about company whether its increasing
or decreasing.
Horizontal Analysis for Daimler
Particular 2017 2016 Change amount Percentage
Cash 12072 10981 1091 9.04
Short term
investment
11418 11832 -414 -3.63
Receivables 43792 41719 2073 4.73
Inventories 25686 25384 302 1.18
Prepaid expenses 632 566 66 10.44
Other current
assets
13135 11570 1565 11.91
Horizontal Analysis for Tesla
Particular 2017 2016 Change amount Percentage
Cash - - - -
Cash and cash
equivalent
3368 3393 -25 -0.74
Receivables 515 499 16 3.11
Inventories 2264 2067 197 8.7
Prepaid expenses 268 194 74 27.61
Other current 155 106 49 31.61
10
⊘ This is a preview!⊘
Do you want full access?
Subscribe today to unlock all pages.
Trusted by 1+ million students worldwide
1 out of 20
Related Documents


Your All-in-One AI-Powered Toolkit for Academic Success.
+13062052269
info@desklib.com
Available 24*7 on WhatsApp / Email
![[object Object]](/_next/static/media/star-bottom.7253800d.svg)
Unlock your academic potential
Copyright © 2020–2026 A2Z Services. All Rights Reserved. Developed and managed by ZUCOL.