BX3083 Strategic Marketing: Dairy Industry Analysis & Strategies
VerifiedAdded on 2023/04/21
|19
|4346
|299
Case Study
AI Summary
This case study analyzes the Australian dairy industry, focusing on the product life cycle (PLC) of cheese and butter, and the marketing strategies that dairy producers can employ at each stage. It examines the sales growth rates and market share of Dairy Producer A (DP A) across different milk products, using the BCG matrix for portfolio analysis. The study also discusses the impact of supermarket pricing on the attractiveness of the dairy industry and explores the relationship between dairy farmers, supermarkets, and dairy producers. Finally, it recommends strategies for increasing market power among farmers, considering both collective (supply management, collective marketing) and individual (contract farming) approaches, providing a comprehensive overview of the dairy industry's strategic marketing landscape. Desklib provides similar solved assignments and past papers for students.
Running head: MARKETING AND STRATEGY
Marketing and Strategy
Name of the Student
Name of the University
Author’s Note
Marketing and Strategy
Name of the Student
Name of the University
Author’s Note
Paraphrase This Document
Need a fresh take? Get an instant paraphrase of this document with our AI Paraphraser
1MARKETING AND STRATEGY
Table of Contents
Introduction..........................................................................................................................3
Answer to Question 1..........................................................................................................3
1. PLC of Cheese.................................................................................................................3
2. PLC of Butter...................................................................................................................4
3. Challenges which needs to be overcome by the marketer of cheese and butter..............5
4. Marketing strategy suggested at each stage of PLC........................................................6
4.1 Development Phase...................................................................................................6
4.2 Introduction stage......................................................................................................6
4.3 Growth stage..............................................................................................................7
4.4 Maturity stage............................................................................................................7
4.5 Decline Stage.............................................................................................................7
Answer to Question 2..........................................................................................................8
5. Sales growth rate of the products.....................................................................................8
6. Market share of DP A......................................................................................................8
7. Supermarket pricing affecting the attractiveness of their industry................................10
8. Connection between dairy farmers, supermarkets and dairy producers........................11
9. Strategies recommended for increasing market power among the farmers...................12
10. Benefits of considering collective strategies...............................................................13
10.1 Management of supply..........................................................................................13
10.2 Collective Marketing Approach............................................................................13
2MARKETING AND STRATEGY
11. Benefits of adoption of individual strategies...............................................................13
11.1 Contract farming....................................................................................................13
Conclusion.........................................................................................................................14
References..........................................................................................................................15
List of appendixes..............................................................................................................17
⊘ This is a preview!⊘
Do you want full access?
Subscribe today to unlock all pages.
Trusted by 1+ million students worldwide
3MARKETING AND STRATEGY
Introduction
The study is intended to discuss on the PLC which are needed to be addressed by Beyond
the Dairy Farm Gate. In order to address this, the study has included the discussion on the
marketing strategies which may be used by diary producers at every stage. The next section of
the sturdy has referred to exhibits provided with the study to elaborate and determine the
portfolio matrix pertaining to the dairy producer DP A. in response to this the main question is
concerned with including only the milk sales for 2008- 2009 and 2009-2010. The latter part of
the study has discussed the manner in which is concerned with the pricing of the major
supermarket which are seen to affect the attractiveness of the dairy industry. In order to address
this, the study shown the steps which the diary producers take for dealing with market power
(Ulubasoglu et al. 2016).
Answer to Question 1
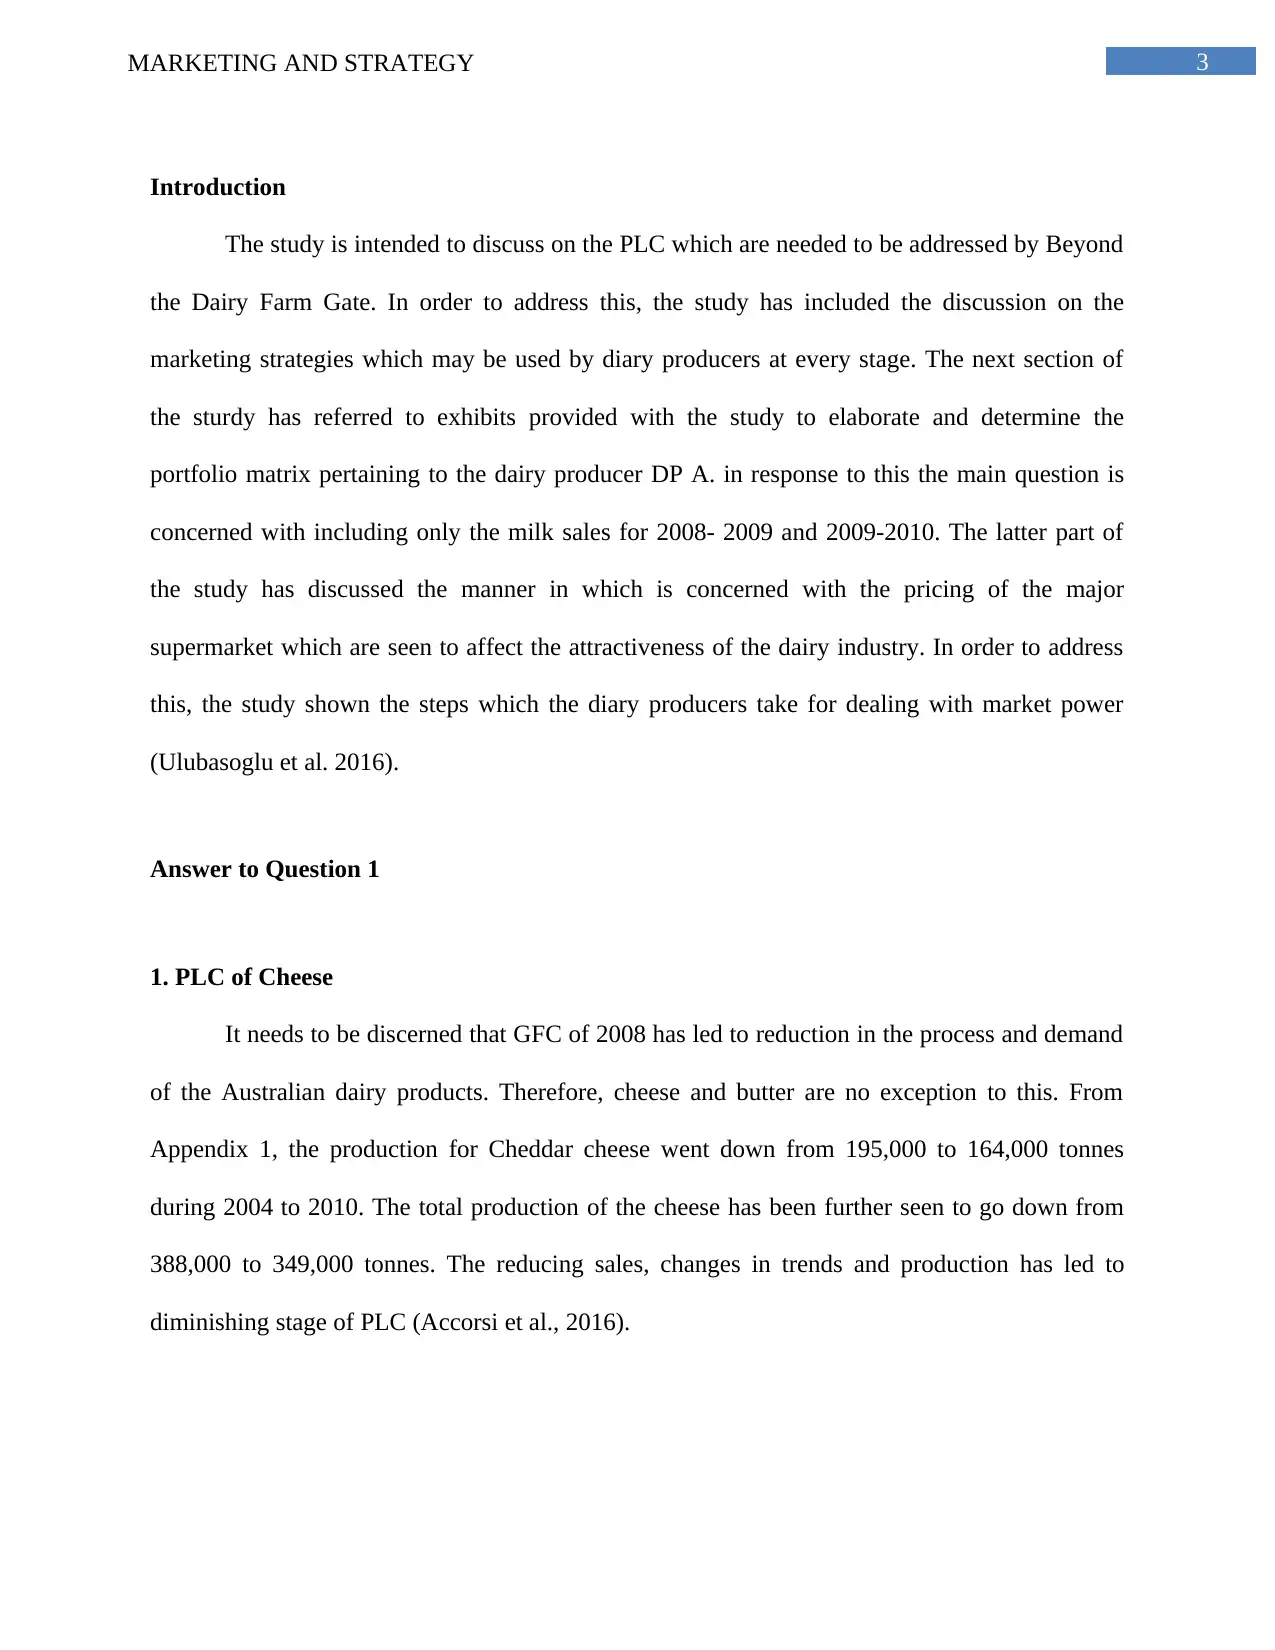
1. PLC of Cheese
It needs to be discerned that GFC of 2008 has led to reduction in the process and demand
of the Australian dairy products. Therefore, cheese and butter are no exception to this. From
Appendix 1, the production for Cheddar cheese went down from 195,000 to 164,000 tonnes
during 2004 to 2010. The total production of the cheese has been further seen to go down from
388,000 to 349,000 tonnes. The reducing sales, changes in trends and production has led to
diminishing stage of PLC (Accorsi et al., 2016).
Introduction
The study is intended to discuss on the PLC which are needed to be addressed by Beyond
the Dairy Farm Gate. In order to address this, the study has included the discussion on the
marketing strategies which may be used by diary producers at every stage. The next section of
the sturdy has referred to exhibits provided with the study to elaborate and determine the
portfolio matrix pertaining to the dairy producer DP A. in response to this the main question is
concerned with including only the milk sales for 2008- 2009 and 2009-2010. The latter part of
the study has discussed the manner in which is concerned with the pricing of the major
supermarket which are seen to affect the attractiveness of the dairy industry. In order to address
this, the study shown the steps which the diary producers take for dealing with market power
(Ulubasoglu et al. 2016).
Answer to Question 1
1. PLC of Cheese
It needs to be discerned that GFC of 2008 has led to reduction in the process and demand
of the Australian dairy products. Therefore, cheese and butter are no exception to this. From
Appendix 1, the production for Cheddar cheese went down from 195,000 to 164,000 tonnes
during 2004 to 2010. The total production of the cheese has been further seen to go down from
388,000 to 349,000 tonnes. The reducing sales, changes in trends and production has led to
diminishing stage of PLC (Accorsi et al., 2016).
Paraphrase This Document
Need a fresh take? Get an instant paraphrase of this document with our AI Paraphraser
4MARKETING AND STRATEGY
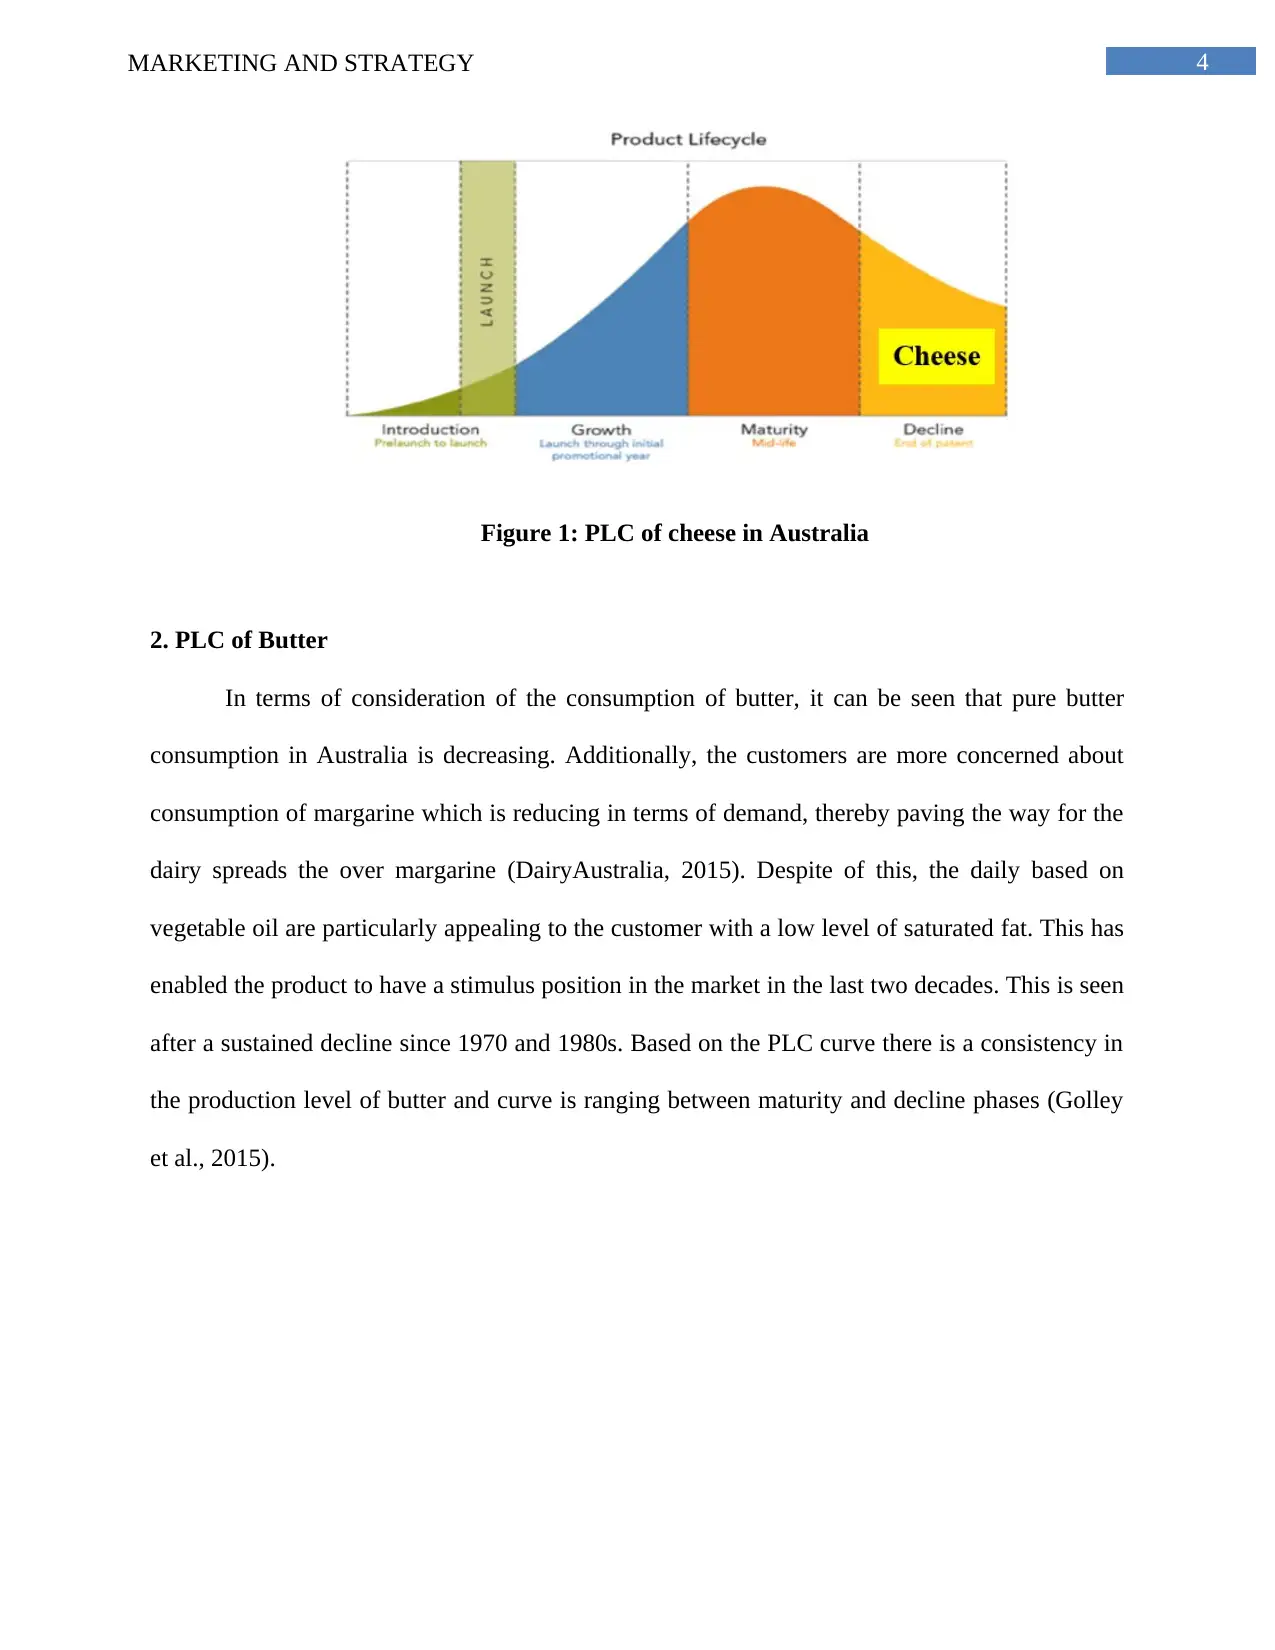
Figure 1: PLC of cheese in Australia
2. PLC of Butter
In terms of consideration of the consumption of butter, it can be seen that pure butter
consumption in Australia is decreasing. Additionally, the customers are more concerned about
consumption of margarine which is reducing in terms of demand, thereby paving the way for the
dairy spreads the over margarine (DairyAustralia, 2015). Despite of this, the daily based on
vegetable oil are particularly appealing to the customer with a low level of saturated fat. This has
enabled the product to have a stimulus position in the market in the last two decades. This is seen
after a sustained decline since 1970 and 1980s. Based on the PLC curve there is a consistency in
the production level of butter and curve is ranging between maturity and decline phases (Golley
et al., 2015).
5MARKETING AND STRATEGY
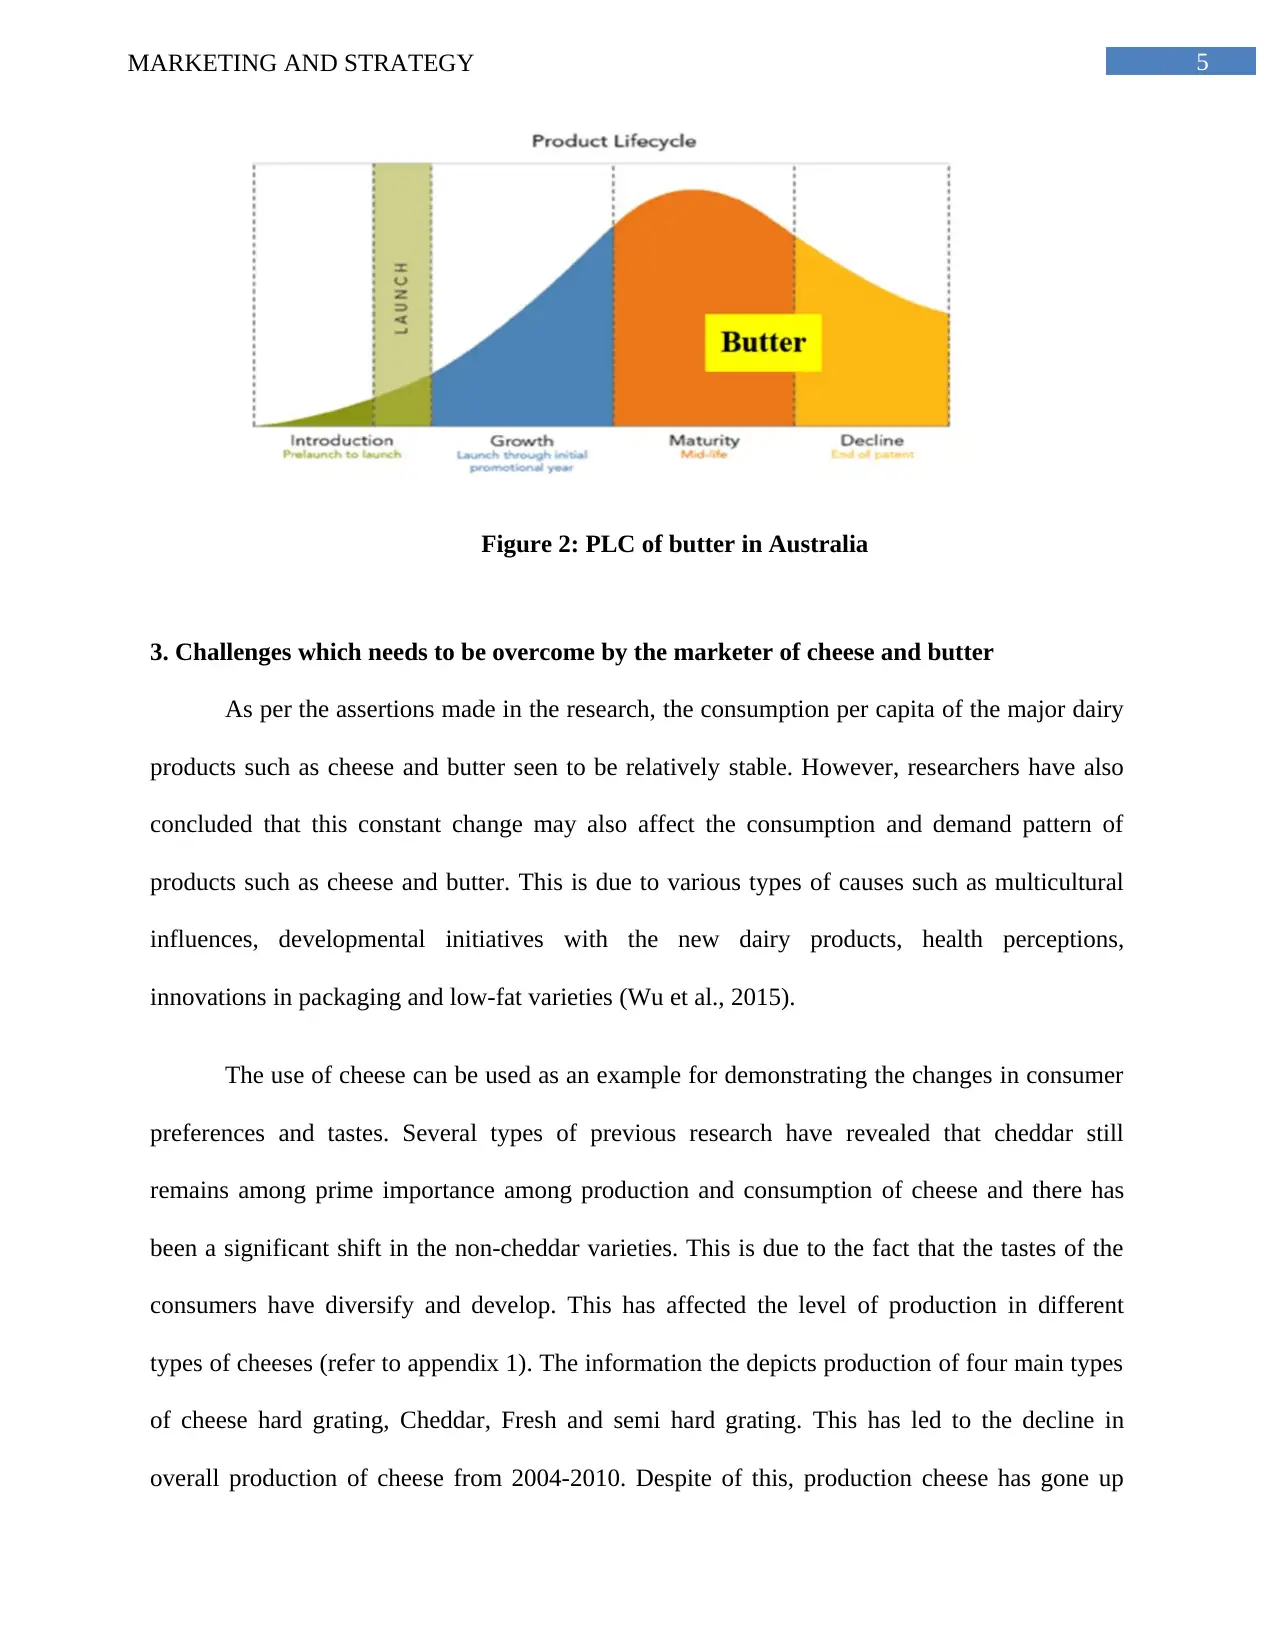
Figure 2: PLC of butter in Australia
3. Challenges which needs to be overcome by the marketer of cheese and butter
As per the assertions made in the research, the consumption per capita of the major dairy
products such as cheese and butter seen to be relatively stable. However, researchers have also
concluded that this constant change may also affect the consumption and demand pattern of
products such as cheese and butter. This is due to various types of causes such as multicultural
influences, developmental initiatives with the new dairy products, health perceptions,
innovations in packaging and low-fat varieties (Wu et al., 2015).
The use of cheese can be used as an example for demonstrating the changes in consumer
preferences and tastes. Several types of previous research have revealed that cheddar still
remains among prime importance among production and consumption of cheese and there has
been a significant shift in the non-cheddar varieties. This is due to the fact that the tastes of the
consumers have diversify and develop. This has affected the level of production in different
types of cheeses (refer to appendix 1). The information the depicts production of four main types
of cheese hard grating, Cheddar, Fresh and semi hard grating. This has led to the decline in
overall production of cheese from 2004-2010. Despite of this, production cheese has gone up
⊘ This is a preview!⊘
Do you want full access?
Subscribe today to unlock all pages.
Trusted by 1+ million students worldwide
6MARKETING AND STRATEGY
from 4,833 to 8,660 tonnes. This is almost 200% increase over the time period of six years. This
also shows the growth potential of cheese market in general (Sinning & Hasan, 2016).
The consumption of butter products on the other hand is depicted to be nearly decreasing
among Australian consumers. Therefore, the marketers need to explore the opportunities of
bringing in vegetable oil based dairy blends which are more attractive to the customers
pertaining to minimum level of saturated fat and other perceived health benefits. This is the main
reason why the production level of butter has remained constant (Henchion et al., 2017).
4. Marketing strategy suggested at each stage of PLC
4.1 Development Phase
This phase is seen to commence with companies developing and introducing a new idea
for cheese and butter products. In this stage, the product has to go through several modifications
which needs to consider a considerable amount of time and money at the developmental stage. In
case of butter and cheese product, the market is often produced in a real marketplace and the
introduction phase is seen to begin with the product itself. This is seen as the time of spending
with minimum sales, no return and negative revenues for the company (Murphy et al., 2017).
4.2 Introduction stage
This stage considers the period of cheese and butter when initial acceptance of both butter
and cheese in the market is doubtful in nature. The profits are designed to be almost non-existent
due to increased marketing and other expenses. The objective of butter and cheese in the
introduction stage is identified to attract many customers by creating awareness and interest for
people trying and buying the products. If the company is assured about gaining a considerable
market share of cheese and butter, then the marketers can combine promotion and price variables
for generating heavy promotion with low price. This will reduce the overall price and put
Paraphrase This Document
Need a fresh take? Get an instant paraphrase of this document with our AI Paraphraser
7MARKETING AND STRATEGY
stronger emphasis on promotion of the products despite of reducing the amount of profit. This
may be also compensated with high volumes and at times there may be no profit in this stage
however if the market share is a cash cow tomorrow then should be accepted (Gale, Hansen &
Jewison, 2015).
4.3 Growth stage
At the time of the growth period, there may be a substantial improvement in the profit of
cheese and butter companies. In this phase, the marketing strategy may shift from the customer
acquisition and retention and brand loyalty. The main objective in this case is seen with
maximising the market share and focusing on advertising and promotion which may not be like
the introductory phase as it is not focused towards taking advantage of increased consumer
demand of the product. It is also a suitable stage for building intensive distribution so that the
forms can tend to incorporate the strategies in UK shops and supermarkets for convenience of
the customers and ensuring the availability of better cheese and butter products (Hogan, 2017).
4.4 Maturity stage
The stage comprises of intense rivalry pertaining to the mature market. The firms are
having the scope of obtaining high profit and low cost per customer. However, there is a scope
for peak sales to occur in the state. The maturity phase is seen as the period where there is a
decline in sales growth and margins reduces leading to decreasing profit. Thus, the strategies of
butter and cheese is often pushed forward by the marketers by introducing new marketing
channels, attractive advertising and granting price concessions for varied users of the product
(Benkerroum, 2016).
4.5 Decline Stage
It can be final in four that the butter and the sales tend to go downwards and it is
sometimes difficult for the firms to conceptualize declining trend of the product. In this phase,
8MARKETING AND STRATEGY
the main objective of the marketing is identified with reducing overall expenditure on branding
of milk. Despite of this, the exit barrier may restrict the forms for easy exit due to costs
associated to labour settlements and contingent liabilities for land uses. Therefore, all benefits
need to be thoroughly analyzed with respect to marketing objectives of the decline phase (Valin
et al., 2014).
Answer to Question 2
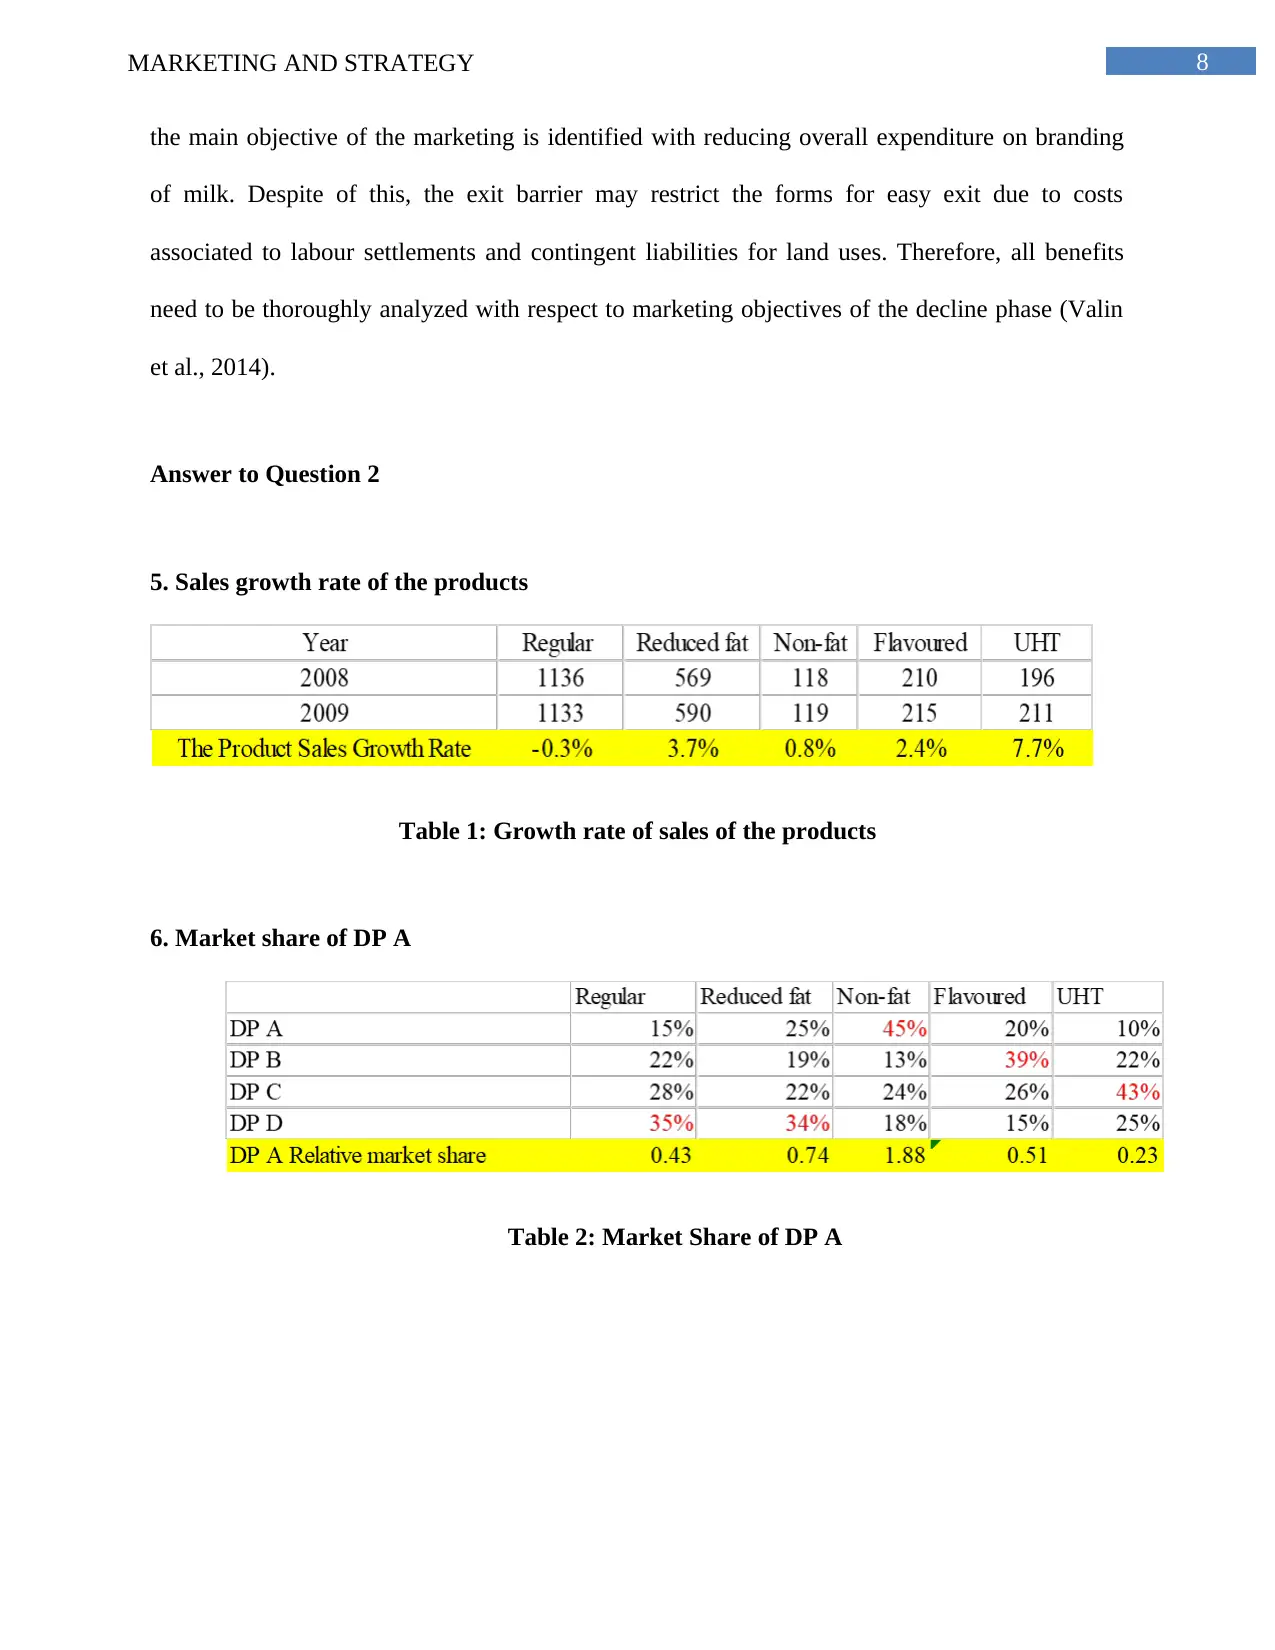
5. Sales growth rate of the products
Table 1: Growth rate of sales of the products
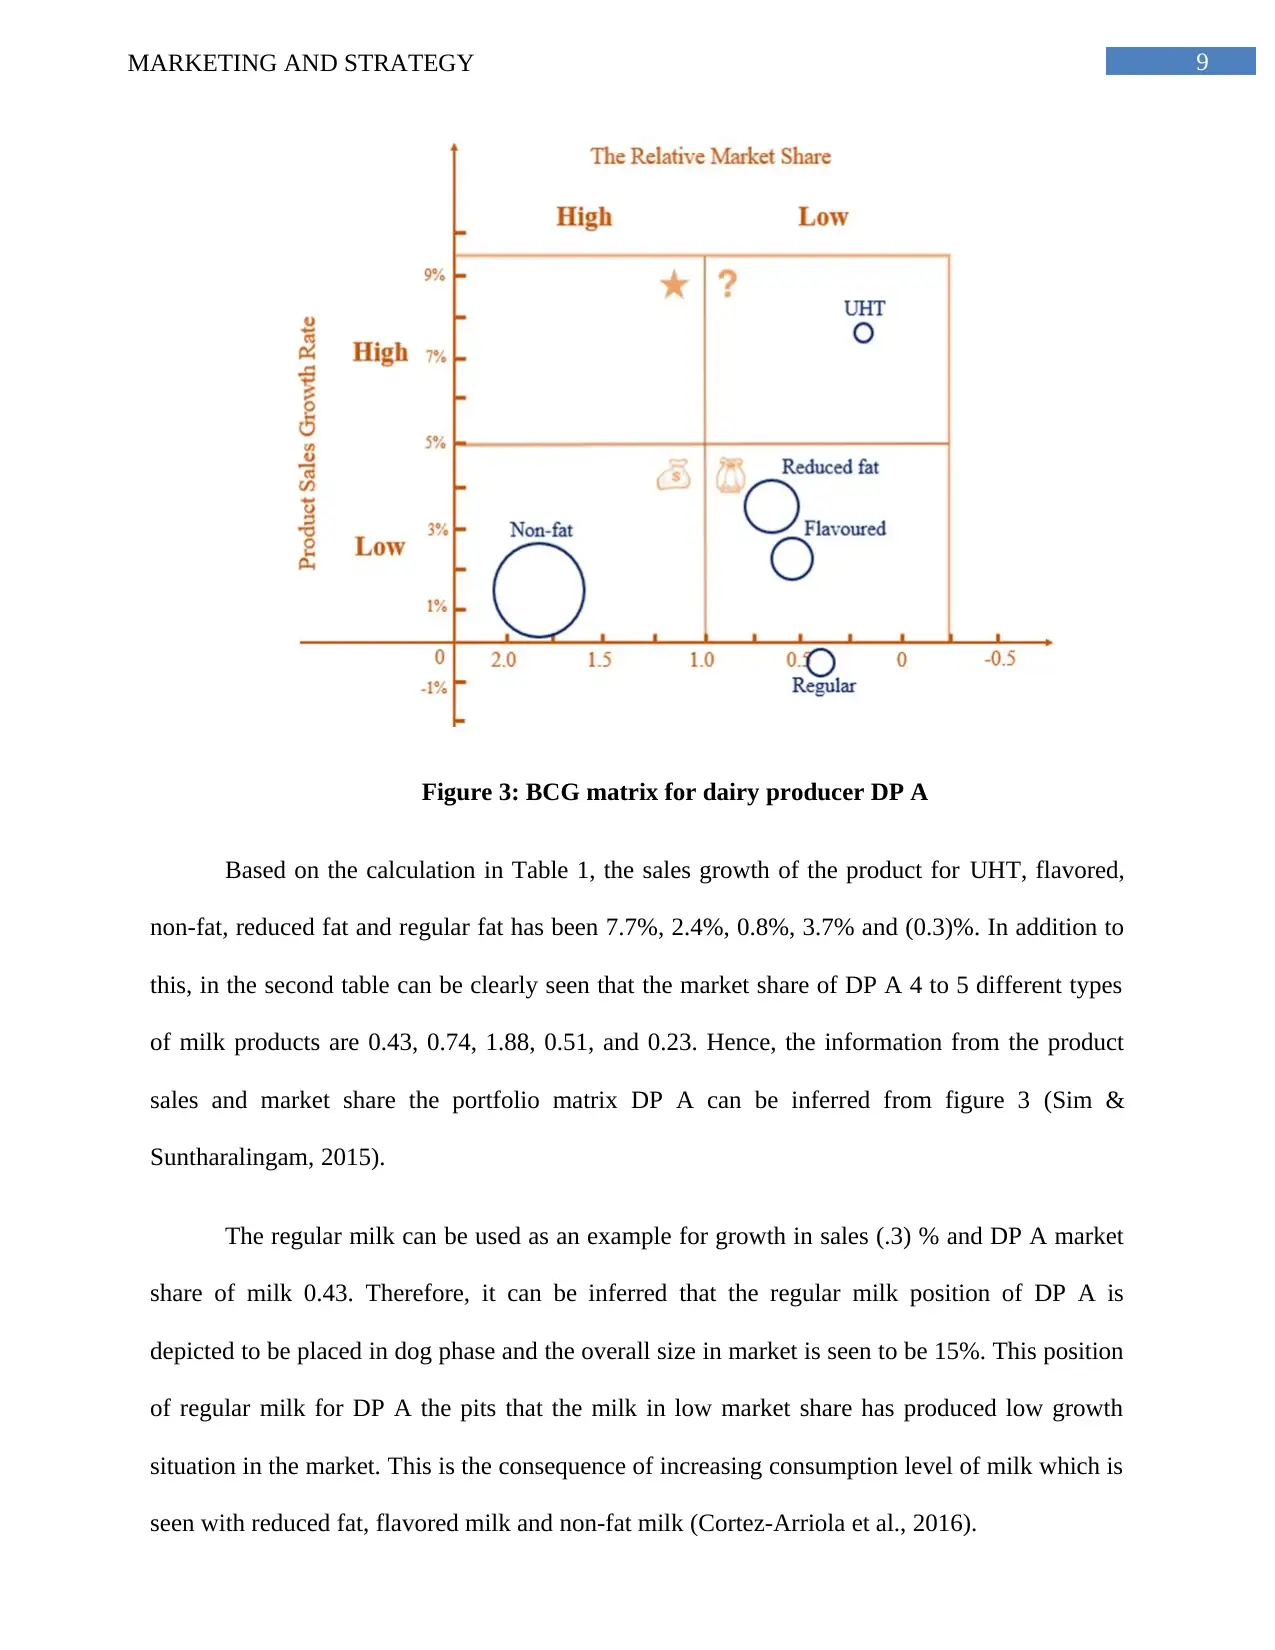
6. Market share of DP A
Table 2: Market Share of DP A
the main objective of the marketing is identified with reducing overall expenditure on branding
of milk. Despite of this, the exit barrier may restrict the forms for easy exit due to costs
associated to labour settlements and contingent liabilities for land uses. Therefore, all benefits
need to be thoroughly analyzed with respect to marketing objectives of the decline phase (Valin
et al., 2014).
Answer to Question 2
5. Sales growth rate of the products
Table 1: Growth rate of sales of the products
6. Market share of DP A
Table 2: Market Share of DP A
⊘ This is a preview!⊘
Do you want full access?
Subscribe today to unlock all pages.
Trusted by 1+ million students worldwide
9MARKETING AND STRATEGY
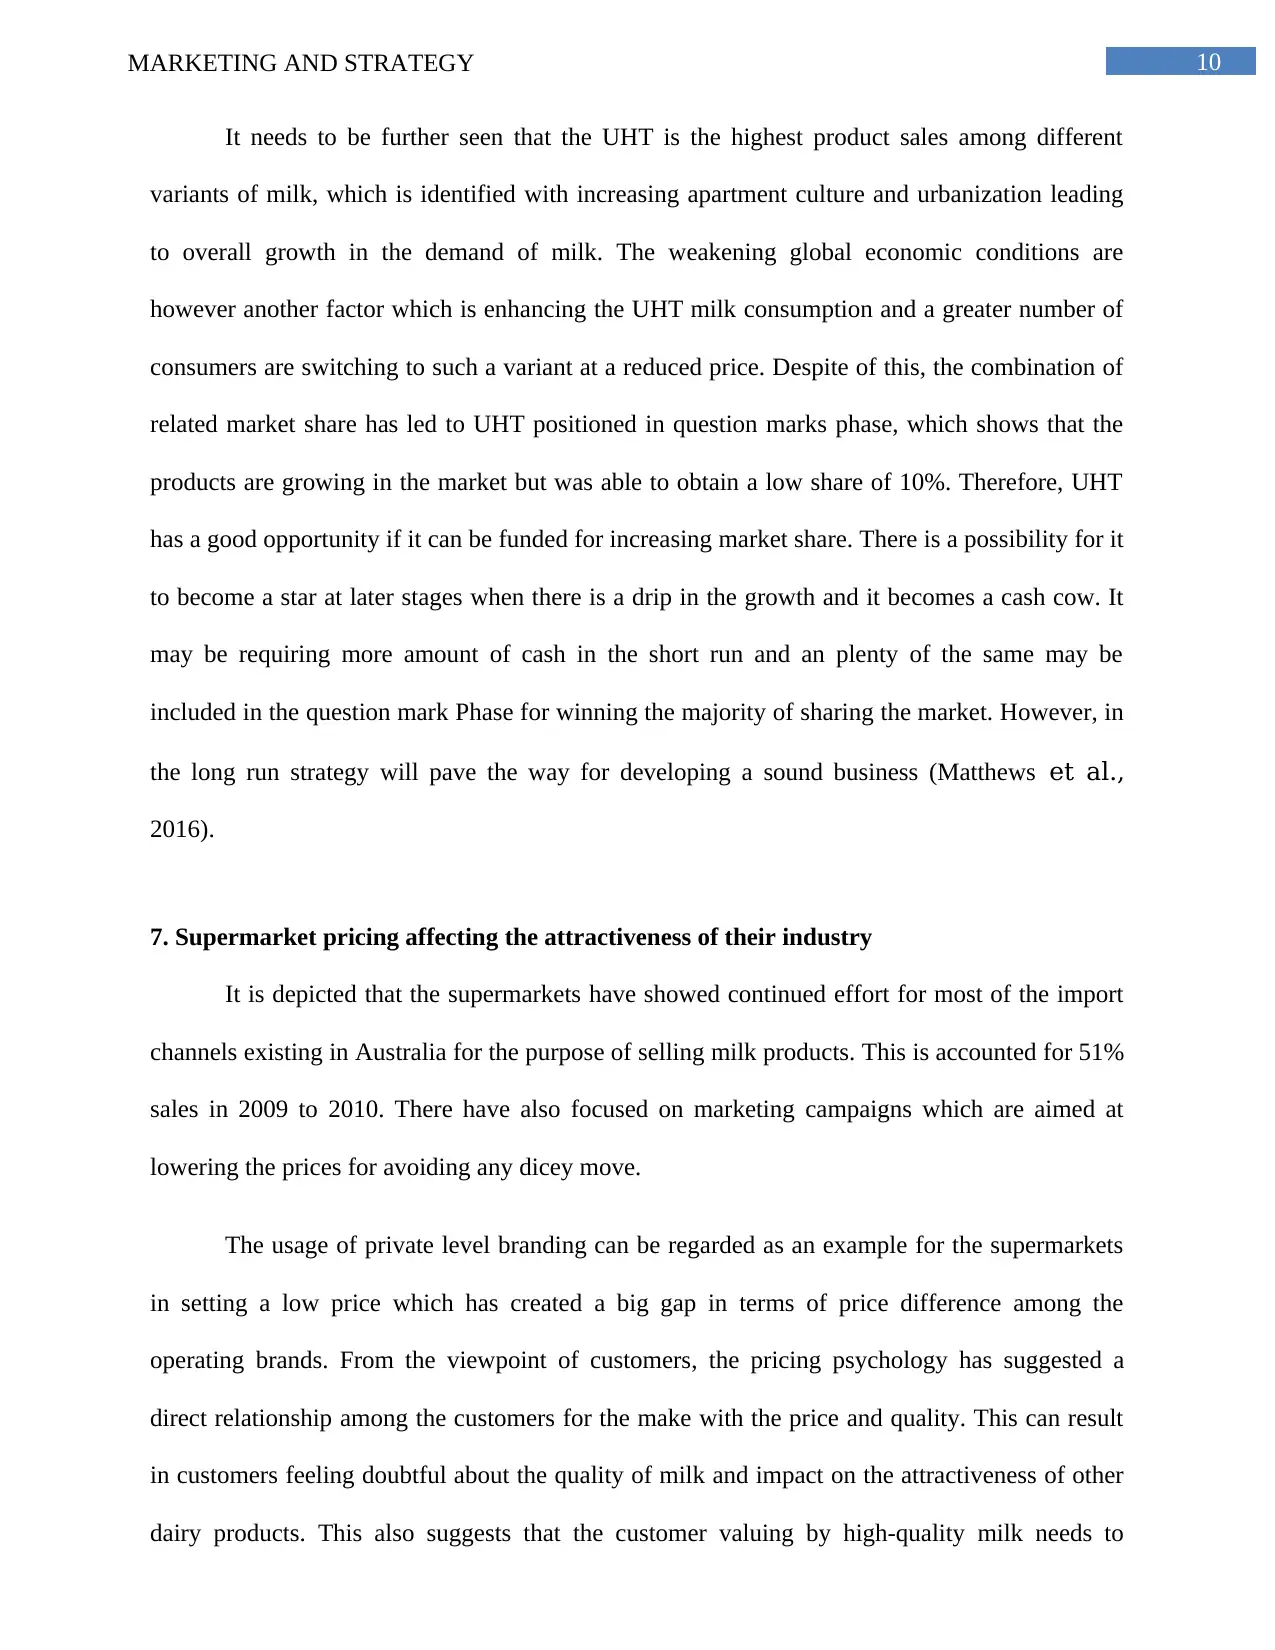
Figure 3: BCG matrix for dairy producer DP A
Based on the calculation in Table 1, the sales growth of the product for UHT, flavored,
non-fat, reduced fat and regular fat has been 7.7%, 2.4%, 0.8%, 3.7% and (0.3)%. In addition to
this, in the second table can be clearly seen that the market share of DP A 4 to 5 different types
of milk products are 0.43, 0.74, 1.88, 0.51, and 0.23. Hence, the information from the product
sales and market share the portfolio matrix DP A can be inferred from figure 3 (Sim &
Suntharalingam, 2015).
The regular milk can be used as an example for growth in sales (.3) % and DP A market
share of milk 0.43. Therefore, it can be inferred that the regular milk position of DP A is
depicted to be placed in dog phase and the overall size in market is seen to be 15%. This position
of regular milk for DP A the pits that the milk in low market share has produced low growth
situation in the market. This is the consequence of increasing consumption level of milk which is
seen with reduced fat, flavored milk and non-fat milk (Cortez-Arriola et al., 2016).
Paraphrase This Document
Need a fresh take? Get an instant paraphrase of this document with our AI Paraphraser
10MARKETING AND STRATEGY
It needs to be further seen that the UHT is the highest product sales among different
variants of milk, which is identified with increasing apartment culture and urbanization leading
to overall growth in the demand of milk. The weakening global economic conditions are
however another factor which is enhancing the UHT milk consumption and a greater number of
consumers are switching to such a variant at a reduced price. Despite of this, the combination of
related market share has led to UHT positioned in question marks phase, which shows that the
products are growing in the market but was able to obtain a low share of 10%. Therefore, UHT
has a good opportunity if it can be funded for increasing market share. There is a possibility for it
to become a star at later stages when there is a drip in the growth and it becomes a cash cow. It
may be requiring more amount of cash in the short run and an plenty of the same may be
included in the question mark Phase for winning the majority of sharing the market. However, in
the long run strategy will pave the way for developing a sound business (Matthews et al.,
2016).
7. Supermarket pricing affecting the attractiveness of their industry
It is depicted that the supermarkets have showed continued effort for most of the import
channels existing in Australia for the purpose of selling milk products. This is accounted for 51%
sales in 2009 to 2010. There have also focused on marketing campaigns which are aimed at
lowering the prices for avoiding any dicey move.
The usage of private level branding can be regarded as an example for the supermarkets
in setting a low price which has created a big gap in terms of price difference among the
operating brands. From the viewpoint of customers, the pricing psychology has suggested a
direct relationship among the customers for the make with the price and quality. This can result
in customers feeling doubtful about the quality of milk and impact on the attractiveness of other
dairy products. This also suggests that the customer valuing by high-quality milk needs to
11MARKETING AND STRATEGY
perceive the quality of private label as poorer in nature. In addition to this, the supermarkets have
set milk price to as low as $ 1 milk per liter and the customers those who are price sensitive are
able to easily compare the prices of two products which has resulted in increased sales of lower
priced private label milk similar to regular and reduced fat (Yantcheva et al., 2016).
8. Connection between dairy farmers, supermarkets and dairy producers
The relationship of dairy farmers, supermarkets and dairy producers is intricate in nature.
The Australian dairy farmers have warned about running short of milk supply is soon and the
industry may face severe deregulation. The farmers have also accused the supermarkets and
processors responsible for such a dispute. An appropriate example of complexity in the industry
is evident with the price war which occurred between Coles and Woolworths in 2011 and lead to
reduced prices. This particular case has confirmed our farmers aware of the considerable
imbalance in the market power and weakening bargaining position. In addition to this, the
processors often, under pressure from the export market competition and supermarkets for using
relative bargaining power and shifting risks on the dairy farmers (Wu et al., 2015).
Due to this incident, the farmers get paid same for milk whether it was sold as private
label or under a more expensive branding. The increase in the retail milk prices showed the
probability of likely results of supermarkets in earning higher profits and creating no difference
for the struggling farmers as processor would have been set for farm gate prices just to the level
which would have been significant to secure the milk which they needed. Additionally, the
imbalance of power was seen among the farmers by entering into supply contracts pertaining to
an unclear pricing terms which discouraged them from changing a rival processor. Henceforth,
measures need to be taken for addressing such poor positioning of dairy farmers in the country
(Golley et al., 2015).
⊘ This is a preview!⊘
Do you want full access?
Subscribe today to unlock all pages.
Trusted by 1+ million students worldwide
1 out of 19


Your All-in-One AI-Powered Toolkit for Academic Success.
+13062052269
info@desklib.com
Available 24*7 on WhatsApp / Email
![[object Object]](/_next/static/media/star-bottom.7253800d.svg)
Unlock your academic potential
Copyright © 2020–2026 A2Z Services. All Rights Reserved. Developed and managed by ZUCOL.