Case Study: Strategic Marketing in the Australian Dairy Industry
VerifiedAdded on 2023/06/15
|16
|4479
|324
Case Study
AI Summary
This case study analyzes the Australian dairy industry using the 7-step case analysis framework. It addresses the product life cycle of cheese and butter, suggesting marketing strategies for each stage, and interprets a portfolio matrix for dairy producer DP A based on milk sales data. It also examines the impact of supermarket pricing strategies on the dairy industry and recommends steps for dairy producers to manage supermarket market power. The analysis includes insights on changing consumer preferences, market share, and the importance of focusing on growing product categories like UHT milk. This document is available on Desklib, a platform offering a wide range of study resources and solved assignments for students.
Running Head: Strategic Marketing
Australian Daily Industry
Strategic Marketing
Case Study Questions
Australian Daily Industry
Strategic Marketing
Case Study Questions
Paraphrase This Document
Need a fresh take? Get an instant paraphrase of this document with our AI Paraphraser
Strategic Marketing P a g e | 1
Table of Content
Introduction...........................................................................................................................................2
Question 1.............................................................................................................................................3
Answer 1................................................................................................................................................3
Product life cycle Stages....................................................................................................................4
Introduction Stage.................................................................................................................4
Growth stage-........................................................................................................................4
Maturity stage.......................................................................................................................4
Decline stage..........................................................................................................................4
Marketing Strategies.........................................................................................................................5
Question 2.............................................................................................................................................6
Answer 2................................................................................................................................................6
Exhibit 4.............................................................................................................................................7
Interpretation....................................................................................................................................8
Exhibit 5.............................................................................................................................................8
Question 4...........................................................................................................................................10
Answer.................................................................................................................................................11
References...........................................................................................................................................14
Strategic Marketing P a g e | 2
Introduction
The case study here is based on the Australian Dairy Milk industry; the report contains many
exhibits and insights on the sale of different dairy products. It has been seen that the
Australian industry despite facing a tough time in the year 2008 was resilient; however its
international demand was falling (Australia, 2017). The case study has 4 questions which
need to be answered in the purview of 7 step case analysis framework, which goes as:
Situation Analysis
Assumption and missing information
Statement of Problem
Development of alternatives
Evaluation of alternatives and recommendation
Implementation
Evaluation and Control
⊘ This is a preview!⊘
Do you want full access?
Subscribe today to unlock all pages.
Trusted by 1+ million students worldwide
Strategic Marketing P a g e | 3
Question 1
Discuss the product life cycle (PLC) of cheese and butter and the issues that need to be
addressed by the marketers of these two products. In addressing this question you must
include a discussion on the marketing strategies that could be used by dairy producers at
each stage of the PLC
Answer 1
The global economic downturn of the year 2008 resulted in decreasing demand and prices
for the Australian dairy demands. However, due to the economic momentum in 2010, the
dairy farmers are optimistic about the growth of the industry (Rad & Lewis, 2014). The
industry has in all 4 main product, milk, cheese, butter and butter, out of the entire produce
around 40% is consumed domestically the other goes to international exports(Beggs, Fisher,
Jongman & Hemsworth,2015) The relationship between the dairy farmers and the super
market is extremely complicated, and it is a matter of time who will win the batter.
Paraphrase This Document
Need a fresh take? Get an instant paraphrase of this document with our AI Paraphraser
Strategic Marketing P a g e | 4
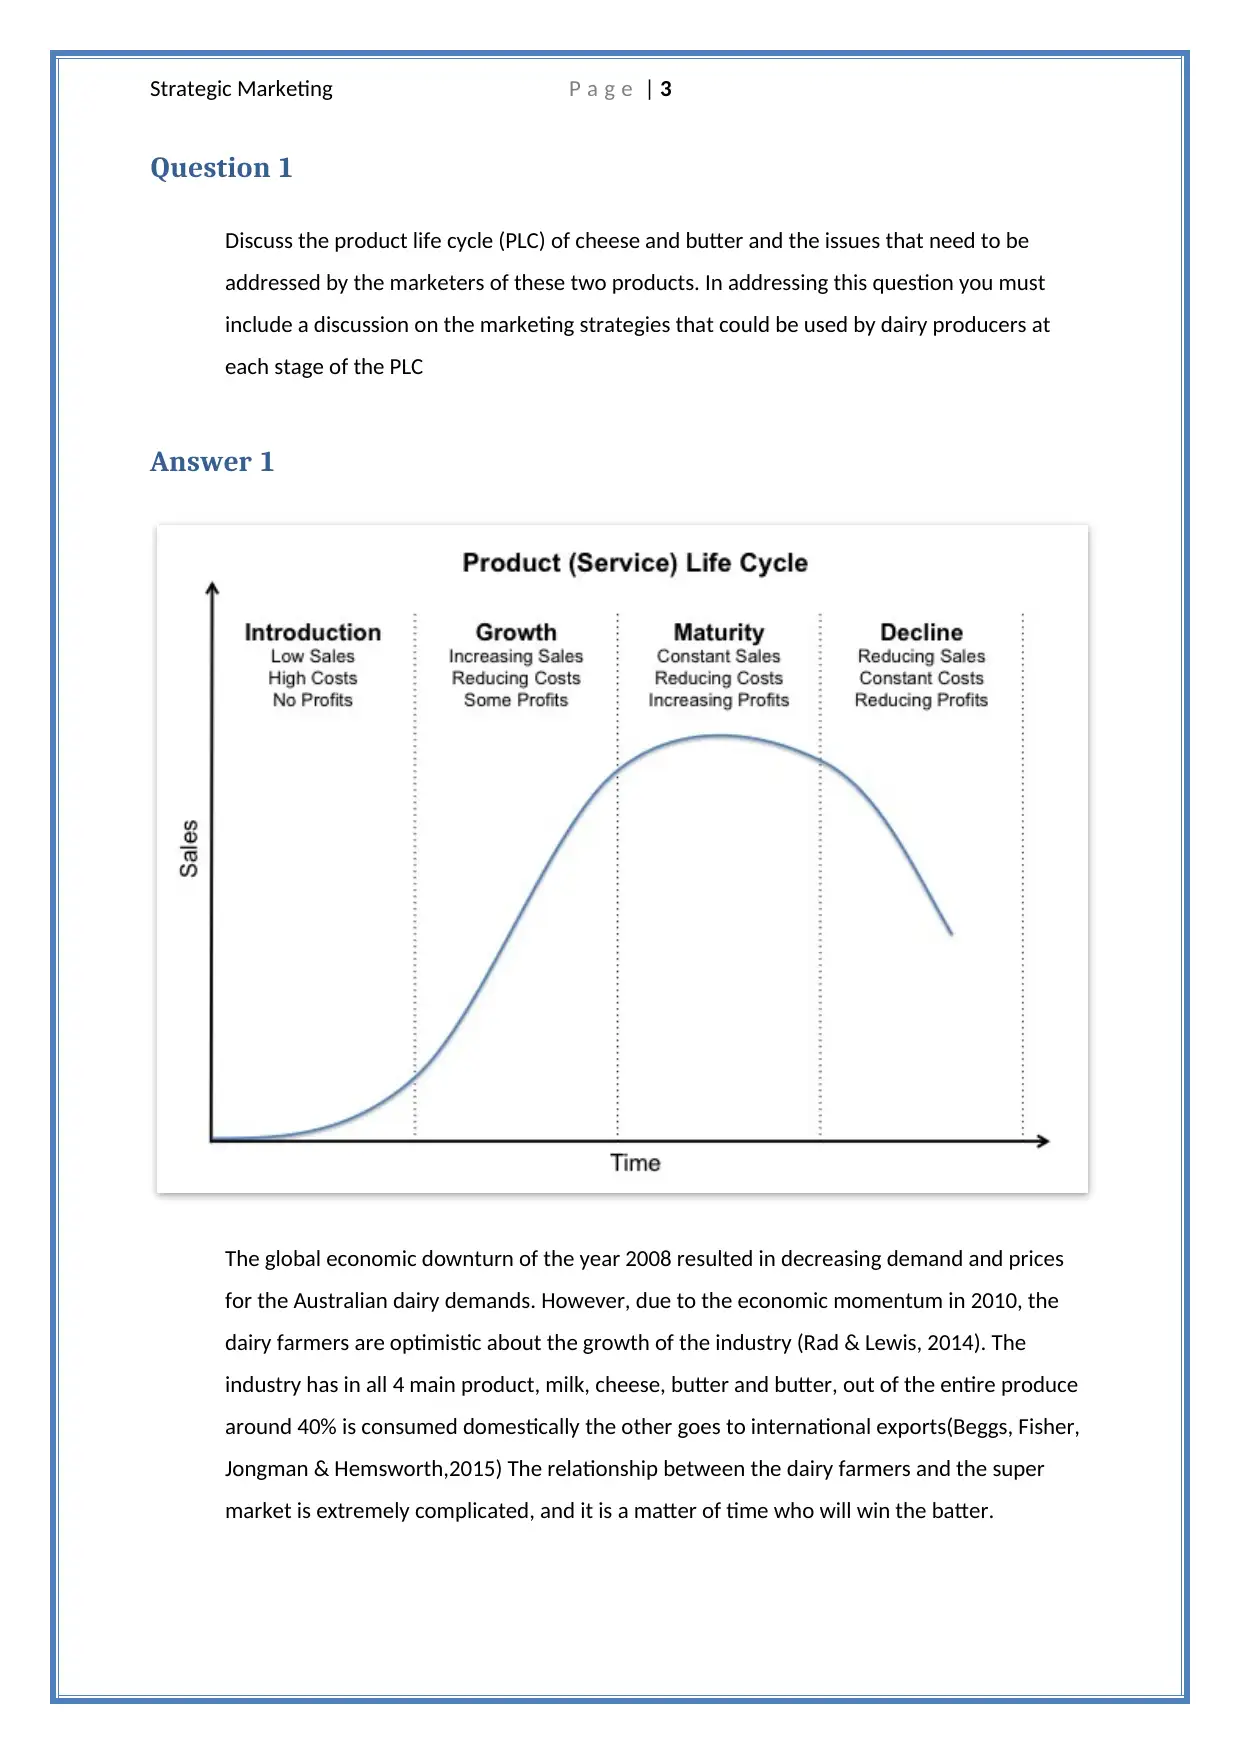
Life can be seen as a series of development and changes which results in peak, decline and
eventually demise. Similarly, consumer products also go through the four distinct cycles in
the entire life, the implication of life cycle stages for managers is to create strategies to
maximize the profits of the company (Stark, 2015).
Product life cycle Stages
Introduction Stage-This is the stage when the product is new and unknown to the
customers, people involved in the early age are innovators and some being part of the early
adopters. During this stage the strategy has to be proactive in order to win over other
customers. Butter and cheese are the products which are already known to the marketers;
hence they don’t have to spend much in increasing the awareness of the product. However,
they have to use different variant of Cheese which are becoming popular in the market to
increase the penetration. In terms of monetary transaction, the revenues and profits are low
and negative and the industry has to be buckled up towards the marketing
spend(Armstrong, Kotler, Harker & Brennan,2015)
Growth stage-At this stage, customers have good awareness about the product and the
company earns benefit from the stage. At the same time, the production capacity can be
increased of butter and cheese resulting in the economies of scale. In this stage, competition
increases and price becomes an important part of the marketing strategy here (Bilir, 2014).
Maturity stage-This is the stage of the PLC when the market becomes extremely saturated.
This stage is accompanied by reducing production cost which eventually leads to economies
of scale and experience. Cheese and Butter are already in the maturity stage, and the
industry is in price wars with the supermarkets (Fantake & Jolliet, 2016).
Decline stage-This is the last stage of the PLC and is masked by decreasing or stabilized
sales. This stage results in lower price margins. At this point the product is discontinued, this
is the stage which is most useful for butter and cheese, Form this point they should start the
PLC of different variety of cheese and butter to further penetrate the market (Tao & Yu,
2018).
The analysis of Product life cycle for Butter and Cheese of dairy industry of Australia implies
that the product is in the maturity stage and before it gets to decline stage it should
introduce new variant of butter and cheese to again start the new Product life cycle with
new variant.
Strategic Marketing P a g e | 5
Marketing Strategies
As mentioned in the earlier section dairy producers have to adopt various strategies for the
optimum utilization of the product life cycle stages
Product Life cycle Stage Marketing Strategies
Introduction Rapid skimming-This strategy is launching the
product at high price to make maximum
profit and high level of promotion.
Slow skimming-This stage is characterized by
high price and low promotions.
Rapid penetration-In this strategy the product is
launched at a low price followed by
aggressive promotion.
Slow penetration-Launch the product at low
price and low promotions(Kotabe &
Helsen, 2014)
Growth The following strategies are helpful during the
growth stage:
Improvement in the quality of product
Addition of new variant in the existing
product and add customer support
service.
Entering into new market segments.
Skimming the price if the profits are still
low.
Increase in the distribution channel to
manage the increasing demand (Charter
& Tischner, 2017).
Maturity The following strategies are to be used here:
Market Modification-Redefining the
target market, moving to different
segment, tries to win the competitors
customers and so on.
Product Modification-adjusting the
product in terms of quality, pricing,
packaging, promotion in accordance
with the marketing mix(Lockrey, 2015)
Decline The strategies which the farm producers should
adopt here are:
Reduction in the promotional
expenditure.
Reduction in the number of distribution
centres.
Implementing price cuts.
Maintain the product and wait for
competitor to remove their product
from the market(Ottman, 2017)
Reduction in the price to sell out the
entire inventory.
⊘ This is a preview!⊘
Do you want full access?
Subscribe today to unlock all pages.
Trusted by 1+ million students worldwide
Strategic Marketing P a g e | 6
Hence, it is very important and critical to reassess the Product life cycle of the dairy products
and change the pricing strategy to better suit the needs of the customer to ensure
consistent sale in the dairy items. It has been observed in the case study, how different
consumers have been moving to different variety of products of cheese and milk. Health
conscious people are moving from high fat milk to low fat milk and so on. Thus, assessing the
business market and creating strategies in accordance with the Product life cycle will help
Australian farm industry to achieve momentum in the growth.
Question 2
Using the information provided in Exhibit 4 and 5 elaborate and interpret a portfolio matrix
for the dairy producer DP A. In responding to this question it is recommended only milk sales
for 2008-09 and 2009-10 periods are used.
Answer 2
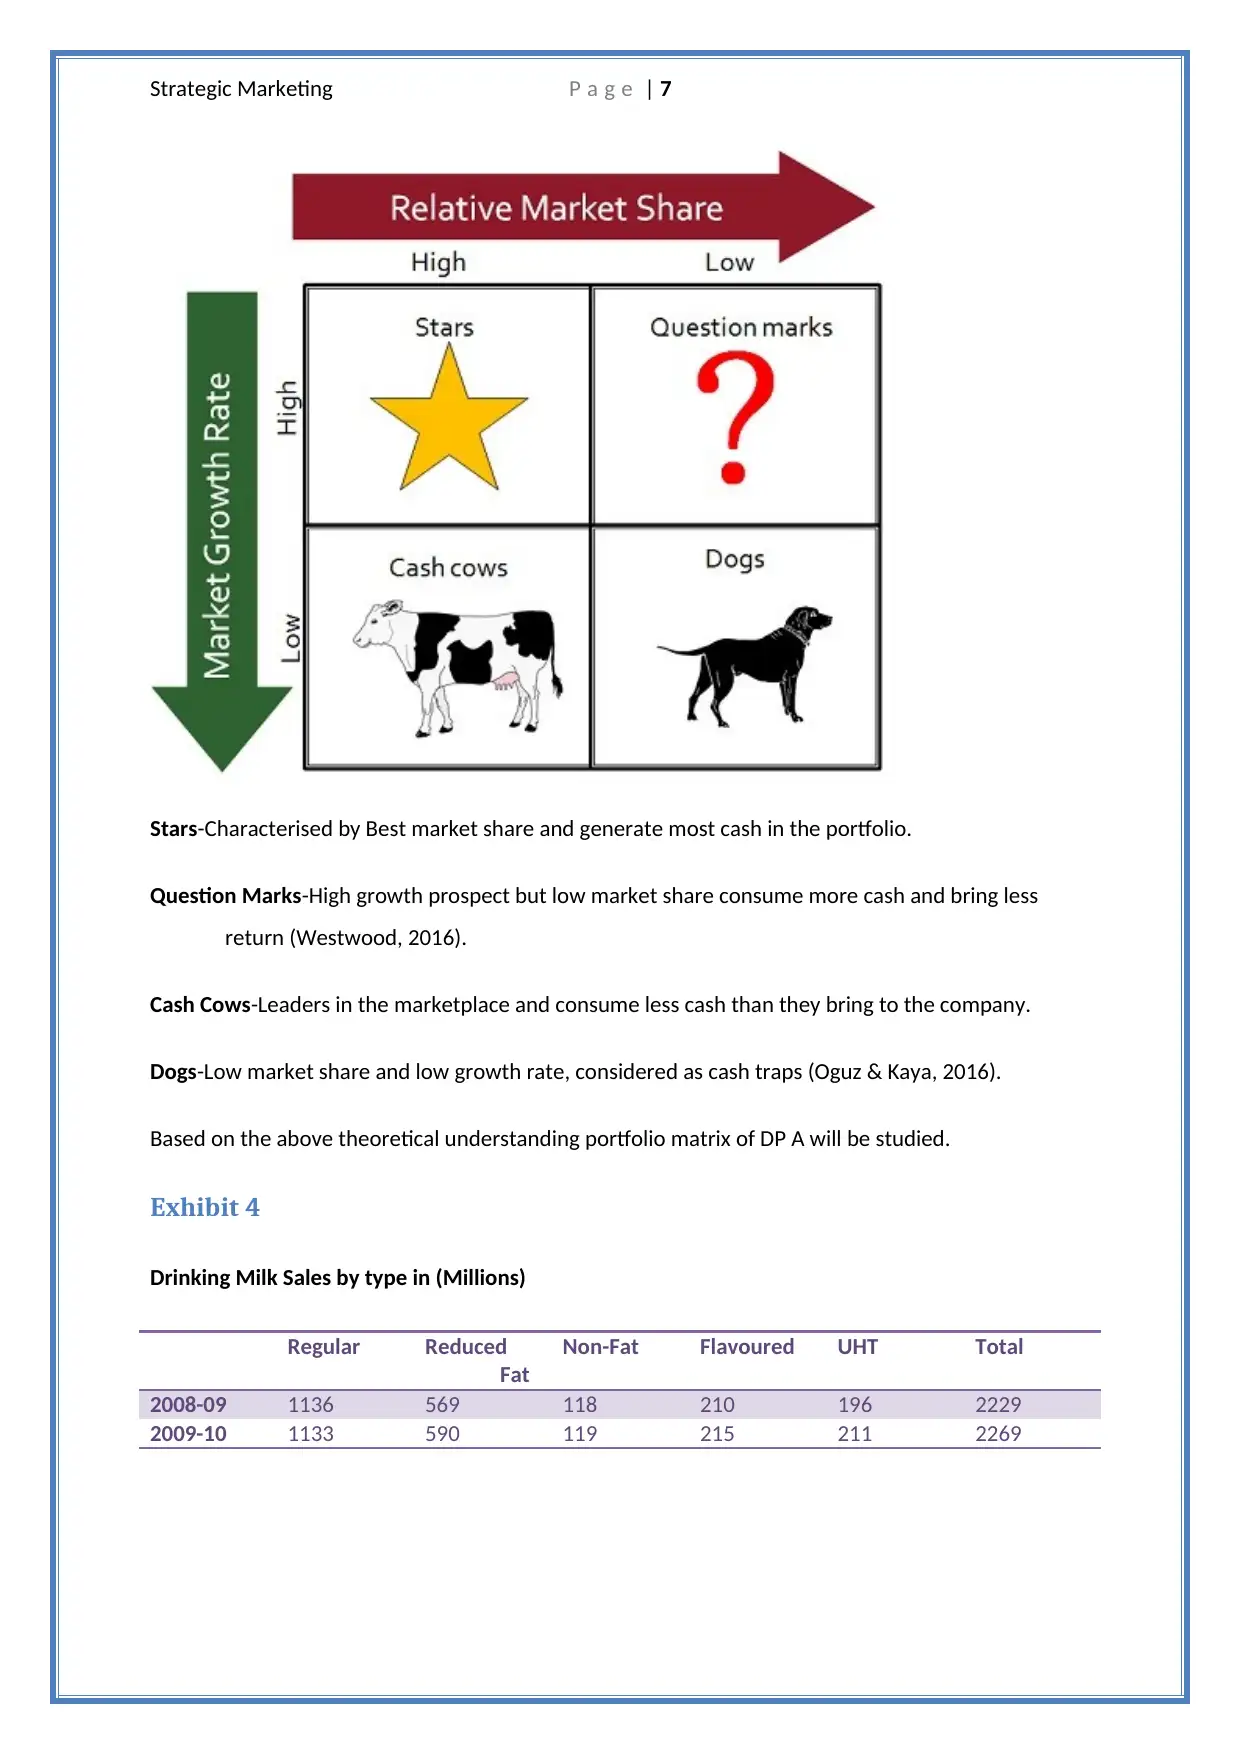
A portfolio matrix can be understood as a chart which is used to define products in terms of
both the growth in their industry and their specific market share. A BCG matrix is used to
define the portfolio matrix of any organization (Gito & Kumar, 2014). There are 4 quadrants
in Portfolio matrix which define the growth and the specific market share in the industry:
Hence, it is very important and critical to reassess the Product life cycle of the dairy products
and change the pricing strategy to better suit the needs of the customer to ensure
consistent sale in the dairy items. It has been observed in the case study, how different
consumers have been moving to different variety of products of cheese and milk. Health
conscious people are moving from high fat milk to low fat milk and so on. Thus, assessing the
business market and creating strategies in accordance with the Product life cycle will help
Australian farm industry to achieve momentum in the growth.
Question 2
Using the information provided in Exhibit 4 and 5 elaborate and interpret a portfolio matrix
for the dairy producer DP A. In responding to this question it is recommended only milk sales
for 2008-09 and 2009-10 periods are used.
Answer 2
A portfolio matrix can be understood as a chart which is used to define products in terms of
both the growth in their industry and their specific market share. A BCG matrix is used to
define the portfolio matrix of any organization (Gito & Kumar, 2014). There are 4 quadrants
in Portfolio matrix which define the growth and the specific market share in the industry:
Paraphrase This Document
Need a fresh take? Get an instant paraphrase of this document with our AI Paraphraser
Strategic Marketing P a g e | 7
Stars-Characterised by Best market share and generate most cash in the portfolio.
Question Marks-High growth prospect but low market share consume more cash and bring less
return (Westwood, 2016).
Cash Cows-Leaders in the marketplace and consume less cash than they bring to the company.
Dogs-Low market share and low growth rate, considered as cash traps (Oguz & Kaya, 2016).
Based on the above theoretical understanding portfolio matrix of DP A will be studied.
Exhibit 4
Drinking Milk Sales by type in (Millions)
Regular Reduced
Fat
Non-Fat Flavoured UHT Total
2008-09 1136 569 118 210 196 2229
2009-10 1133 590 119 215 211 2269
Strategic Marketing P a g e | 8
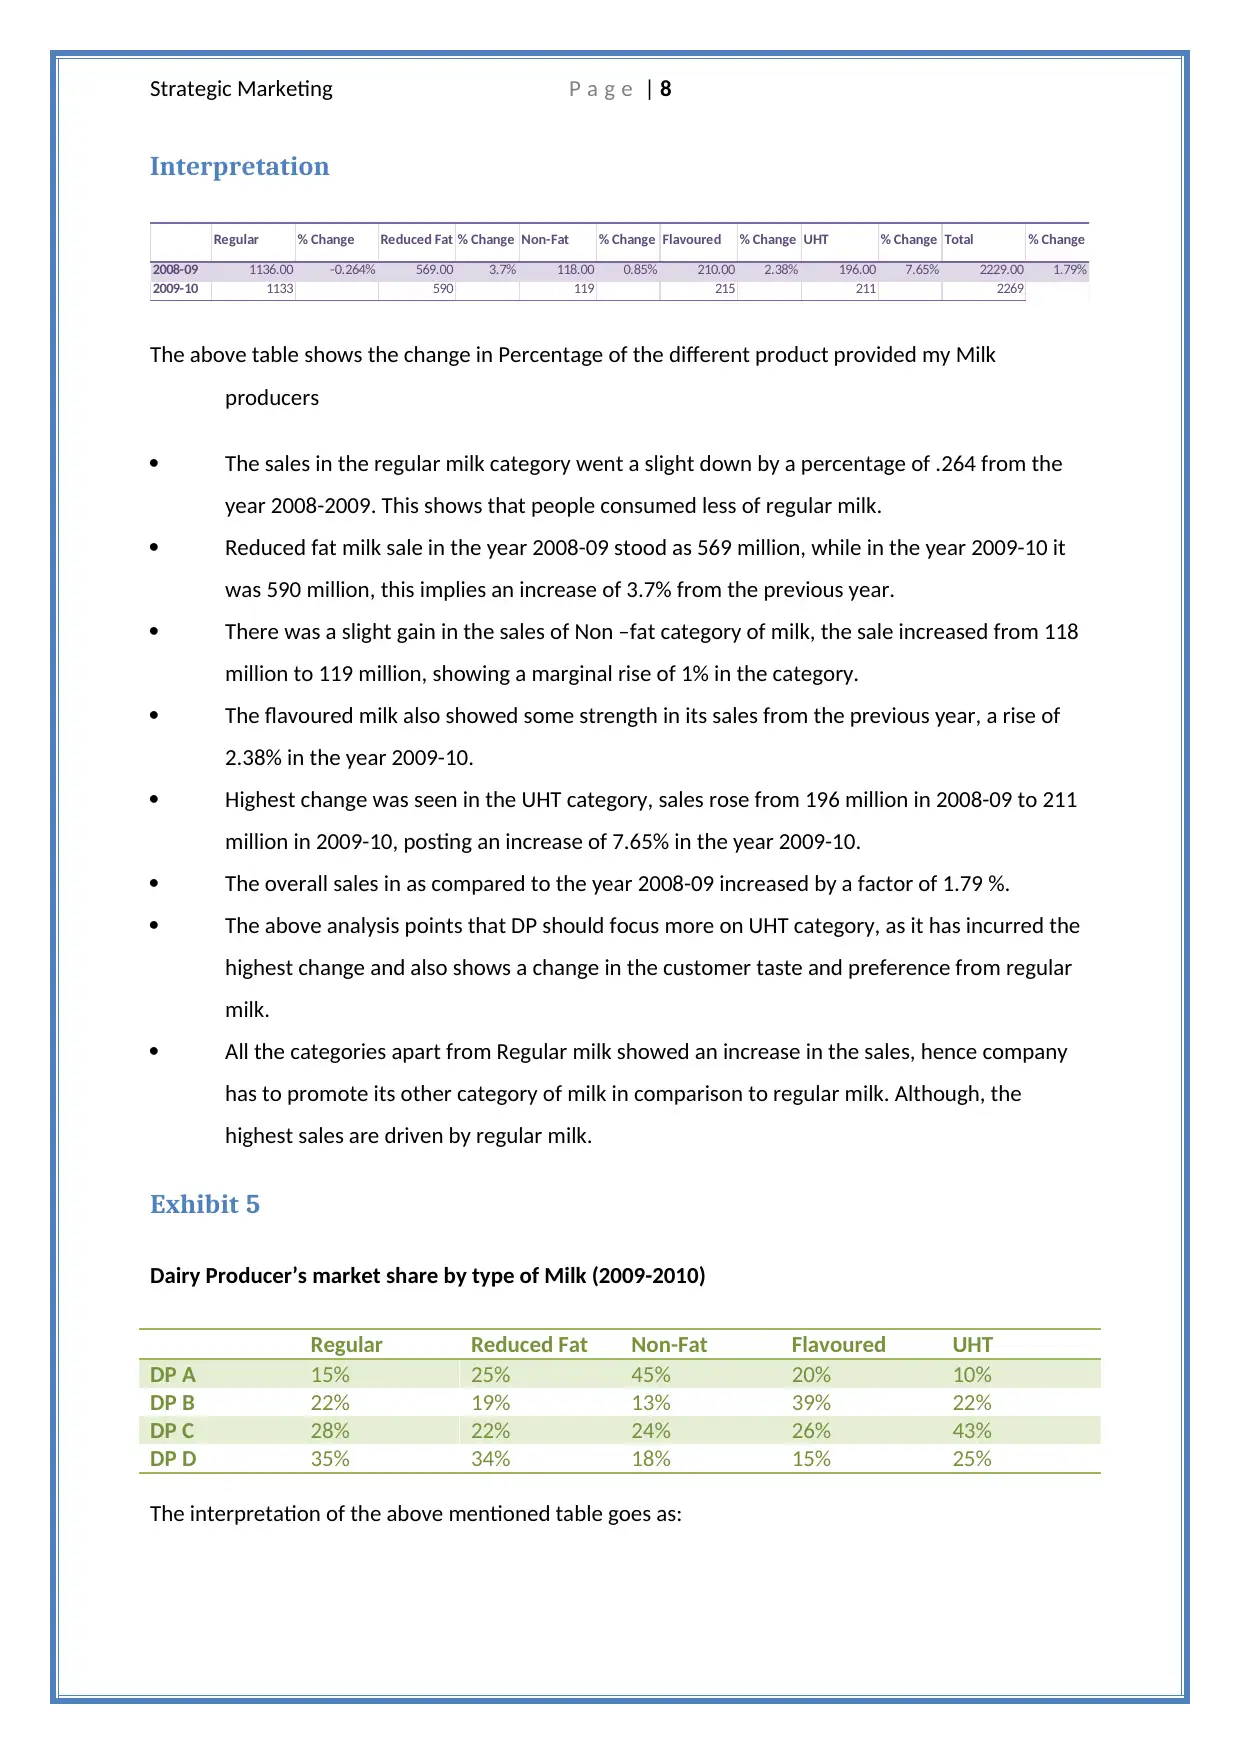
Interpretation
Regular % Change Reduced Fat % Change Non-Fat % Change Flavoured % Change UHT % Change Total % Change
2008-09 1136.00 -0.264% 569.00 3.7% 118.00 0.85% 210.00 2.38% 196.00 7.65% 2229.00 1.79%
2009-10 1133 590 119 215 211 2269
The above table shows the change in Percentage of the different product provided my Milk
producers
The sales in the regular milk category went a slight down by a percentage of .264 from the
year 2008-2009. This shows that people consumed less of regular milk.
Reduced fat milk sale in the year 2008-09 stood as 569 million, while in the year 2009-10 it
was 590 million, this implies an increase of 3.7% from the previous year.
There was a slight gain in the sales of Non –fat category of milk, the sale increased from 118
million to 119 million, showing a marginal rise of 1% in the category.
The flavoured milk also showed some strength in its sales from the previous year, a rise of
2.38% in the year 2009-10.
Highest change was seen in the UHT category, sales rose from 196 million in 2008-09 to 211
million in 2009-10, posting an increase of 7.65% in the year 2009-10.
The overall sales in as compared to the year 2008-09 increased by a factor of 1.79 %.
The above analysis points that DP should focus more on UHT category, as it has incurred the
highest change and also shows a change in the customer taste and preference from regular
milk.
All the categories apart from Regular milk showed an increase in the sales, hence company
has to promote its other category of milk in comparison to regular milk. Although, the
highest sales are driven by regular milk.
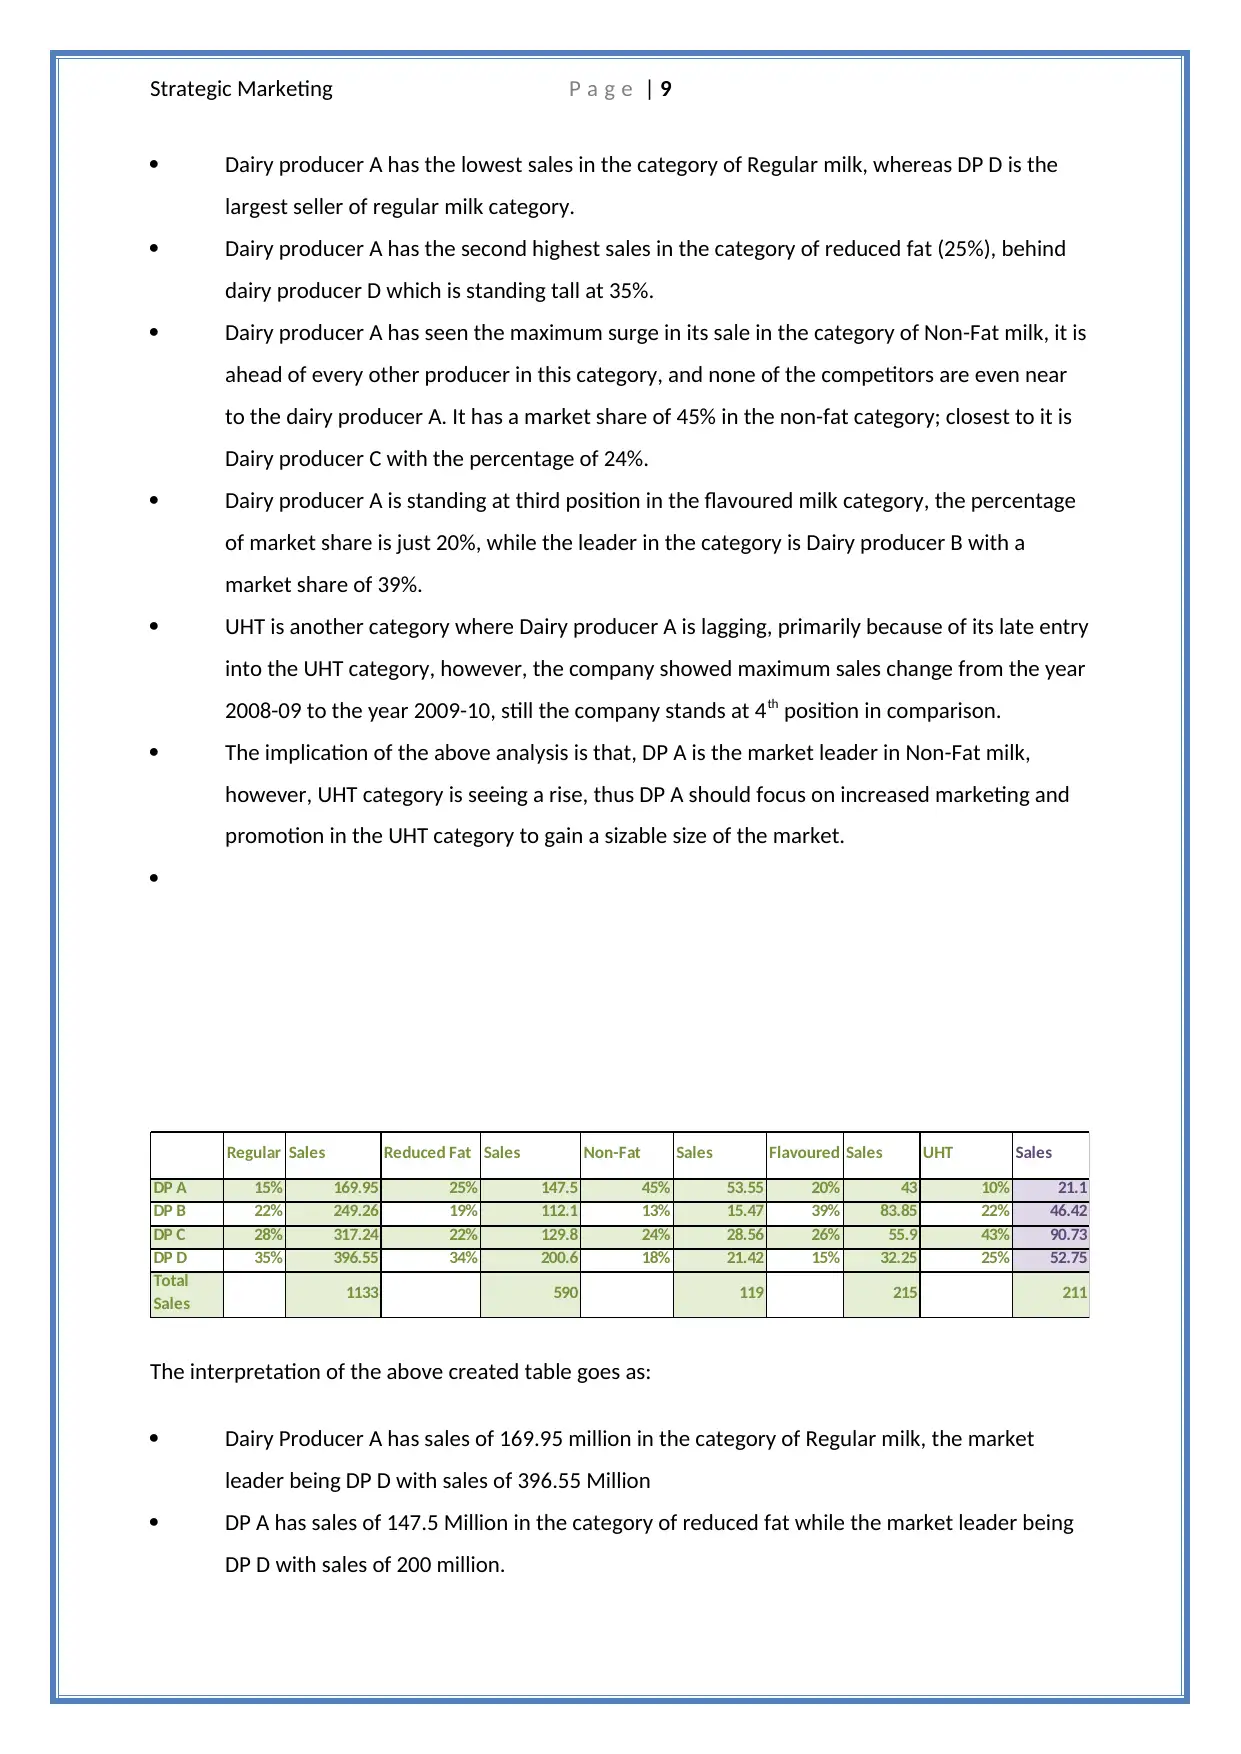
Exhibit 5
Dairy Producer’s market share by type of Milk (2009-2010)
Regular Reduced Fat Non-Fat Flavoured UHT
DP A 15% 25% 45% 20% 10%
DP B 22% 19% 13% 39% 22%
DP C 28% 22% 24% 26% 43%
DP D 35% 34% 18% 15% 25%
The interpretation of the above mentioned table goes as:
Interpretation
Regular % Change Reduced Fat % Change Non-Fat % Change Flavoured % Change UHT % Change Total % Change
2008-09 1136.00 -0.264% 569.00 3.7% 118.00 0.85% 210.00 2.38% 196.00 7.65% 2229.00 1.79%
2009-10 1133 590 119 215 211 2269
The above table shows the change in Percentage of the different product provided my Milk
producers
The sales in the regular milk category went a slight down by a percentage of .264 from the
year 2008-2009. This shows that people consumed less of regular milk.
Reduced fat milk sale in the year 2008-09 stood as 569 million, while in the year 2009-10 it
was 590 million, this implies an increase of 3.7% from the previous year.
There was a slight gain in the sales of Non –fat category of milk, the sale increased from 118
million to 119 million, showing a marginal rise of 1% in the category.
The flavoured milk also showed some strength in its sales from the previous year, a rise of
2.38% in the year 2009-10.
Highest change was seen in the UHT category, sales rose from 196 million in 2008-09 to 211
million in 2009-10, posting an increase of 7.65% in the year 2009-10.
The overall sales in as compared to the year 2008-09 increased by a factor of 1.79 %.
The above analysis points that DP should focus more on UHT category, as it has incurred the
highest change and also shows a change in the customer taste and preference from regular
milk.
All the categories apart from Regular milk showed an increase in the sales, hence company
has to promote its other category of milk in comparison to regular milk. Although, the
highest sales are driven by regular milk.
Exhibit 5
Dairy Producer’s market share by type of Milk (2009-2010)
Regular Reduced Fat Non-Fat Flavoured UHT
DP A 15% 25% 45% 20% 10%
DP B 22% 19% 13% 39% 22%
DP C 28% 22% 24% 26% 43%
DP D 35% 34% 18% 15% 25%
The interpretation of the above mentioned table goes as:
⊘ This is a preview!⊘
Do you want full access?
Subscribe today to unlock all pages.
Trusted by 1+ million students worldwide
Strategic Marketing P a g e | 9
Dairy producer A has the lowest sales in the category of Regular milk, whereas DP D is the
largest seller of regular milk category.
Dairy producer A has the second highest sales in the category of reduced fat (25%), behind
dairy producer D which is standing tall at 35%.
Dairy producer A has seen the maximum surge in its sale in the category of Non-Fat milk, it is
ahead of every other producer in this category, and none of the competitors are even near
to the dairy producer A. It has a market share of 45% in the non-fat category; closest to it is
Dairy producer C with the percentage of 24%.
Dairy producer A is standing at third position in the flavoured milk category, the percentage
of market share is just 20%, while the leader in the category is Dairy producer B with a
market share of 39%.
UHT is another category where Dairy producer A is lagging, primarily because of its late entry
into the UHT category, however, the company showed maximum sales change from the year
2008-09 to the year 2009-10, still the company stands at 4th position in comparison.
The implication of the above analysis is that, DP A is the market leader in Non-Fat milk,
however, UHT category is seeing a rise, thus DP A should focus on increased marketing and
promotion in the UHT category to gain a sizable size of the market.
Regular Sales Reduced Fat Sales Non-Fat Sales Flavoured Sales UHT Sales
DP A 15% 169.95 25% 147.5 45% 53.55 20% 43 10% 21.1
DP B 22% 249.26 19% 112.1 13% 15.47 39% 83.85 22% 46.42
DP C 28% 317.24 22% 129.8 24% 28.56 26% 55.9 43% 90.73
DP D 35% 396.55 34% 200.6 18% 21.42 15% 32.25 25% 52.75
Total
Sales 1133 590 119 215 211
The interpretation of the above created table goes as:
Dairy Producer A has sales of 169.95 million in the category of Regular milk, the market
leader being DP D with sales of 396.55 Million
DP A has sales of 147.5 Million in the category of reduced fat while the market leader being
DP D with sales of 200 million.
Paraphrase This Document
Need a fresh take? Get an instant paraphrase of this document with our AI Paraphraser
Strategic Marketing P a g e | 10
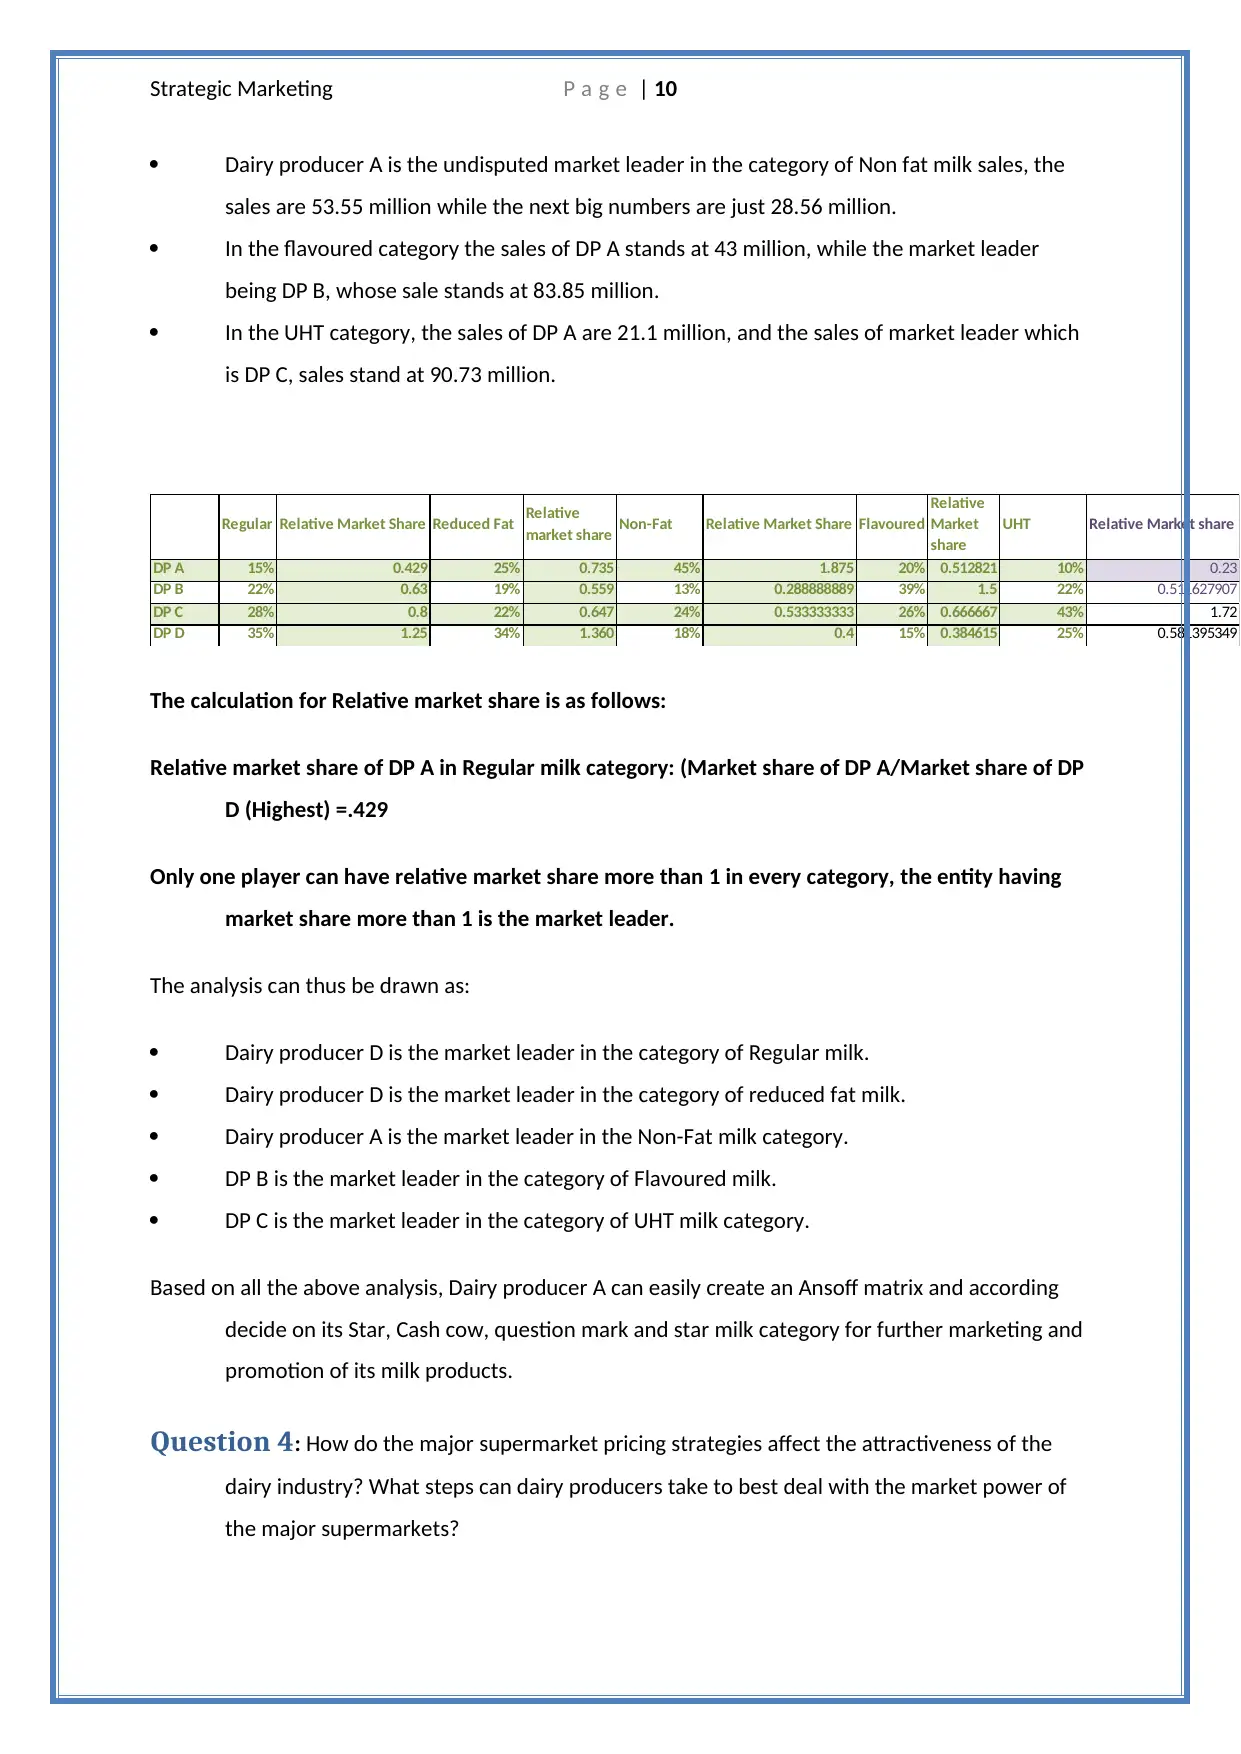
Dairy producer A is the undisputed market leader in the category of Non fat milk sales, the
sales are 53.55 million while the next big numbers are just 28.56 million.
In the flavoured category the sales of DP A stands at 43 million, while the market leader
being DP B, whose sale stands at 83.85 million.
In the UHT category, the sales of DP A are 21.1 million, and the sales of market leader which
is DP C, sales stand at 90.73 million.
Regular Relative Market Share Reduced Fat Relative
market share Non-Fat Relative Market Share Flavoured
Relative
Market
share
UHT Relative Market share
DP A 15% 0.429 25% 0.735 45% 1.875 20% 0.512821 10% 0.23
DP B 22% 0.63 19% 0.559 13% 0.288888889 39% 1.5 22% 0.511627907
DP C 28% 0.8 22% 0.647 24% 0.533333333 26% 0.666667 43% 1.72
DP D 35% 1.25 34% 1.360 18% 0.4 15% 0.384615 25% 0.581395349
The calculation for Relative market share is as follows:
Relative market share of DP A in Regular milk category: (Market share of DP A/Market share of DP
D (Highest) =.429
Only one player can have relative market share more than 1 in every category, the entity having
market share more than 1 is the market leader.
The analysis can thus be drawn as:
Dairy producer D is the market leader in the category of Regular milk.
Dairy producer D is the market leader in the category of reduced fat milk.
Dairy producer A is the market leader in the Non-Fat milk category.
DP B is the market leader in the category of Flavoured milk.
DP C is the market leader in the category of UHT milk category.
Based on all the above analysis, Dairy producer A can easily create an Ansoff matrix and according
decide on its Star, Cash cow, question mark and star milk category for further marketing and
promotion of its milk products.
Question 4: How do the major supermarket pricing strategies affect the attractiveness of the
dairy industry? What steps can dairy producers take to best deal with the market power of
the major supermarkets?
Strategic Marketing P a g e | 11
Answer
According to the case study, the relationship between the dairy farmers and the
supermarkets is complex in nature. A fear or uncertainty on the future of Australian dairy
farm industry is clearly visible from the case study. Plethora of dairy farmers is leaving the
farms due to deregulation in the industry. At the same time, the prices offered to the dairy
farmers are way less in comparison to what it is being sold at in the supermarkets. Also, the
gaining popularity of the private labels is hampering the dairy farmer’s big time; the
supermarkets are reducing the prices of the milk to increase the bulk sale which is
hampering the farmers (Richards, Kjaernes & Vik, 2016).
Another contentious issue is the rate supermarkets are offering to the dairy farmers,
supermarkets in order to win the raging war have reduced the price of milk significantly. A
number of supermarkets followed suit against Coles, in a bid to increase the price of the
milk. However, nothing has happened since then. According to Coles, it exports most of the
milk which is being sold in its store, and this is affecting Australian dollar as well. More so,
the supermarkets are offering great discounts to stay atop of the business, for example,
Coles is offering 1 litre of milk at $2 and 3 litres of milk at $3, it makes the consumer
perceive the rate of the milk is only $1. Over the last four years the price of the milk has not
changed even a bit (Atkins & Bowler, 2016). This is seriously squeezing the margins of the
dairy farmers, who are uncertain about their future and looking for other alternatives.
Recently, Woolworth’s has been appointed. On the consumer front, there are a lot of mixed
reviews, most of them are in favour of price wars, as they are benefitting from it immensely,
but ultimately it is the farmers who are losing out on the revenue and thus the profit
margins. It has been said over and over again that Supermarkets by increasing the price of
the milk will not be able to do with the plight of the farmers; in actual it is the big gap in the
supply and demand which is hampering the farmers (Issac & Dixon, 2016). However, there
are number of steps the farmers can take to prevent their best interest against the giant
power of supermarkets
Getting regulation in the Dairy market
The situation presently in Australia is far than worsened, it is high time that government
intervenes and save the dairy farmers from getting into the well of misery. In Australia, the
government allows the market forces to determine the price of a commodity; this has to be
changed at least for the dairy farmers. A regulation in the Milk industry will ensure that the
⊘ This is a preview!⊘
Do you want full access?
Subscribe today to unlock all pages.
Trusted by 1+ million students worldwide
1 out of 16
Related Documents


Your All-in-One AI-Powered Toolkit for Academic Success.
+13062052269
info@desklib.com
Available 24*7 on WhatsApp / Email
![[object Object]](/_next/static/media/star-bottom.7253800d.svg)
Unlock your academic potential
Copyright © 2020–2026 A2Z Services. All Rights Reserved. Developed and managed by ZUCOL.