Biology 22: Analyzing Stress Response in Personality Types A and B
VerifiedAdded on 2020/05/04
|24
|3706
|240
Report
AI Summary
This biology report details an experiment investigating the biological stress response in individuals with Type A and Type B personalities. The study aimed to compare pulse rates under mild stress conditions, hypothesizing differences in cardiovascular responses. Methods involved administering a mild stress task and recording pulse rates before, during, and after the task. The results, presented in tabular and graphical formats, included statistical analyses such as ANOVA and t-tests. Data analysis revealed no significant association between personality type and pulse rate changes, leading to the acceptance of the null hypothesis. The report includes an abstract, introduction, aim, hypothesis, methods, results, discussion, conclusion, references, and an appendix with raw data and calculations.

Running head: BIOLOGY
Biology
Rudo Muzangwa
Name of the University
Author note
Biology
Rudo Muzangwa
Name of the University
Author note
Paraphrase This Document
Need a fresh take? Get an instant paraphrase of this document with our AI Paraphraser
1BIOLOGY
Table of Contents
Abstract............................................................................................................................................2
Introduction......................................................................................................................................2
Aim..................................................................................................................................................3
Hypothesis.......................................................................................................................................3
Methods...........................................................................................................................................4
Results..............................................................................................................................................5
Result treatment...............................................................................................................................6
Discussion........................................................................................................................................7
Conclusion.......................................................................................................................................7
References........................................................................................................................................8
Appendix..........................................................................................................................................9
2BIOLOGY
Abstract
According to Meyer Friedman and Ray Rosenman, in people with coronary heart disease,
a certain pattern is seen like impatient, aggressiveness, competitiveness and urgency of time
(Chinaveh, 2014). The aim of the experiment was to investigate the influence of biological stress
response between two different personalities Type A and Type B (McLeod, 2012). On exposure
to stress, type A personality people were diagnosed with high pulse rate due to high release of
stress hormone resulting in high anxiety, blood pressure and temperature levels. On the other
hand, type B personality people had shown low amount of stress hormone levels and found to be
more relaxed and normal pulse rate. However, there is vulnerability to human error that leaves
for further scrutiny.
Introduction
Stress is a feeling of pressure and strain that people experience when they perceive things
to be threatening when they are unable to cope up with the obstacles for what the circumstances
demand (Bibbey et al., 2013). It is driven by stressors and acute where the body shows react to
short-term stressors and long-term stressors such as family abuse (McLeod, 2010). The
hypothalamus releases a stress response that prepare the body for immediate response to stress,
“Fight”, “Fright” or Flight“ that result in increased heart pulse or rate, blood pressure and
sweating (Cuesta & Singer, 2012).
In psychology, personality is a blend of person’s characteristics that make one unique and
there is effect of personality of an individual on stress response. “Personality and Stress” is the
identification of state of response on how a person reacts and how stress affects those (Minkel et
al., 2012). There is a need to understand the relationship between stress and personality that is
⊘ This is a preview!⊘
Do you want full access?
Subscribe today to unlock all pages.
Trusted by 1+ million students worldwide
3BIOLOGY
affected by many aspects like choice of environments, way of interpretations, intensity of
response to a stressor and coping strategies by individuals during the stressful situation. A study
conducted by Meyer Friedman and Ray Rosenman stated that coronary heart disease is directly
related to type A personality individuals and shows different behaviour pattern like attitude, life
style and personality they possess (Jenkins, Rosenman & Friedman, 1967). According to them,
people with coronary heart disease shows restless and alert behaviour that increases the blood
pressure and risk for heart disease (Reggio, 2012). These determining factors are important for
studying the effect of personality on the stress response. There is a high level of arousal that
make people react to the stressful situation and make them adapt to the stressful situations
(Centre for studies on human stress, 2010-2016).
Aim
The aim of the experiment is to investigate the comparison between Type A and B
personality individuals on a mild stress for the evaluation of pulse rate. In this proposed aim, an
experimental design is used where the pulse rate is recorded before, during and after the task of
mild stress application and comparison made between the personalities A and B for studying the
cardiovascular disease chances in the future.
Hypothesis
The hypothesis for the experiment is that there was difference between the pulse or heart
rates between the personalities A and B when they are subjected to mild stressful task. The null
hypothesis for the study is that there will be no significant variation between pulse or heart rates
between personality type A and B and it is non-directional as the gender acts as a causing
Paraphrase This Document
Need a fresh take? Get an instant paraphrase of this document with our AI Paraphraser
4BIOLOGY
difference between the heart or pulse rates and this can significantly affect people belonging to
different personalities, personality A and B.
Methods
The study was conducted to get the desired results for the experiment where 100 people
(both men and women) were be experimented. Mild stress like remembering series of numbers in
a reversed order were be given to the participants from 4 to 10 numbers in the given list. Pulse
rate was recorded before, during and after the task to monitor the pulse or heart rate. This
recorded data was then compared for both personality type. Finally, the available data was used
to match and determine the personality type who will be prone to cardiovascular diseases in the
future.
The research design for the study was independent group design where only heart or
pulse rate is the dependent variable that was studied between the two personality types. The two
groups that carry both men and women were assigned with the same task in order to minimize
the interference of any other independent variable of personality types A and B (McLeod, 2007).
Opportunity sampling was used to get the participants comprising of both males and
females where there were 20 participants, five males and females each for personality type A and
B. Age range was 18-50 years where males and females were both between 20-55 years
(McLeod, 2007). For the experiment, participants were asked to complete a reputable online
personality questionnaire that clarify Type A or Type B. Freidman and Rosenman Personality
Questionnaire was used for the determination of personalities of the participants. The number of
mild stressor task was used as a minor stressor and stopwatch was used for the quantification of
5BIOLOGY
heart or pulse rate. A recorded sheet was used for the tabulation of the records with columns and
rows for the participants to record the pulse or heart rate information along with gender and age.
The potential participants were tackled in person as they were close family, colleagues
and friends and they were notified about the experiment process as per the availability. The
designed questionnaire was given to family members and friends that would record the pulse or
heart rates in their homes or living rooms while the colleagues were given in their respective
companies’ office room for avoiding noise or distractions. There was briefing of the experiment
to the participants via a typed document before the investigation was done where the experiment
investigation was given. It comprised of consent or refusal before the commencement of the
questionnaire and another document was given to the participants where the heart or pulse rate
experiment was explained (The British Psychological Society, 2000-2016). Standardized
instructions were used like reading the instructions carefully, answering honestly, pulse or heart
rate instructions, and removal of any tight jewellery and completion of dot-to-dot puzzle. After
this, debriefing was also done where the participants were explained about the aim of the
experiment, allowed them to see their results and ensured confidentiality. Data collection was
done by taking heart rate commencing dot-to-dot puzzle and the results were recorded
accordingly in the tabulated sheet.
Results
The descriptive data would be analysed as mean, mode, median, range, standard
deviation and total N. Raw data was recorded in tabular form and bar charts were used for the
result outcomes. The data was collected as pulse or heart rate intervals repeated three times over
period of 20 seconds each.
⊘ This is a preview!⊘
Do you want full access?
Subscribe today to unlock all pages.
Trusted by 1+ million students worldwide
6BIOLOGY
Raw data (Appendix)
Data calculations and standard deviation (Appendix )
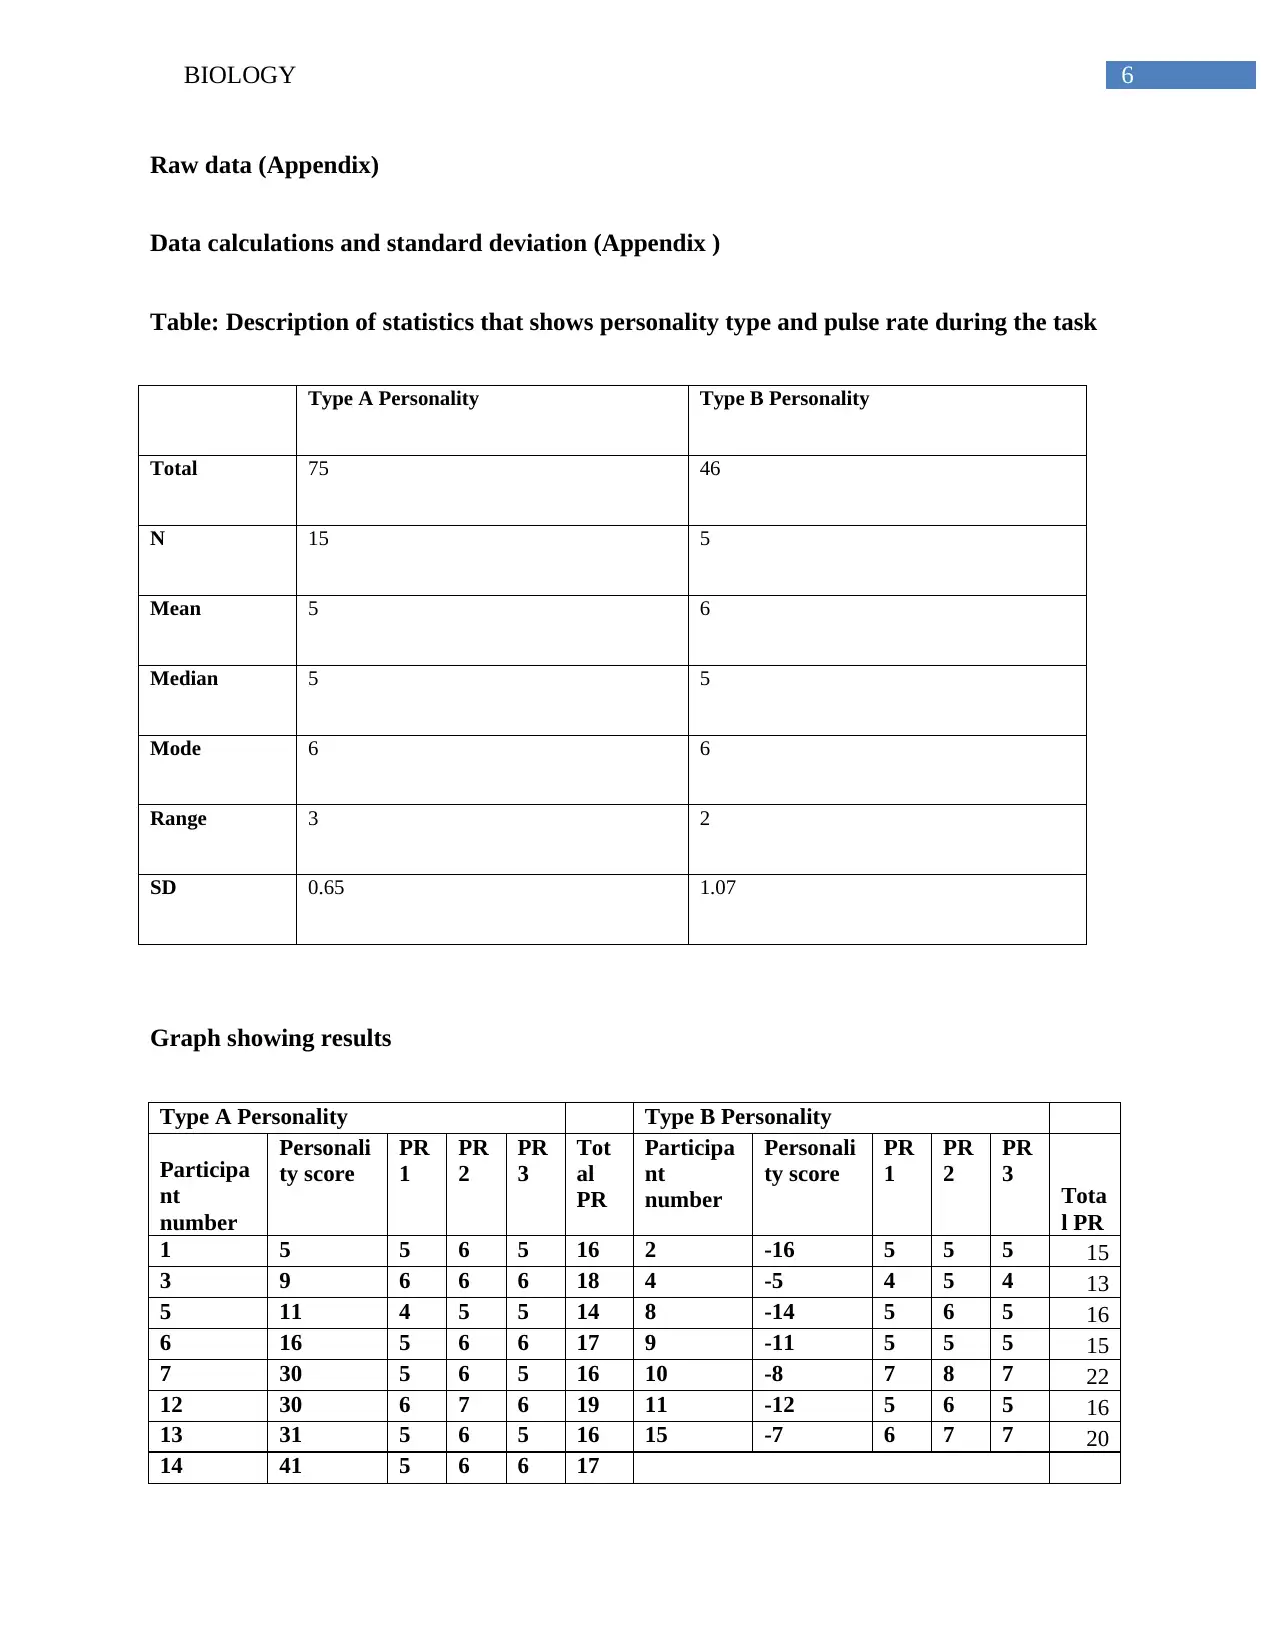
Table: Description of statistics that shows personality type and pulse rate during the task
Type A Personality Type B Personality
Total 75 46
N 15 5
Mean 5 6
Median 5 5
Mode 6 6
Range 3 2
SD 0.65 1.07
Graph showing results
Type A Personality Type B Personality
Participa
nt
number
Personali
ty score
PR
1
PR
2
PR
3
Tot
al
PR
Participa
nt
number
Personali
ty score
PR
1
PR
2
PR
3 Tota
l PR
1 5 5 6 5 16 2 -16 5 5 5 15
3 9 6 6 6 18 4 -5 4 5 4 13
5 11 4 5 5 14 8 -14 5 6 5 16
6 16 5 6 6 17 9 -11 5 5 5 15
7 30 5 6 5 16 10 -8 7 8 7 22
12 30 6 7 6 19 11 -12 5 6 5 16
13 31 5 6 5 16 15 -7 6 7 7 20
14 41 5 6 6 17
Raw data (Appendix)
Data calculations and standard deviation (Appendix )
Table: Description of statistics that shows personality type and pulse rate during the task
Type A Personality Type B Personality
Total 75 46
N 15 5
Mean 5 6
Median 5 5
Mode 6 6
Range 3 2
SD 0.65 1.07
Graph showing results
Type A Personality Type B Personality
Participa
nt
number
Personali
ty score
PR
1
PR
2
PR
3
Tot
al
PR
Participa
nt
number
Personali
ty score
PR
1
PR
2
PR
3 Tota
l PR
1 5 5 6 5 16 2 -16 5 5 5 15
3 9 6 6 6 18 4 -5 4 5 4 13
5 11 4 5 5 14 8 -14 5 6 5 16
6 16 5 6 6 17 9 -11 5 5 5 15
7 30 5 6 5 16 10 -8 7 8 7 22
12 30 6 7 6 19 11 -12 5 6 5 16
13 31 5 6 5 16 15 -7 6 7 7 20
14 41 5 6 6 17
Paraphrase This Document
Need a fresh take? Get an instant paraphrase of this document with our AI Paraphraser
7BIOLOGY
16 19 6 7 6 19
17 21 5 6 5 16
18 30 6 7 6 19
19 35 4 5 5 14
20 31 5 6 5 16
Perso
nality
score
5 9 11 16 30 30 31 41 19 21 30 35 31
0
2
4
6
8
10
12
14
16
18
20
Chart Title
Series1
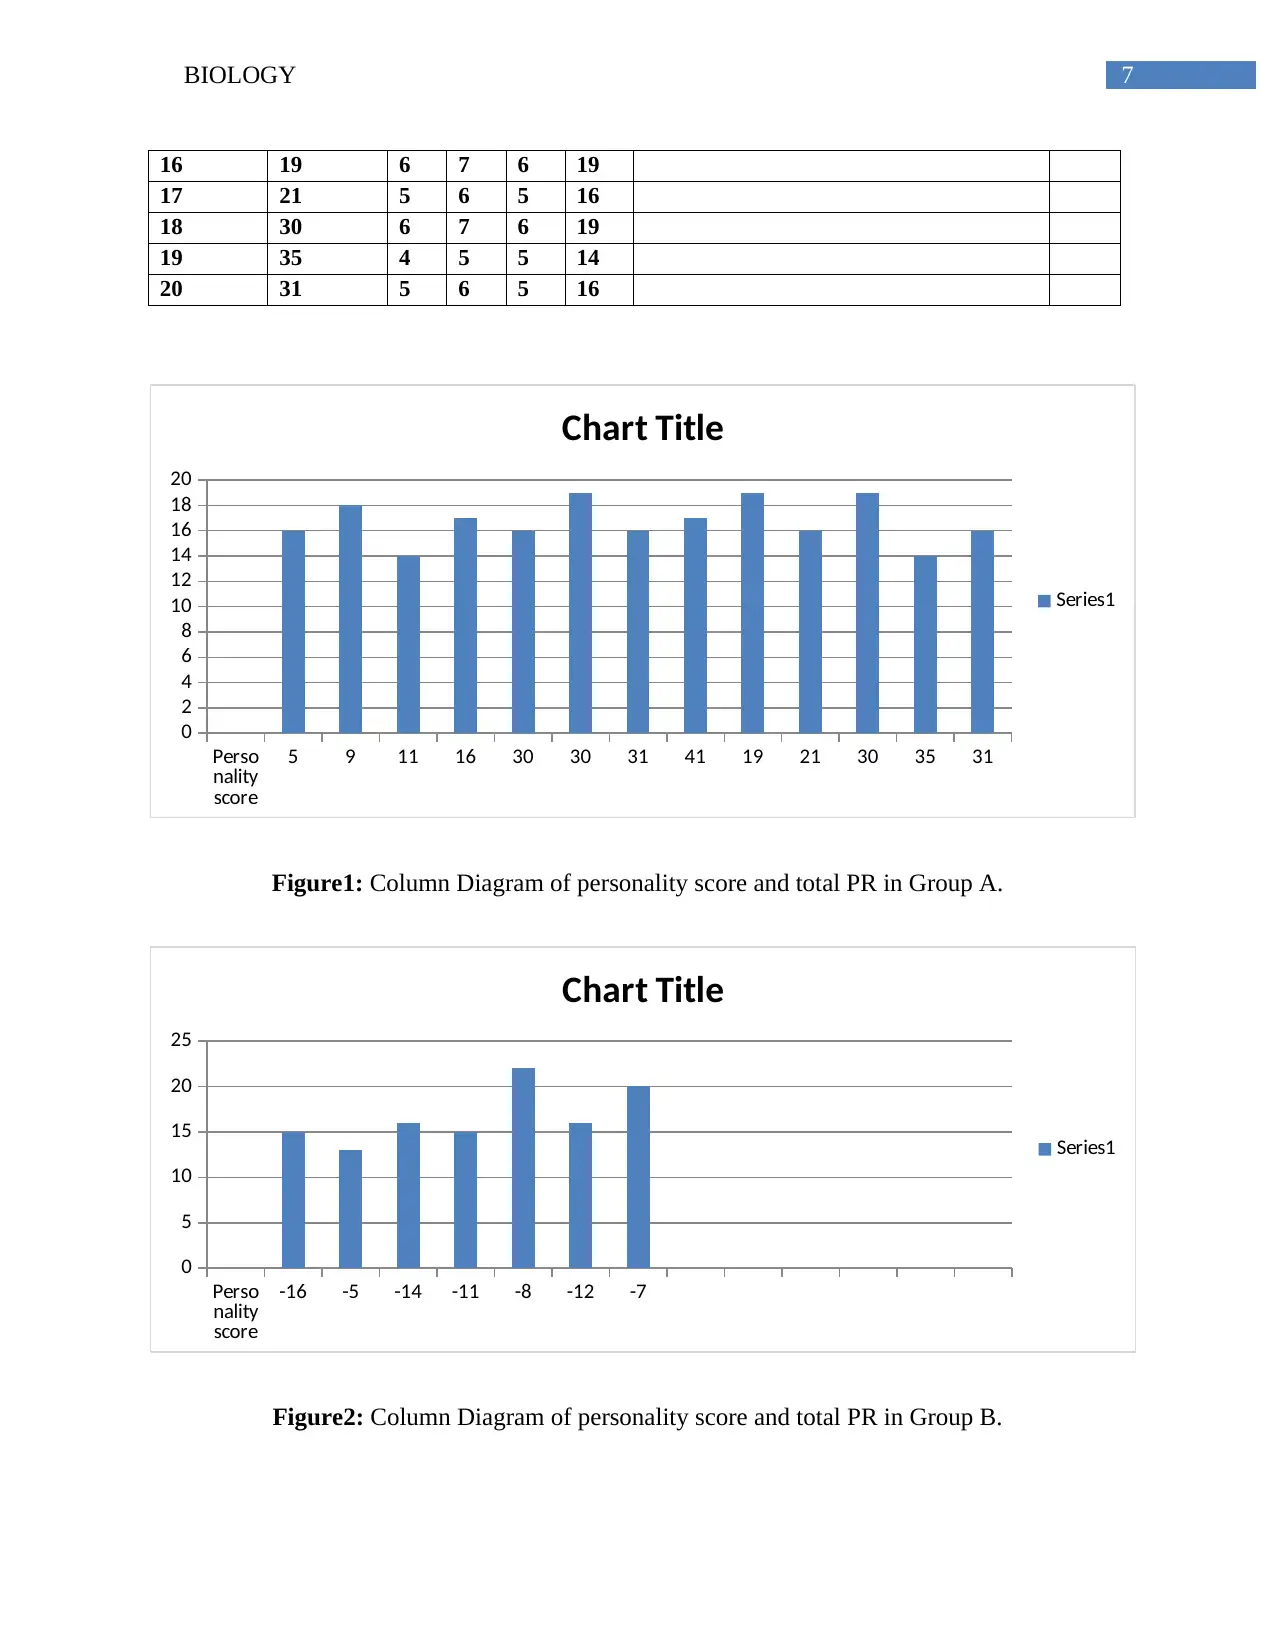
Figure1: Column Diagram of personality score and total PR in Group A.
Perso
nality
score
-16 -5 -14 -11 -8 -12 -7
0
5
10
15
20
25
Chart Title
Series1
Figure2: Column Diagram of personality score and total PR in Group B.
16 19 6 7 6 19
17 21 5 6 5 16
18 30 6 7 6 19
19 35 4 5 5 14
20 31 5 6 5 16
Perso
nality
score
5 9 11 16 30 30 31 41 19 21 30 35 31
0
2
4
6
8
10
12
14
16
18
20
Chart Title
Series1
Figure1: Column Diagram of personality score and total PR in Group A.
Perso
nality
score
-16 -5 -14 -11 -8 -12 -7
0
5
10
15
20
25
Chart Title
Series1
Figure2: Column Diagram of personality score and total PR in Group B.
8BIOLOGY
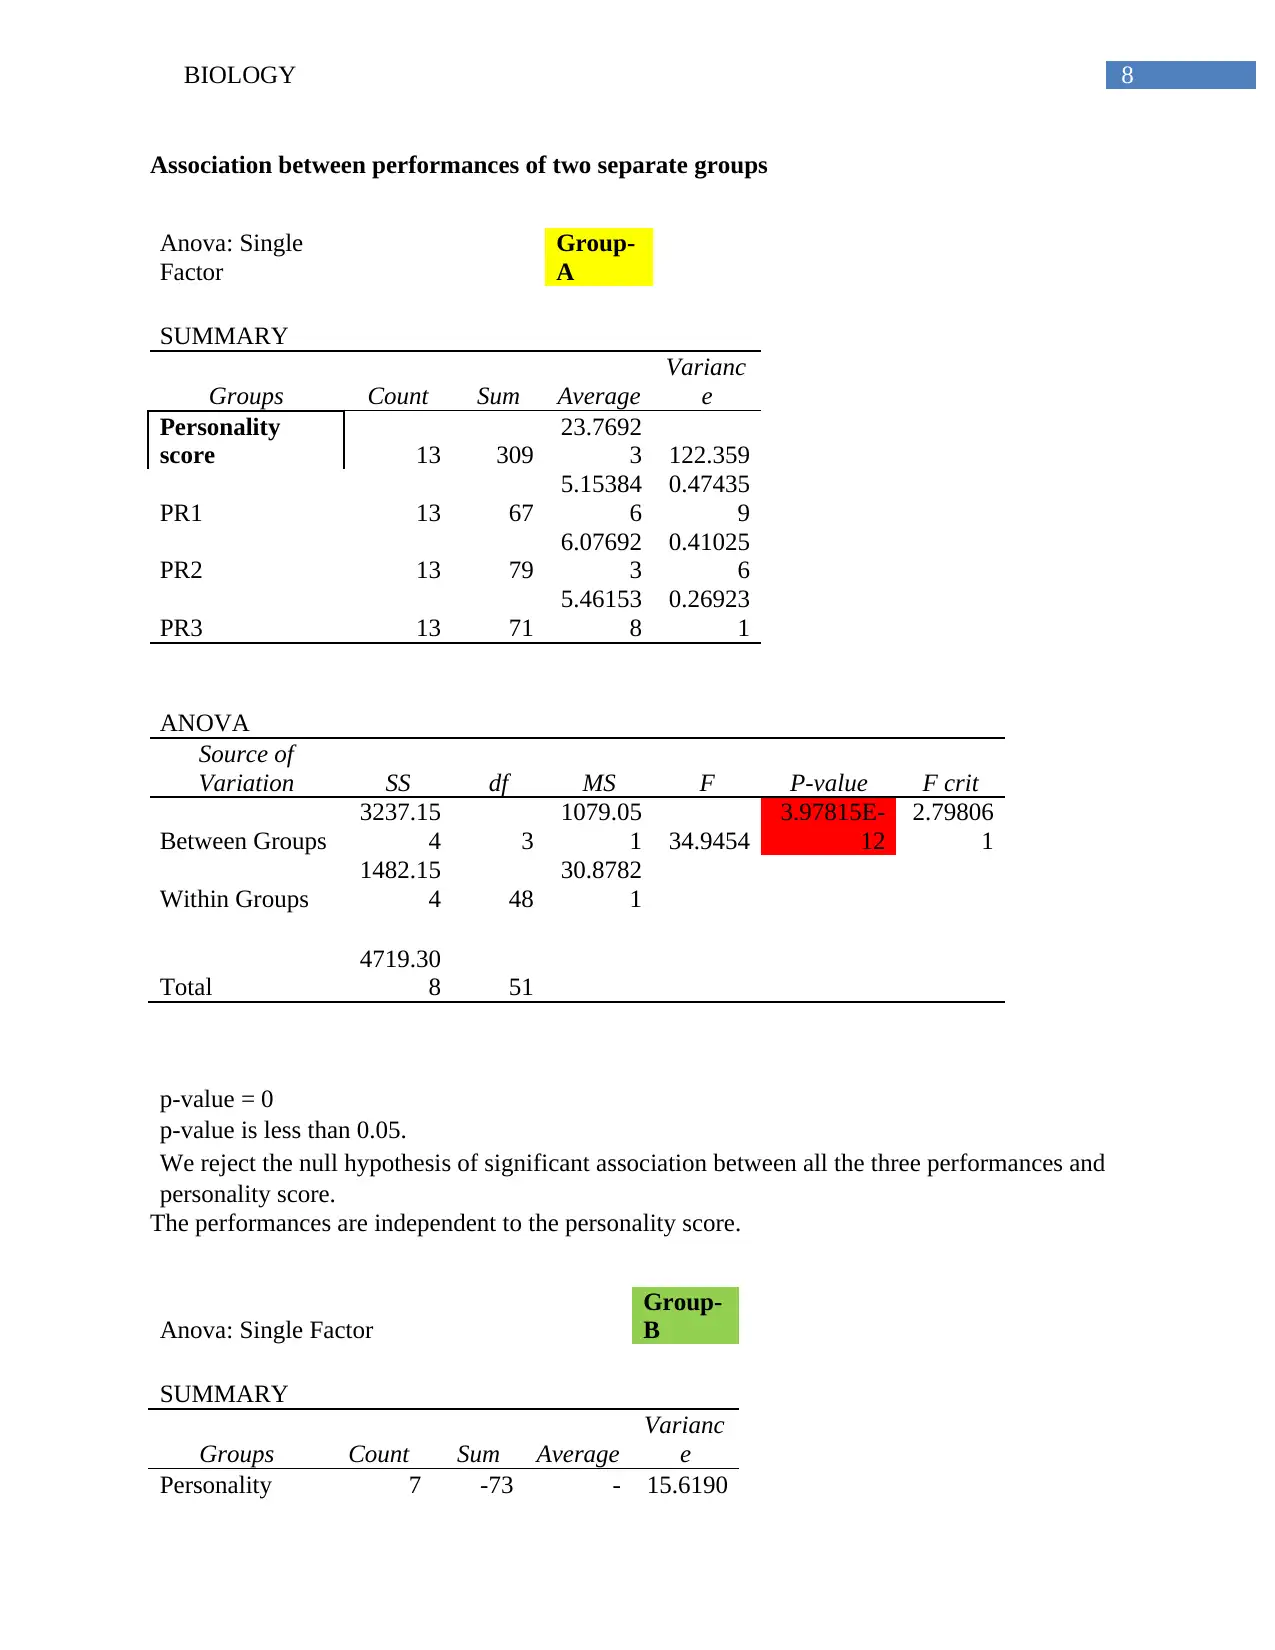
Association between performances of two separate groups
Anova: Single
Factor
Group-
A
SUMMARY
Groups Count Sum Average
Varianc
e
Personality
score 13 309
23.7692
3 122.359
PR1 13 67
5.15384
6
0.47435
9
PR2 13 79
6.07692
3
0.41025
6
PR3 13 71
5.46153
8
0.26923
1
ANOVA
Source of
Variation SS df MS F P-value F crit
Between Groups
3237.15
4 3
1079.05
1 34.9454
3.97815E-
12
2.79806
1
Within Groups
1482.15
4 48
30.8782
1
Total
4719.30
8 51
p-value = 0
p-value is less than 0.05.
We reject the null hypothesis of significant association between all the three performances and
personality score.
The performances are independent to the personality score.
Anova: Single Factor
Group-
B
SUMMARY
Groups Count Sum Average
Varianc
e
Personality 7 -73 - 15.6190
⊘ This is a preview!⊘
Do you want full access?
Subscribe today to unlock all pages.
Trusted by 1+ million students worldwide
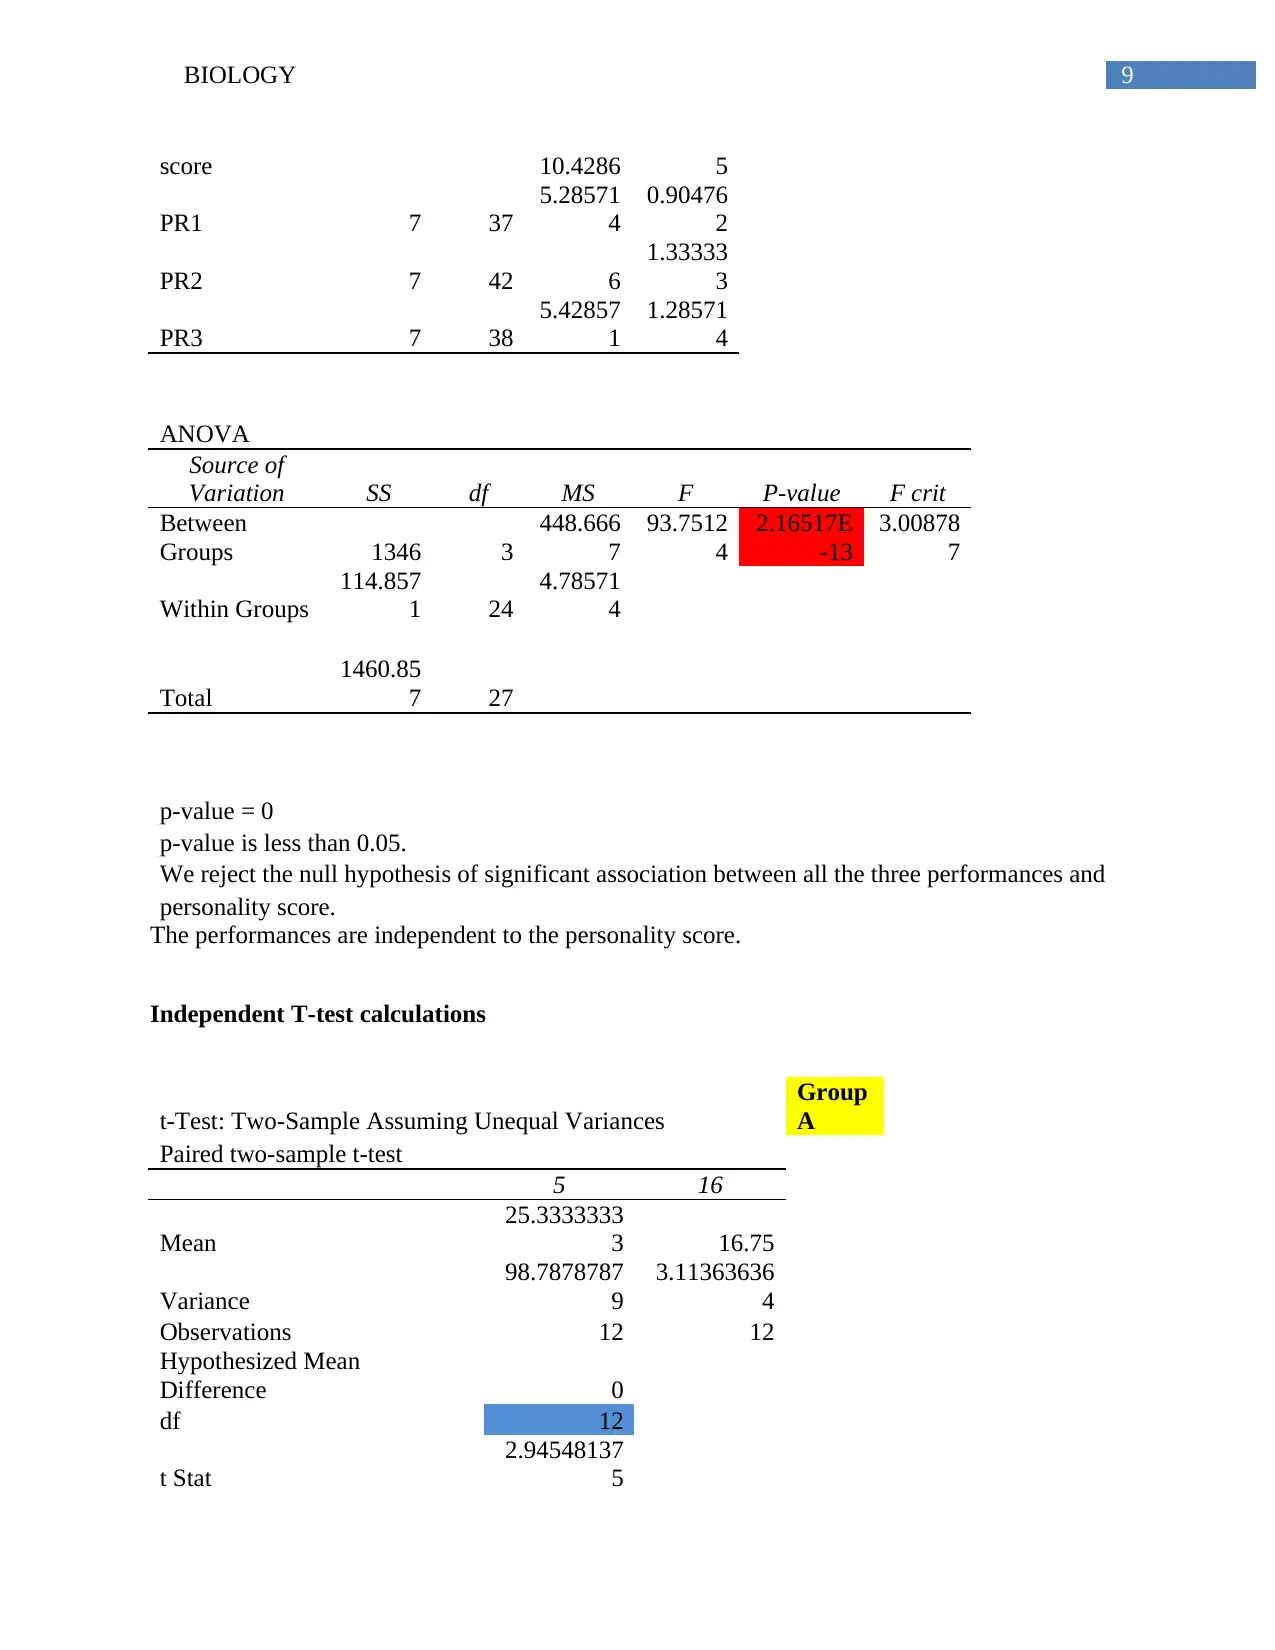
9BIOLOGY
score 10.4286 5
PR1 7 37
5.28571
4
0.90476
2
PR2 7 42 6
1.33333
3
PR3 7 38
5.42857
1
1.28571
4
ANOVA
Source of
Variation SS df MS F P-value F crit
Between
Groups 1346 3
448.666
7
93.7512
4
2.16517E
-13
3.00878
7
Within Groups
114.857
1 24
4.78571
4
Total
1460.85
7 27
p-value = 0
p-value is less than 0.05.
We reject the null hypothesis of significant association between all the three performances and
personality score.
The performances are independent to the personality score.
Independent T-test calculations
t-Test: Two-Sample Assuming Unequal Variances
Group
A
Paired two-sample t-test
5 16
Mean
25.3333333
3 16.75
Variance
98.7878787
9
3.11363636
4
Observations 12 12
Hypothesized Mean
Difference 0
df 12
t Stat
2.94548137
5
Paraphrase This Document
Need a fresh take? Get an instant paraphrase of this document with our AI Paraphraser
10BIOLOGY
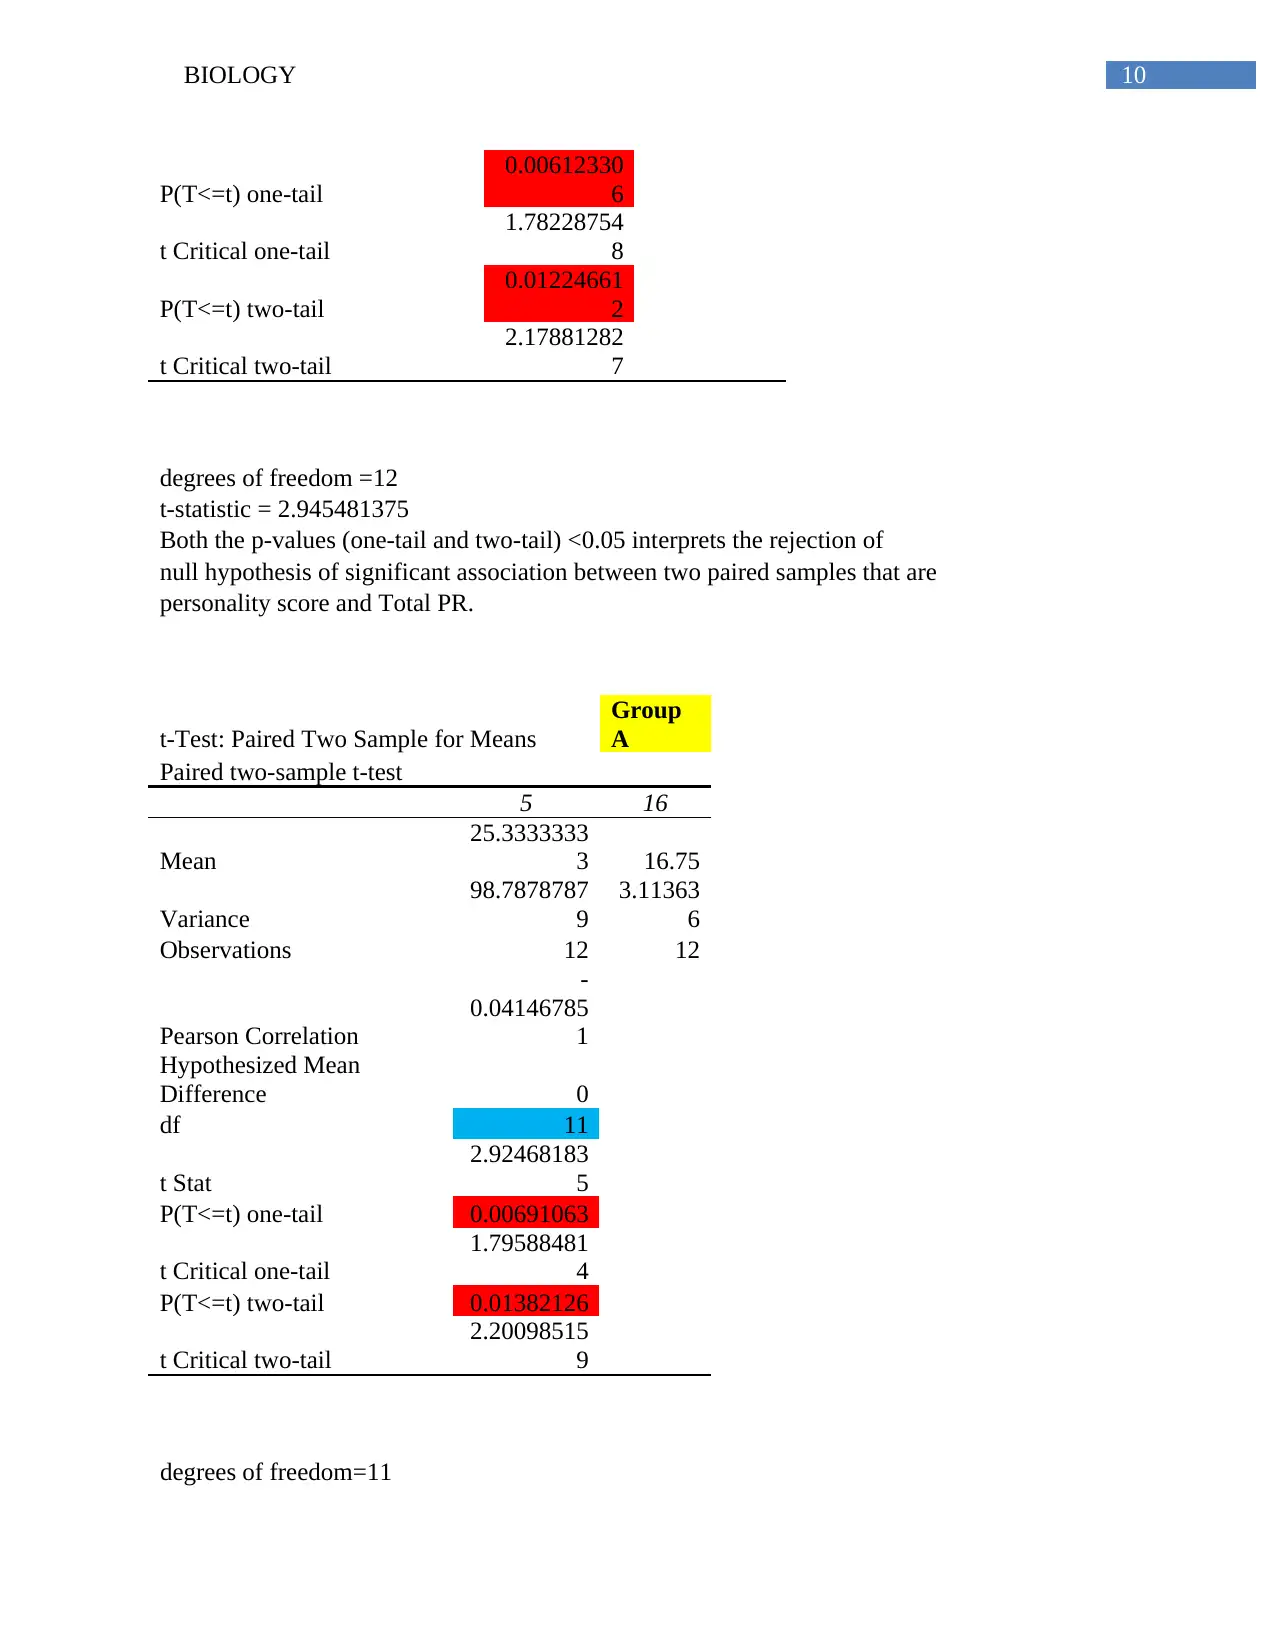
P(T<=t) one-tail
0.00612330
6
t Critical one-tail
1.78228754
8
P(T<=t) two-tail
0.01224661
2
t Critical two-tail
2.17881282
7
degrees of freedom =12
t-statistic = 2.945481375
Both the p-values (one-tail and two-tail) <0.05 interprets the rejection of
null hypothesis of significant association between two paired samples that are
personality score and Total PR.
t-Test: Paired Two Sample for Means
Group
A
Paired two-sample t-test
5 16
Mean
25.3333333
3 16.75
Variance
98.7878787
9
3.11363
6
Observations 12 12
Pearson Correlation
-
0.04146785
1
Hypothesized Mean
Difference 0
df 11
t Stat
2.92468183
5
P(T<=t) one-tail 0.00691063
t Critical one-tail
1.79588481
4
P(T<=t) two-tail 0.01382126
t Critical two-tail
2.20098515
9
degrees of freedom=11
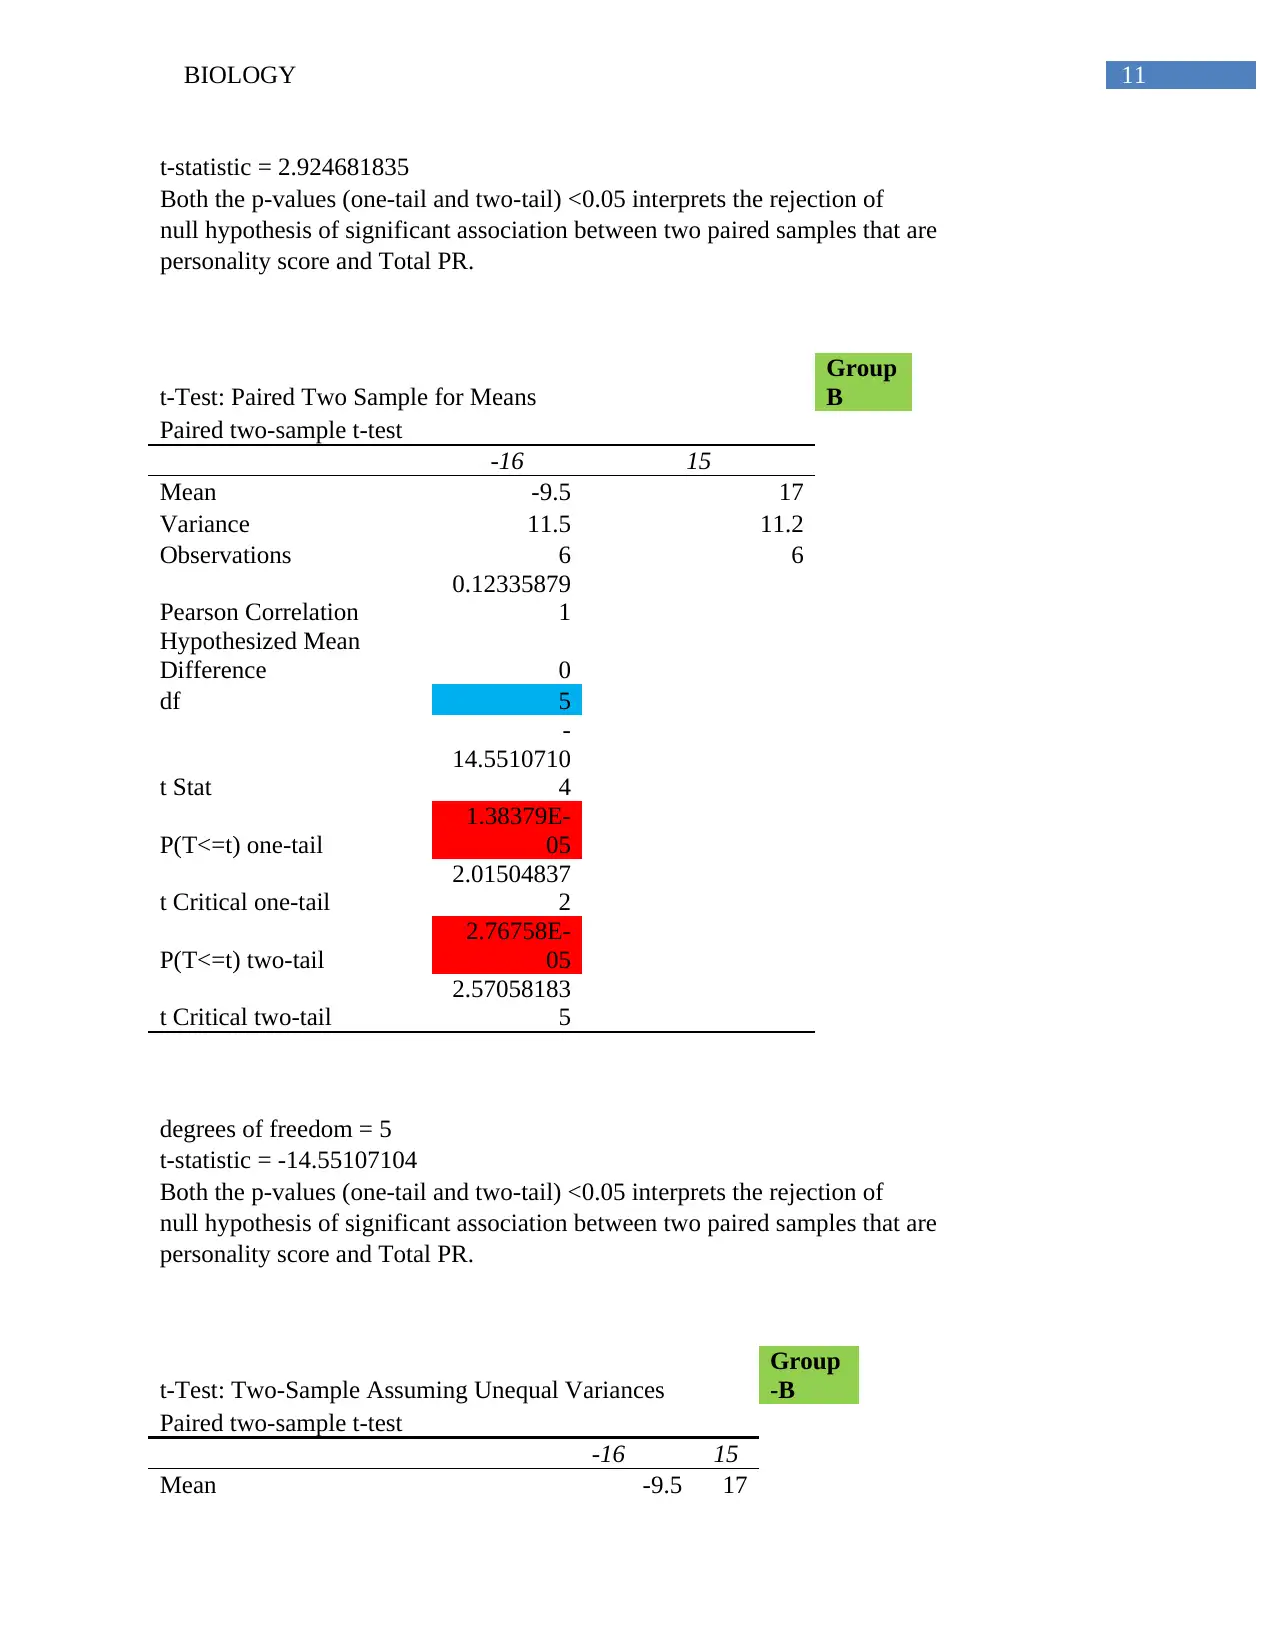
11BIOLOGY
t-statistic = 2.924681835
Both the p-values (one-tail and two-tail) <0.05 interprets the rejection of
null hypothesis of significant association between two paired samples that are
personality score and Total PR.
t-Test: Paired Two Sample for Means
Group
B
Paired two-sample t-test
-16 15
Mean -9.5 17
Variance 11.5 11.2
Observations 6 6
Pearson Correlation
0.12335879
1
Hypothesized Mean
Difference 0
df 5
t Stat
-
14.5510710
4
P(T<=t) one-tail
1.38379E-
05
t Critical one-tail
2.01504837
2
P(T<=t) two-tail
2.76758E-
05
t Critical two-tail
2.57058183
5
degrees of freedom = 5
t-statistic = -14.55107104
Both the p-values (one-tail and two-tail) <0.05 interprets the rejection of
null hypothesis of significant association between two paired samples that are
personality score and Total PR.
t-Test: Two-Sample Assuming Unequal Variances
Group
-B
Paired two-sample t-test
-16 15
Mean -9.5 17
⊘ This is a preview!⊘
Do you want full access?
Subscribe today to unlock all pages.
Trusted by 1+ million students worldwide
1 out of 24
Related Documents


Your All-in-One AI-Powered Toolkit for Academic Success.
+13062052269
info@desklib.com
Available 24*7 on WhatsApp / Email
![[object Object]](/_next/static/media/star-bottom.7253800d.svg)
Unlock your academic potential
Copyright © 2020–2026 A2Z Services. All Rights Reserved. Developed and managed by ZUCOL.