Structured Problem Solving Tools: An In-Depth Analysis

Verified

Added on  2019/12/18

|9
|1469
|234
Homework Assignment
AI Summary
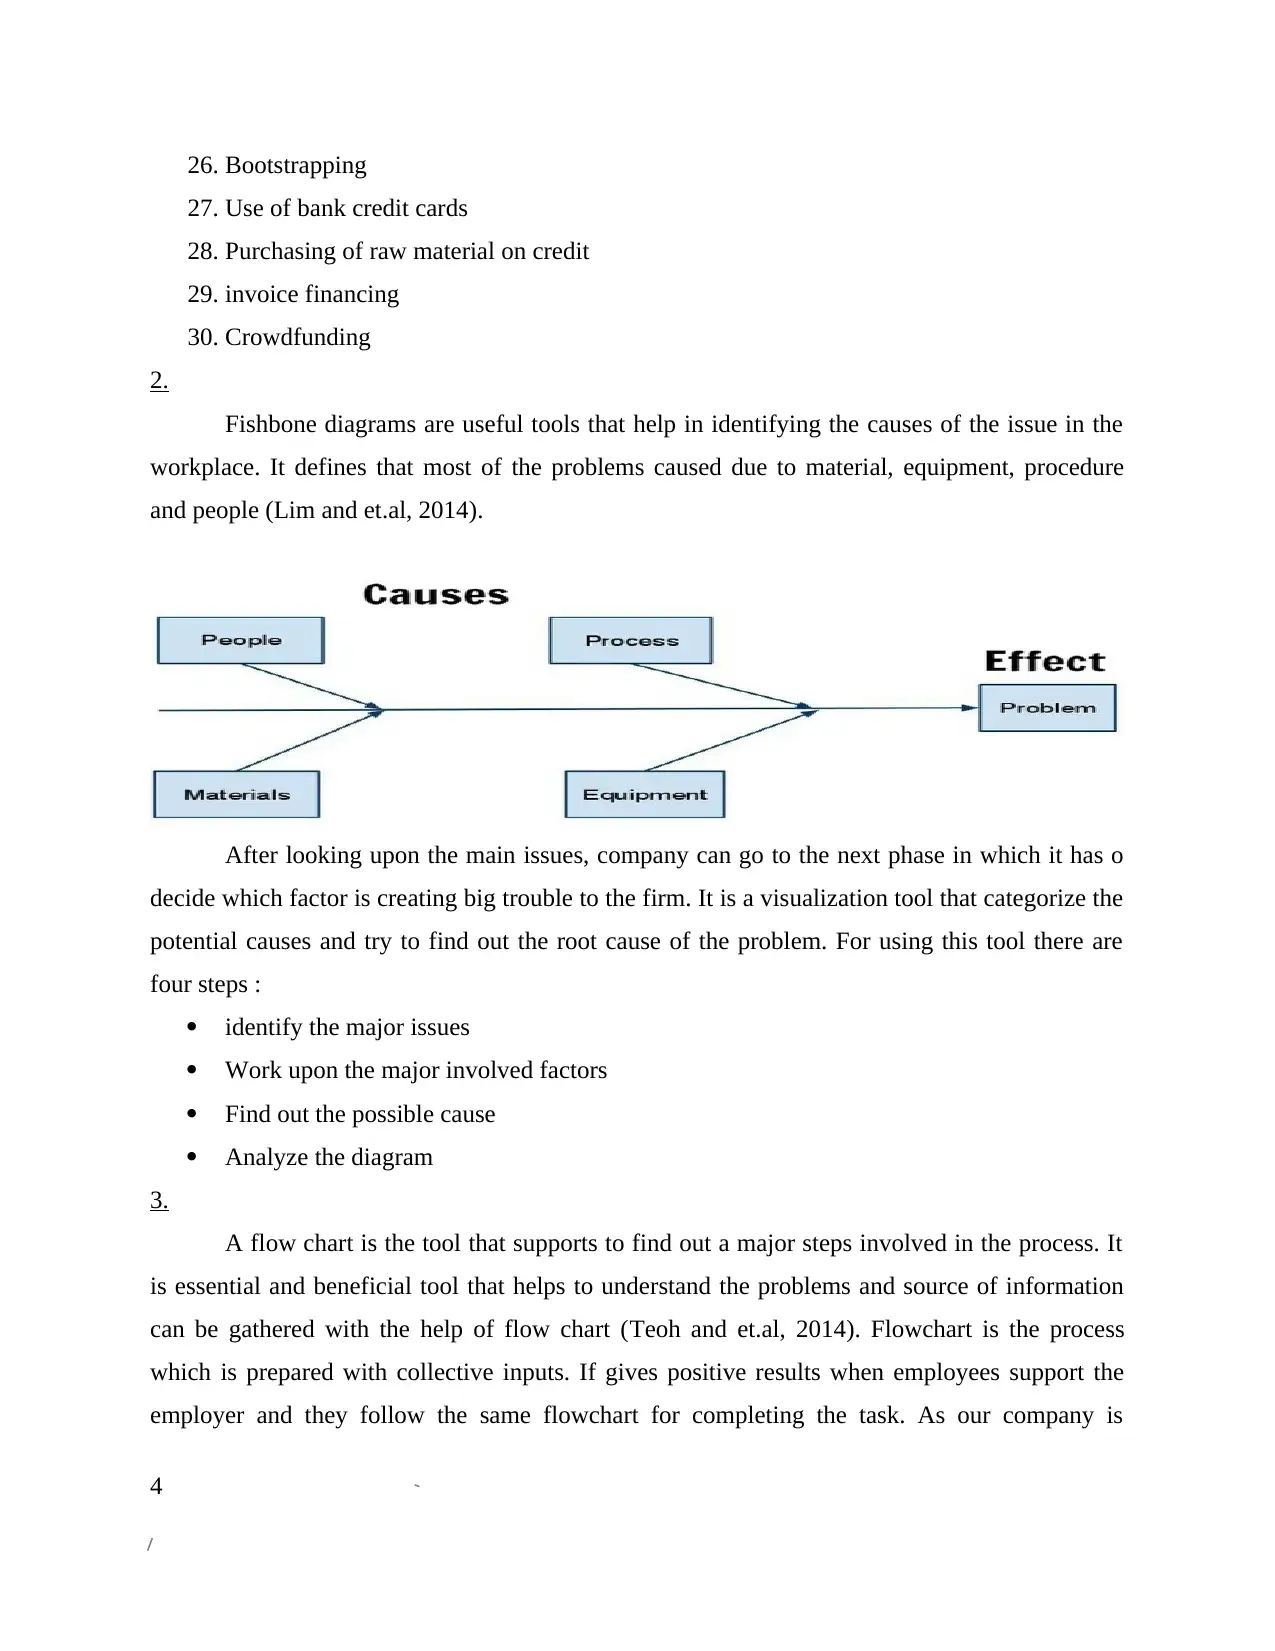
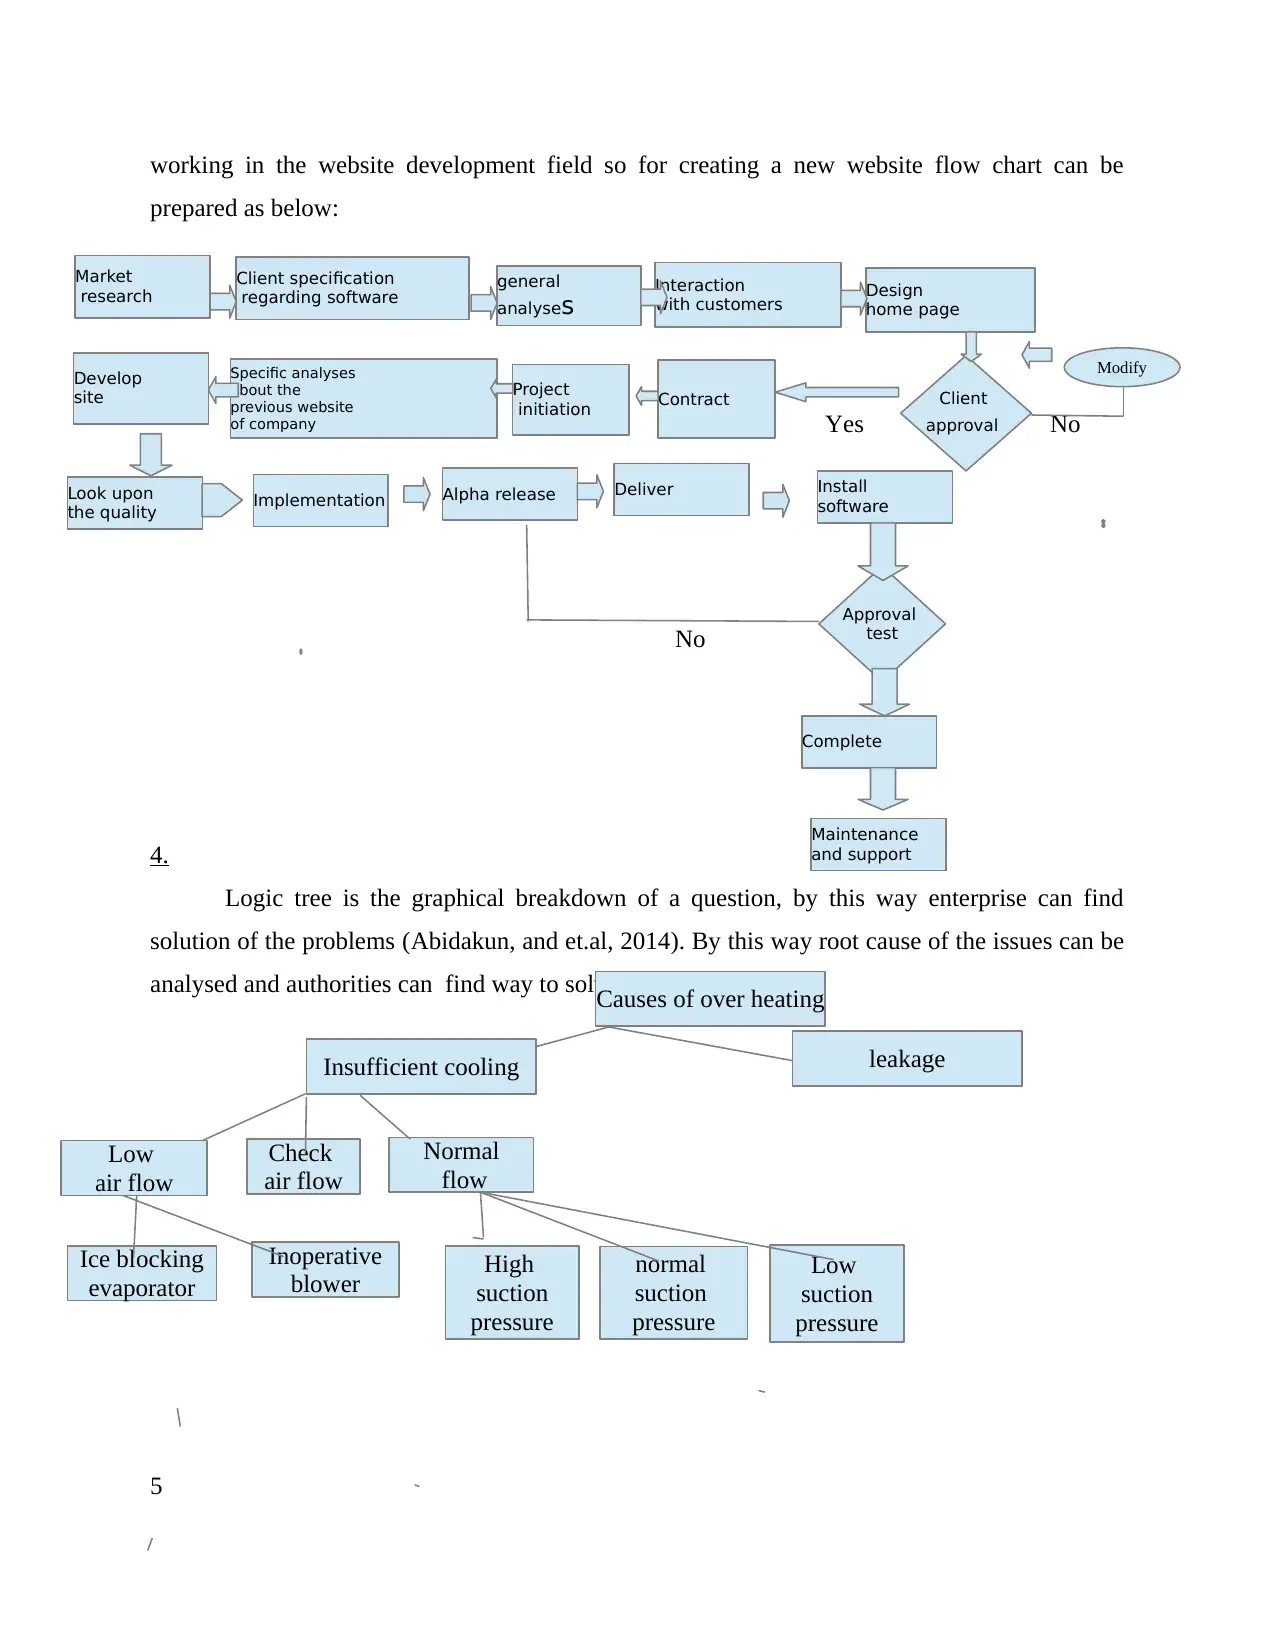
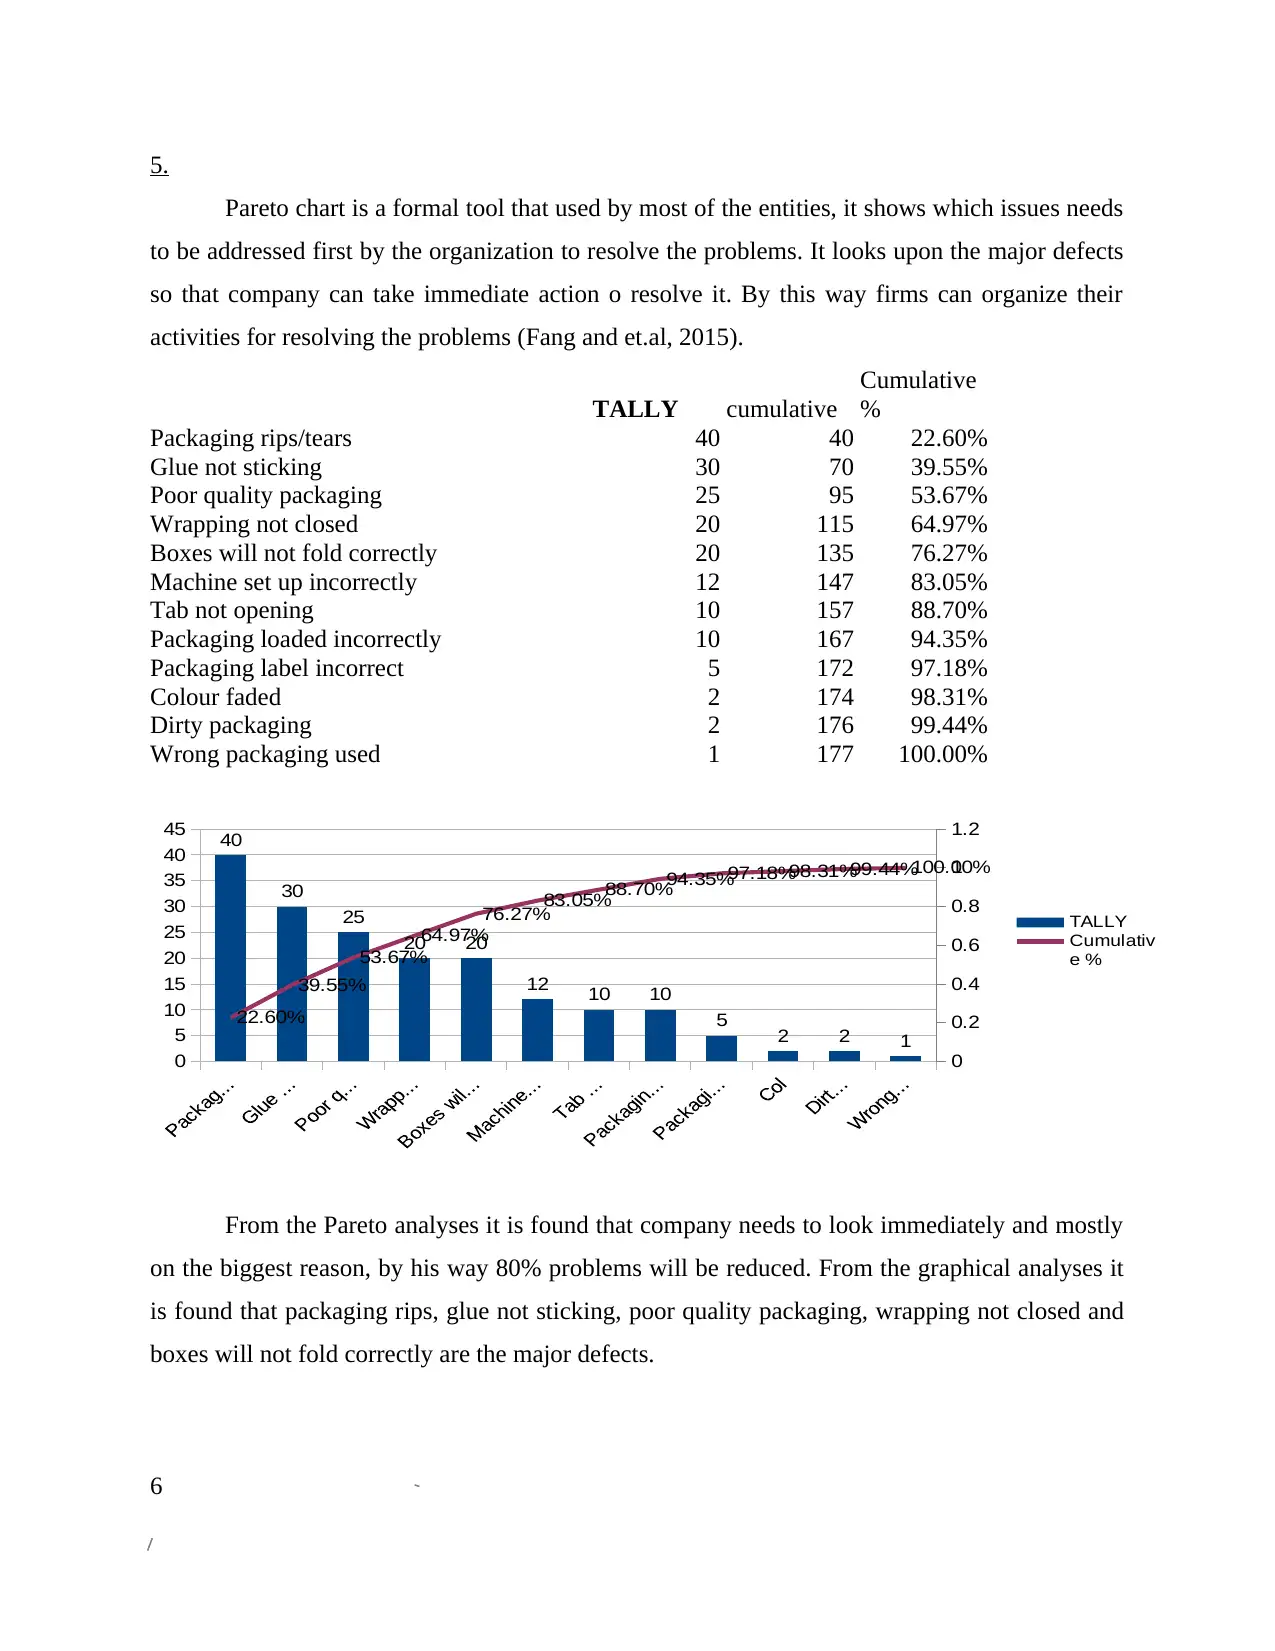
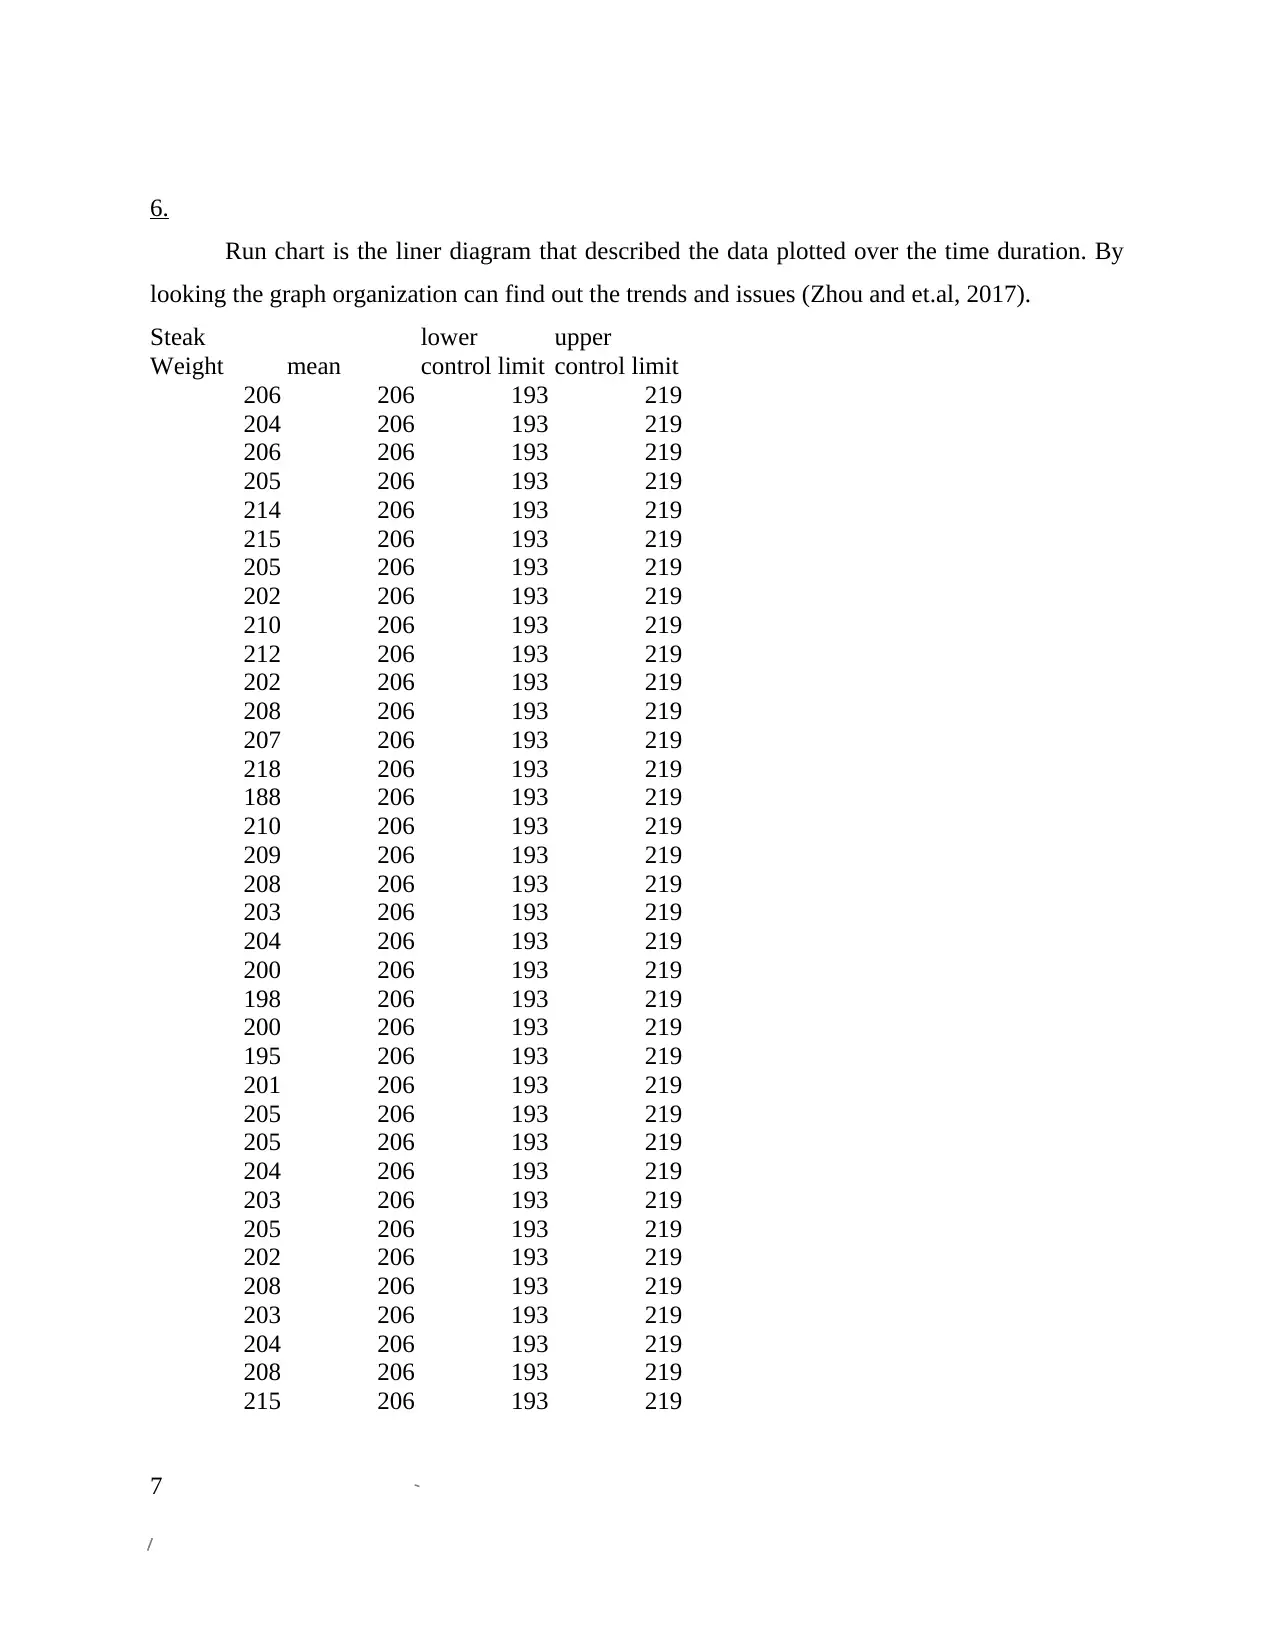
This assignment delves into structured problem-solving tools essential for business analysis and development. It explores various techniques including financial instruments for raising capital, Fishbone diagrams for root cause analysis, flowcharts for process mapping, and logic trees for problem decomposition. The assignment also covers the Pareto chart for prioritizing issues and run charts for data trend analysis. These tools are applied to real-world scenarios, providing a comprehensive understanding of how to identify, analyze, and solve business problems effectively. The document includes diagrams, charts, and references to support the analysis, making it a valuable resource for students studying business and related fields. The assignment demonstrates the practical application of these tools and is available on Desklib, a platform providing past papers and solved assignments for students.
tabler-icon-diamond-filled.svg

Contribute Materials

Your contribution can guide someone’s learning journey. Share your documents today.
Document Page
USE STRUCTURED PROBLEM
SOLVING TOOLS
tabler-icon-diamond-filled.svg

Secure Best Marks with AI Grader

Need help grading? Try our AI Grader for instant feedback on your assignments.
Document Page
TABLE OF CONTENTS
Questions..........................................................................................................................................3
1....................................................................................................................................................3
2....................................................................................................................................................4
3....................................................................................................................................................4
4....................................................................................................................................................5
5....................................................................................................................................................6
6....................................................................................................................................................7
References........................................................................................................................................9
2
Document Page
QUESTIONS
1.
1. Company can take loan from the financial institutes.
2. By selling the shares of the firm, company can arrange funds for he further development.
3. By involving another partner in the organization it would be easy for the firm to fulfill its
monitory requirement.
4. ESVF (Early stage venture fund) can be helpful.
5. Personal saving (Haendel and et.al, 2015).
6. It can take support of family and friends
7. It can select venture capital as source of finance
8. Taking government grants
9. Sell of assets
10. It should take support of bonds for raising capital for specific activity.
11. Lease
12. Bank C.C
13. Warrants
14. Initial public offering (IPOs).
15. Angel investors
16. By reducing the direct and indirect cost, organization can save money and this funds can
be used for the improvement of the entity.
17. By minimizing the wastage it can raise capital and can use this funds for further
improvements.
18. Retained earnings
19. Franchising
20. Business expansion scheme funds
21. Loan stock
22. bank overdraft
23. Accounts receivable financing
24. customers advance
25. Selling good on installment
3
Document Page
26. Bootstrapping
27. Use of bank credit cards
28. Purchasing of raw material on credit
29. invoice financing
30. Crowdfunding
2.
Fishbone diagrams are useful tools that help in identifying the causes of the issue in the
workplace. It defines that most of the problems caused due to material, equipment, procedure
and people (Lim and et.al, 2014).
After looking upon the main issues, company can go to the next phase in which it has o
decide which factor is creating big trouble to the firm. It is a visualization tool that categorize the
potential causes and try to find out the root cause of the problem. For using this tool there are
four steps :
identify the major issues
Work upon the major involved factors
Find out the possible cause
Analyze the diagram
3.
A flow chart is the tool that supports to find out a major steps involved in the process. It
is essential and beneficial tool that helps to understand the problems and source of information
can be gathered with the help of flow chart (Teoh and et.al, 2014). Flowchart is the process
which is prepared with collective inputs. If gives positive results when employees support the
employer and they follow the same flowchart for completing the task. As our company is
4
tabler-icon-diamond-filled.svg

Secure Best Marks with AI Grader

Need help grading? Try our AI Grader for instant feedback on your assignments.
Document Page
working in the website development field so for creating a new website flow chart can be
prepared as below:
Yes No
No
4.
Logic tree is the graphical breakdown of a question, by this way enterprise can find
solution of the problems (Abidakun, and et.al, 2014). By this way root cause of the issues can be
analysed and authorities can find way to solve the problem.
5
Market
research
Client specification
regarding software general
analyses Interaction
with customers Design
home page
Modify
Client
approval
Contract
Project
initiation
Specific analyses
about the
previous website
of company
Develop
site
Look upon
the quality Implementation Deliver Install
software
Approval
test
Complete
Maintenance
and support
Alpha release
Causes of over heating
Insufficient cooling
Low
air flow
Check
air flow
leakage
Normal
flow
Ice blocking
evaporator High
suction
pressure
normal
suction
pressure
Low
suction
pressure
Inoperative
blower
Document Page
5.
Pareto chart is a formal tool that used by most of the entities, it shows which issues needs
to be addressed first by the organization to resolve the problems. It looks upon the major defects
so that company can take immediate action o resolve it. By this way firms can organize their
activities for resolving the problems (Fang and et.al, 2015).
TALLY cumulative
Cumulative
%
Packaging rips/tears 40 40 22.60%
Glue not sticking 30 70 39.55%
Poor quality packaging 25 95 53.67%
Wrapping not closed 20 115 64.97%
Boxes will not fold correctly 20 135 76.27%
Machine set up incorrectly 12 147 83.05%
Tab not opening 10 157 88.70%
Packaging loaded incorrectly 10 167 94.35%
Packaging label incorrect 5 172 97.18%
Colour faded 2 174 98.31%
Dirty packaging 2 176 99.44%
Wrong packaging used 1 177 100.00%
From the Pareto analyses it is found that company needs to look immediately and mostly
on the biggest reason, by his way 80% problems will be reduced. From the graphical analyses it
is found that packaging rips, glue not sticking, poor quality packaging, wrapping not closed and
boxes will not fold correctly are the major defects.
6
0
5
10
15
20
25
30
35
40
45
0
0.2
0.4
0.6
0.8
1
1.2
40
30
25
20 20
12 10 10
5 2 2 1
22.60%
39.55%
53.67%
64.97%
76.27%
83.05%
88.70%
94.35%97.18%98.31%99.44%100.00%
TALLY
Cumulativ
e %
Document Page
6.
Run chart is the liner diagram that described the data plotted over the time duration. By
looking the graph organization can find out the trends and issues (Zhou and et.al, 2017).
Steak
Weight mean
lower
control limit
upper
control limit
206 206 193 219
204 206 193 219
206 206 193 219
205 206 193 219
214 206 193 219
215 206 193 219
205 206 193 219
202 206 193 219
210 206 193 219
212 206 193 219
202 206 193 219
208 206 193 219
207 206 193 219
218 206 193 219
188 206 193 219
210 206 193 219
209 206 193 219
208 206 193 219
203 206 193 219
204 206 193 219
200 206 193 219
198 206 193 219
200 206 193 219
195 206 193 219
201 206 193 219
205 206 193 219
205 206 193 219
204 206 193 219
203 206 193 219
205 206 193 219
202 206 193 219
208 206 193 219
203 206 193 219
204 206 193 219
208 206 193 219
215 206 193 219
7
tabler-icon-diamond-filled.svg

Paraphrase This Document

Need a fresh take? Get an instant paraphrase of this document with our AI Paraphraser
Document Page
202 206 193 219
218 206 193 219
220 206 193 219
210 206 193 219
1
2
3
4
5
6
7
8
9
10
11
12
13
14
15
16
17
18
19
20
21
22
23
24
25
26
27
28
29
30
31
32
33
34
35
36
37
38
39
40
170
180
190
200
210
220
230 Run chart
Steak Weight
mean
lower control limit
upper control limit
1. When there is high fluctuation then company will have to take corrective actions. By
looking upon the graphical presentation it can be said that firm is needed to take action
when weight is 208 and 2015 (PARETO CHART, 2017). That is the warning signal and
here is required to take immediate action.
2. Unavailability of raw material when production run was made.
3. Reasons of causing thing to be under specification are as following:
Under weight
Incorrect labels
Faulty packaging of material
4. Reasons that could have caused things to be over the specification are described as
below:
Over weight
Physical contamination
Incorrect labels.
8
Document Page
REFERENCES
Books and Journals
Abidakun, O. A. and et.al., 2014. Quality improvement of foundry operation in NIGERIA using
six sigma technique. Canadian Journal of Pure and Applied Sciences. 8(1). pp.2751-2760.
Fang, Z. and et.al., 2015. Study on quality risk control of large-scale complex equipment based
on a'game-fishbone diagram'model. The Journal of Grey System. 27(2). pp.27-38.
Haendel, A. and et.al., 2015. Mixtures of ground-motion prediction equations as backbone
models for a logic tree: an application to the subduction zone in Northern Chile. Bulletin of
Earthquake Engineering. 13(2). pp.483-501.
Lim, C. and et.al., 2014. Sensitivity analysis based on numerical results of various logic tree
Fault parameters in the East-Sea tsunami simulation.
Teoh, W. L. and et.al., 2014. Optimal design of the double sampling chart with estimated
parameters based on median run length. Computers & Industrial Engineering. 67. pp.104-
115.
Zhou, Y. and et.al., 2017. Research on the Influence of Abstract Knowledge to the Individual
Cognitive Behavior and Innovative Design Thinking. In Advances in Neuroergonomics
and Cognitive Engineering (pp. 51-63). Springer International Publishing.
Online
PARETO CHART, 2017. [Online] Available through: <http://asq.org/learn-about-quality/cause-
analysis-tools/overview/pareto.html>. [Accessed on 11th March 2017].
9
chevron_up_icon
1 out of 9
circle_padding
hide_on_mobile
zoom_out_icon
logo.png

Your All-in-One AI-Powered Toolkit for Academic Success.

Available 24*7 on WhatsApp / Email

[object Object]